Nano-Silica-Particles Filling Effect on Mechanical Properties of Silicone-Rubber Composites
Funding: This work was supported by the Japan Society for the Promotion of Science (JSPS), KAKENHI, Grant Numbers JP17K06053 and JP20K04159.
[Correction added on 13, February, 2025 after first online publication: The copyright line was changed.]
ABSTRACT
The mechanical properties of silicone-rubber composites filled with nano- or micro-silica-particles are discussed experimentally and theoretically. The matrix rubbers cured under various ratios of the main component to the curing agent are prepared to change the crosslinking density of the matrix rubber. Because the interphase layer made of the matrix rubber in the glassy state is formed around the nano-particle, the nano-particle behaves as an apparent single particle together with the interphase layer and the interphase layers apparently increase the nano-particle volume fraction. The Young's moduli of the nano- and micro-composites with a larger (apparent) particle volume fraction are greater than that of the matrix rubber. However, the proportional limit strains are smaller, although the fracture strains are slightly smaller. The Young's modulus and proportional limit strain can be analyzed theoretically with the (apparent) volume fraction. The fracture toughness of the composites increases as the (apparent) volume fraction increases, but it increases little at the (apparent) volume fraction above 0.2. However, the fracture toughness monotonically increases for the nano-composites with low crosslinking density of the matrix rubber. Finally, the mechanical properties can be designed by using the matrix rubber with the different crosslinking density and the interphase layer.
1 Introduction
Silicone rubber has been widely used in several industrial applications due to its excellent properties, such as, heat resistance, electrical insulation, water resistance, and weather resistance. The mechanical properties of silicone rubbers filled with silica particles have been investigated [1-7]. Adding silica particles to silicone rubber has been shown to improve elastic modulus, tensile and shear strength, breaking strain, and electrical resistance properties as an electrical insulating adhesive [8-10].
The mechanical properties are generally designed by changing the filler amount with its mechanical properties, so the deformation properties of the composites (e.g., elasticity, viscoelasticity, and thermal expansion) can be predicted from the properties of fillers and matrix material using a mixture law [11, 12] (e.g., those of Lewis and Nielsen [13], Mori and Tanaka [14], Guth and Gold [15]).
The mechanical properties of composites are further improved by reducing the particle size below the micro-order. Some researchers [16-18] have pointed out that the elastic or viscoelastic moduli of the composites in a rubbery state are larger than those evaluated using a mixture law as the filler size is reduced below the micrometer order. The size effect has been interpreted from several viewpoints, for example, larger specific surface area of smaller particles [19, 20], mobility [21], and stiffness [22, 23] of the matrix between small particles, and special bonding between particle and matrix [24].
Particle-size effects on mechanical properties of composites are attributed to stiff interphase layers formed around nano-particles [25]. Generally, the interphase layers can be formed using coupling-agent coating on the surfaces of particles to bond the particles and matrix polymer [26-29]. Even though the particles are not coated chemically with a coupling agent, the interphase layers were obtained to form on the nano-particles owing to entanglement of matrix molecules and particles. The existence of the interphase layers in the nano-composites has been verified through microthermal analysis [30], scanning electron microscopy [31, 32], and Raman spectroscopy [33]. The interphase layers on the nano-particles in a rubber composite were found to be made of glassy matrix material even though the composite was in the rubbery state and the deformation properties depended on the volume fraction of apparent particles composed of the nanoparticles and interphase layer by Adachi et al. [34, 35]. The deformation properties were also clarified to depend on the volume fraction of the apparent particles composed of the nanoparticles and interphase layer. Lewis and Nielsen's mixture law with the apparent volume fraction was validated to evaluate Young's modulus of the rubber composite in the linear elastic region of the measured tensile stress–strain relations [35]. The proportional limit strain predicted by the theoretical analysis was validated by comparing it with the measured results of the composites filled with the nano- and micro-particles when the (apparent) volume fraction of the particles was less than the threshold of the particle percolation, 0.3 [34]. However, the mechanical properties of the composite have not been clarified from the viewpoint of the interaction between the internal structure of the matrix and the nano-particles.
In the paper, the mechanical properties of the rubber composites filled with the particles, such as deformation, stiffness, strength, and fracture toughness, are discussed on the basis of the experimental results for silicone rubbers filled with nano- or micro-silica-particles to clarify the effects of filling the particles. The matrix rubbers with different internal structures cured under various weight ratios of the main component to the curing agent of the rubber were prepared to consider the interaction effect between the particles and matrix rubber on the properties. The tensile and fracture tests for the composites were conducted to identify the fundamental and important mechanical properties of the composites, such as Young's modulus and proportional limit as material stiffness, strength, and toughness of the composites. In conclusion, the mechanical properties of the composites are discussed from the relation between the nano-particles and the internal structure of the matrix rubber.
2 Materials and Methods
2.1 Specimen Materials
Silicone rubber was filled with spherical silica particles to produce the composite materials for the specimens. The silicone rubber (density: 1.0 × 10³ kg m−3) was made from a mixture of the main compound (Shin-Etsu Chemical, KE-106) and the curing agent (Shin-Etsu Chemical, CAT-TG). The mixture weight ratio of the main compound to the curing agent was 10 as specified by the material company. The filler for the composites was made of non-chemically coated silica particles with a median diameter of 300 nm, that is, nano-particles (Admatechs, SO-C1) or 1.6 μm, that is, micro-particles (Admatechs, SO-C5). The volume fractions of the silica particles in the composites ranged from 0 to 0.18. The density and Young's modulus of the silica particle were 2.2 × 10³ kg m−3 and 71.2 GPa.
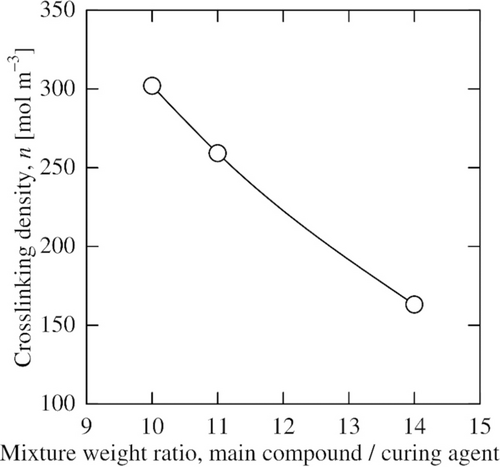
The mixture weight ratios of the main compound to the curing agent were varied to 10, 11, and 14 to take into consideration the interaction between the silica particles and the internal structure in the matrix rubber [36, 37]. Hereafter, the ratio is simply called “mixture weight ratio.”
To manufacture the rubber composites, the silica particles were blended with the mixture of the main compound and curing agent until all particles dispersed without agglomeration or sedimentation. The complete blend was degassed in a vacuum vessel and then poured into Teflon molds having the shape of the specimens. The blend in the mold was heated to cure it in an oven. The curing procedure was done in three steps of pre-curing where the blend was kept at 323 K for 0.5 h, 373 K for 0.5 h, and 423 K for 0.5 h to decelerate the rapid chemical reaction due to self-heating in the curing process. The cured rubbers without the silica particles, were referred to as neat rubbers in the paper, were also prepared by using the same process as that for the composites.
This paper refers to the composites filled with nano-particles and micro particles as nano-composites and micro-composites, respectively. The composites and the rubbers produced in this research are listed in Table 1.
| Material | Matrix rubber | Silica particle | |||
|---|---|---|---|---|---|
| Mixture weight ratio | Crosslinking density (mol m−3) | Average diameter (nm) | Volume fraction | Apparent volume fraction | |
| Neat rubber | 10 | 302 | — | — | — |
| 11 | 259 | — | — | — | |
| 14 | 163 | — | — | — | |
| Nano-composite | 10 | 302 | 300 | 0.08 | 0.137 |
| 10 | 302 | 300 | 0.10 | 0.172 | |
| 10 | 302 | 300 | 0.15 | 0.258 | |
| 10 | 302 | 300 | 0.18 | 0.309 | |
| 11 | 259 | 300 | 0.08 | 0.137 | |
| 11 | 259 | 300 | 0.10 | 0.172 | |
| 11 | 259 | 300 | 0.15 | 0.258 | |
| 11 | 259 | 300 | 0.18 | 0.309 | |
| 14 | 163 | 300 | 0.08 | 0.137 | |
| 14 | 163 | 300 | 0.10 | 0.172 | |
| 14 | 163 | 300 | 0.15 | 0.258 | |
| 14 | 163 | 300 | 0.18 | 0.309 | |
| Micro-composite | 10 | 302 | 1600 | 0.08 | — |
| 10 | 302 | 1600 | 0.10 | — | |
| 10 | 302 | 1600 | 0.15 | — | |
| 10 | 302 | 1600 | 0.18 | — | |
| 10 | 302 | 1600 | 0.30 | — | |
| 11 | 259 | 1600 | 0.08 | — | |
| 11 | 259 | 1600 | 0.10 | — | |
| 11 | 259 | 1600 | 0.15 | — | |
| 11 | 259 | 1600 | 0.18 | — | |
| 11 | 259 | 1600 | 0.30 | — | |
| 14 | 163 | 1600 | 0.08 | — | |
| 14 | 163 | 1600 | 0.10 | — | |
| 14 | 163 | 1600 | 0.15 | — | |
| 14 | 163 | 1600 | 0.18 | — | |
| 14 | 163 | 1600 | 0.30 | — | |
2.2 Material Characterization
2.2.1 Thermo-Viscoelastic Property
The thermo-viscoelastic properties of the neat silicone rubbers and composites were measured by using a non-resonance tensile method with a dynamic viscoelastometer (Rheogel-E4000, UBM). The specimen was 35 mm long, 5 mm wide, and 2.5 mm thick, and the distance between gripping devices was 25 mm. For tensile oscillations with frequencies of 3.16, 10, 31.6, and 100 Hz and an amplitude of 0.1 mm, the dynamic complex moduli of the specimens were measured at intervals of 1 K from 173 to 373 K. The heating rate was 1 K min−1.
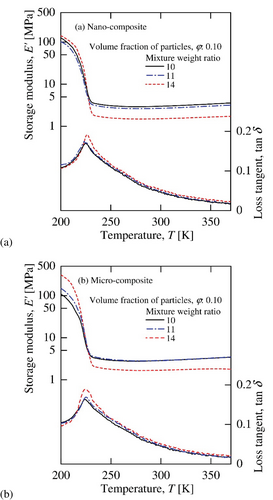
Figure 1 shows the temperature dependences of the storage moduli and loss tangents of the neat rubbers with different mixture weight ratios and the composites with different particle diameters. The storage moduli are found to depend on the mixture weight ratios in Figure 1a. The storage moduli of the nano-composites were higher than those of the micro-composites in Figure 1b, because the nano-particles behave as apparent particles together with the interphase layers formed around the nano-particles [33-35]. Only one glass transition was observed for any composite, and the glass transition temperatures of the specimens determined at maximum peaks of the loss tangents were found to be constant, 226 K, regardless of the mixture weight ratio, particle size, and volume fraction of the particles. These results indicate that the states of the matrix rubbers below the glass transition temperature were uniformly glassy for the nano- and micro-composites and the same as those of the neat rubbers [34, 35].
2.2.2 Crosslinking Density
2.2.3 Apparent Volume Fraction of Particles
Here, E M ′ and v M are the storage modulus and Poisson's ratio of the neat rubber with the same crosslinking density as that of the composite, and E P is Young's modulus of the silica particles. The maximum packing fraction φ MAX is 0.74 for spheres in closed packing [21, 33].
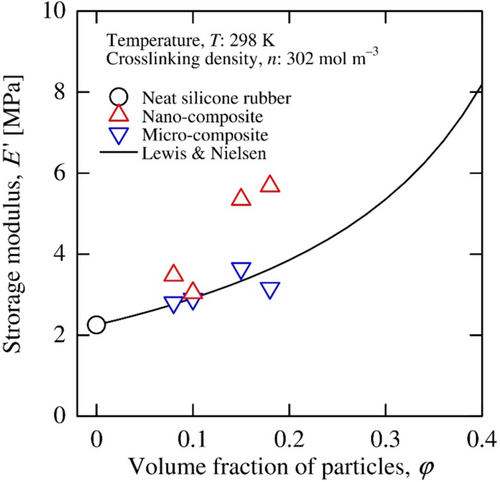
The storage moduli of the micro-composites were in agreement with the results of the mixture law in Figure 3. The moduli of the nano-composites were larger than those of the micro-composites. We have clarified that the difference between those moduli is due to the increase in the apparent volume fraction of the particles caused by the stiff interphase layers formed around the nano-particles and made of the matrix rubber in the glassy state, because regardless of the presence of particles, all materials had only a single glass transition [34, 35].
The average thickness of the interphase layers was evaluated using a mixture law of the linearly thermal expansion coefficient by Gonázalez-Benito et al. [40] and Ansorge and Papailiou [41]. However, these evaluated thicknesses were not verified from experimental results. We consider that the existence of the interphase layers around the nano-particles caused the difference between the measured storage moduli for the nano-composites in the rubbery state (10 Hz, 293 K) and the results calculated by the mixture law, Equation (2), which normally gives accurate predictions, and inverse-analyzed the volume fraction of the particles having the surrounding interphase layers from the difference [34, 35]. Hereafter, the particle with the interphase layer and its whole volume fraction are referred to as the apparent particle and apparent volume fraction.
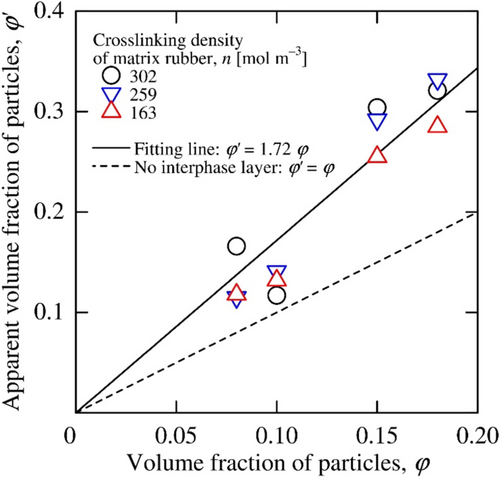
By substituting Equation (3) into Equation (4), the average interphase layer thickness was found to be 30 nm and 10% of the nano-particle diameter. This interphase thickness was reported as in our paper [35]. The thickness above a particle volume fraction of 0.10 ranged from 40 to 20 nm and is in approximate agreement with the 31.9 nm calculated by Equation (4).
The mechanical properties of the nano-composites were organized in accordance with the apparent volume fractions of the nano-particles in the following. The apparent particle volume fraction determined from the viscoelastic properties of each specimen material was used instead of Equation (3). For the micro-composite results in the following figures, the apparent volume fraction of the particles means the actual volume fraction because of no interphase.
2.3 Experimental Methods
2.3.1 Tensile Test
The stress–strain relations of the neat rubbers and composites were measured with tensile tests at room temperature. The specimens were dumbbell-shaped: Type 3, JIS K6251 (Type 1A, ISO 37). A constant displacement rate of 10 mm min−1 was applied, and the tensile load was recorded using a universal material-testing machine (4444, Instron). The true stresses and logarithmic strains of the specimens were evaluated from the longitudinal and transverse strains with a gage length of 5 mm, which were measured by processing motion pictures of the specimen deformations with digital image processing software (Photron Fastcam Viewer and Analysis, Photron). After the tensile tests, the fracture surfaces of the specimens were observed using a low-vacuum scanning electron microscope (SU3500, Hitachi) without coating the electrically conducting material.
2.3.2 Fracture Test
Double-edge-notched tensile (DENT) tests were performed at room temperature to measure the mode I fracture toughness of the neat rubbers and composites. The specimens were strip plates that were 120 mm long, 20 mm wide, and 5 mm thick. 5-mm-long pre-cracks were placed on both side edges near the middle point of the specimen. A constant displacement rate of 10 mm min−1 was applied to the specimen, and the tensile load was recorded using a universal material-testing machine (4444, Instron) to evaluate the tensile load–displacement curve. The crack opening displacement of the specimen during the test was also measured by image processing on the video of the crack during the test with software (Matlab 2022, MathWorks) created by the authors. The fracture surfaces of the specimens after the fracture tests were observed using a low-vacuum scanning electron microscope (SU3500, Hitachi) without coating the electrically conducting material.
3 Results and Discussion
3.1 Experimental Results
3.1.1 Tensile Test
3.1.1.1 Stress–Strain Curve
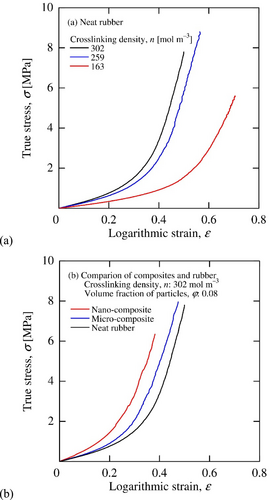
Figure 5 shows the true stress–logarithmic strain curves of the neat rubbers, nano-composites, and micro-composites until the fractures. Every curve was J-shaped: the slope was low at the low strain region and after that the slope increased drastically until the fracture. The slopes of the curves became larger as the crosslinking density of the matrix rubber, and the volume fraction of the particles increased. The slopes of the curves for the nano-composites are larger than those of the micro-composites.
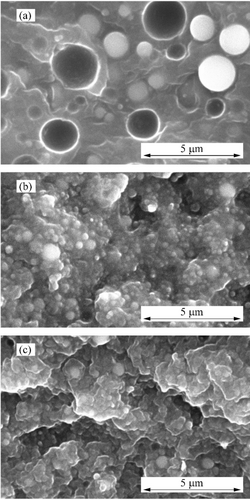
After the tests, the fracture surfaces of the composites were observed. Figure 6 shows the fracture surfaces of the micro- and nano-composites observed with a scanning electron microscope. In the result of the micro-composite, the exposed particles and holes where the particles fell off were observed, indicating that the fracture propagated along the particle surfaces. On the other hand, the fracture surface of the nano-composite has no exposed particles or holes where particles fell off, and the fracture surface is shown to be formed between the interphase layers covering the nano-particle surfaces and the matrix rubber.

In previous studies [34, 35], the interphase layer has been clarified to be made of the matrix rubber in a glassy state even when the composite is in a rubbery state and formed by the rubber molecules and nano-particles entangling, even though a chemical coating was not applied on the particle surfaces here.
3.1.1.2 Young's Modulus and Proportional Limit Strain
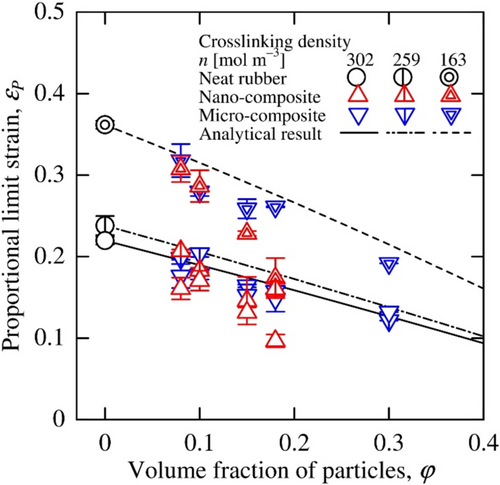
The slopes of the stress–strain curves in the low-stress regions are important characteristics that indicate the flexibility of rubber materials. The stress–strain curves were thus approximated by straight lines defined from their origins by the least-squares method with the coefficient of determination of 0.99. The region of the approximated line was determined as the linear low elastic deformation region, and its slope and maximum strain in the region were evaluated as the Young's modulus and proportional limit strain of each material.
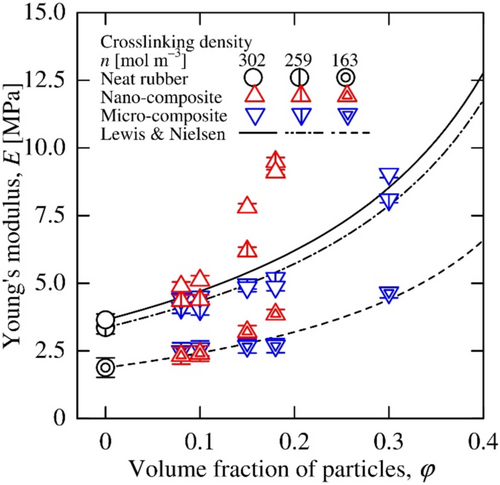
The determined Young's moduli E(φ) of the neat rubbers and composites are shown in Figure 7. The Young's moduli were found to increase as the crosslinking density of the matrix rubber increased and the volume fraction of the particles increased. The Young's moduli of the micro-composite agree with the results of Lewis and Nielsen's mixture law (Equation (2)). As mentioned earlier, the results for the nano-composites were larger than those for the mixture law due to the presence of the interphase layers formed around the nano-particles. This tendency was particularly noticeable for the volume fraction of the particles exceeding 0.15.
3.1.1.3 Fracture Strain
Next, the strengths of the neat rubbers and composites are evaluated from the stress–strain curves. Because the stress fluctuates greatly for small variations of the strain near the fracture of the J-shaped stress–strain curve (Figure 5), the maximum stress is an inappropriate indicator of each material strength. Therefore, the fracture strains are evaluated as the strength of the materials.
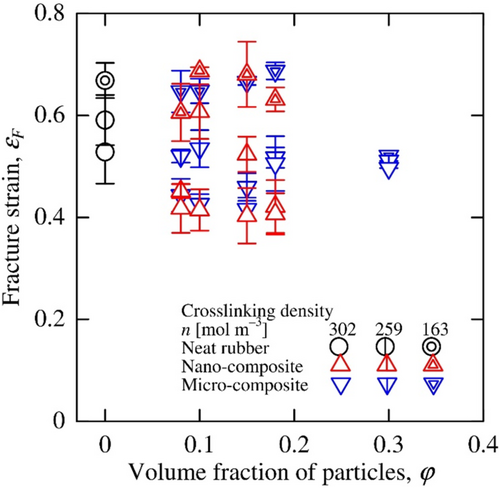
The fracture strains are plotted in Figure 9. Although the measured fracture strains varied widely, the fracture strains were clearly reduced for the rubbers and composites with a high crosslinking density. However, the volume fraction and size of the particles had little effect on the fracture strains.
3.1.2 Fracture Test
3.1.2.1 Force–Deformation Curve
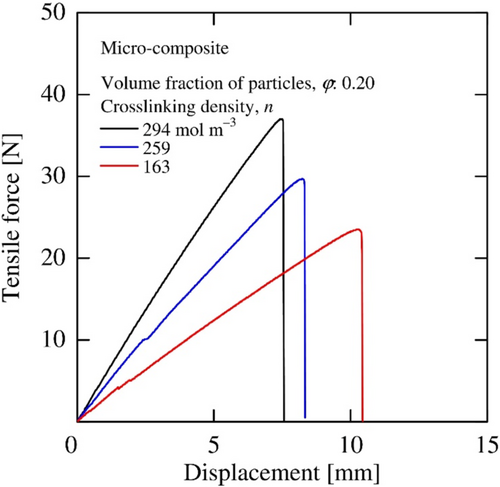
The tensile force–deformation curves of the micro-composites with the volume fraction of the particles, 0.20, are shown in Figure 10. The tensile force–deformation curves for all neat rubbers and composites were linear until the fractures due to a rapid crack propagation. Naturally similar to the results of the Young's moduli (Figure 7), the slopes of the force–deformation curves increased for the specimen with the higher crosslinking density of the matrix rubber and the larger volume fraction of particles.
3.1.2.2 Crack Opening Displacement
Since rubber deforms largely, the applicability of linear fracture mechanics must be carefully considered to determine the fracture toughness of the rubber composites. Liang and Pearson [42] discussed the plastic zone near the crack tip in the hybrid epoxy-silica-rubber nano-composites. For the rubber composites in the paper, the load-deformation curves of the fracture tests (Figure 10) were linear until the fracture, so the plastic zone near the crack tip of the composites can be predicted to be small. To further examine the applicability of linear fracture mechanics in detail, the crack opening displacements (CODs), ΔU, were measured until fracture for the neat rubbers and composites. The measured distributions of the CODs, ΔU, before the fracture for the nano- and micro-composites are shown as logarithmic graphs in Figure 11. The CODs were found to be linear in the area from the distance longer than 0.5 mm from the crack tip.
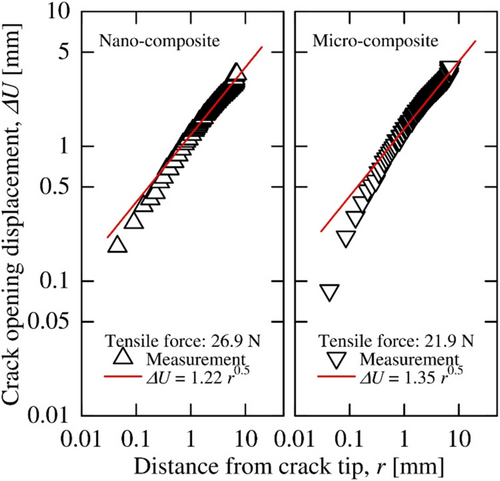
The results clarified that the CODs for distances greater than a fraction of a millimeter from the crack tip were approximately proportional to the square root of the distance theoretically obtained from linear fracture mechanics. Therefore, the linear fracture mechanics was applicable to the results of the fracture test.
3.1.2.3 Fracture Toughness
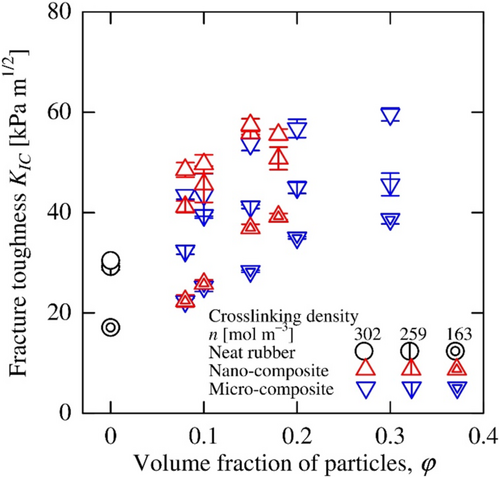
The determined fracture toughness of each specimen is shown in Figure 12. The fracture toughness is larger for the composite with the larger crosslinking density. The fracture toughness of the specimen with the same crosslinking density of the matrix rubber increases as the volume fraction of the particles increases. The fracture toughness of the specimen with the volume fraction above roughly 0.15 remains constant and does not increase. The maximum value of the fracture toughness of the nano-composite with a crosslink density of 259 mol m−3 was obviously larger than those of the micro-composites with the same crosslink density, although the fracture toughness of the composites with the other crosslinking densities had similar maximum values regardless of filling particle sizes. This result suggests that the nano-particle filling has different effects on the fracture toughness of the composites depending on the crosslinking density of the matrix rubber.
After the tests, the fracture surfaces of the composites were observed. Figure 13 shows the fracture surfaces of the micro- and nano-composites observed with a scanning electron microscope. Similar to the surfaces in Figure 6, the exposed particles and the fracture surface holes where the particles fell off were observed on the micro-composite (Figure 13a), indicating that the fracture propagated along the particle surfaces. On the hand, the fracture surfaces on the nano-composites have no exposed particles or holes, so the crack propagated between the interphase layers and matrix rubbers (Figure 13b,c). However, the effect of the crosslink density in the rubber matrix was not clearly observed on the fracture surfaces.
3.2 Discussion
3.2.1 Filling-Particles Effect
3.2.1.1 Normalized Properties
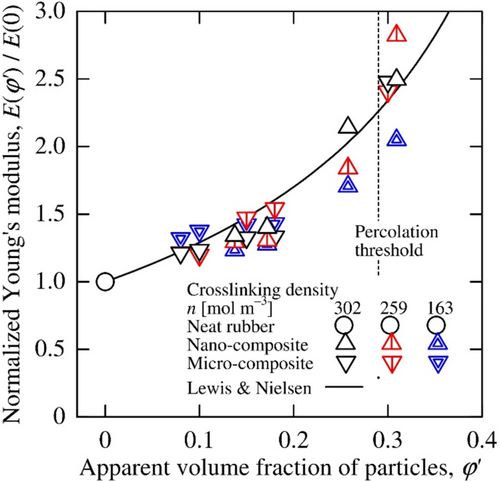
To assess filling-particles effects on the mechanical properties of the composites, each property of the composites was normalized by the property of the neat rubber having the same crosslinking density, that is, the normalized mechanical property denotes improvement from that of the neat rubber. The percolation threshold for spheres distributed in a three-dimensional domain, an important aspect of particle distribution, is 0.29 [44] and is shown by the broken line in the figures below.
3.2.1.2 Normalized Young's Modulus
The relation between the normalized Young's moduli and apparent volume fractions of particles are shown in Figure 14. The normalized moduli until the percolation threshold were found to be dependent on only apparent volume fraction regardless of the crosslinking density of the rubber matrix and to agree with the coefficient (φ′) of Equation (2) with the apparent volume fraction instead of the actual volume fraction. As the apparent volume fraction of the particles approached the percolation threshold indicated by the broken line in Figure 14, however the Young's modulus began to deviate significantly from the result of the mixture law.
3.2.1.3 Normalized Proportional Limit Strain
The relation between the normalized proportional limit strains and the apparent volume fractions of the particles are shown in Figure 15. The normalized proportional limit strains decreased only depending on the apparent volume fractions of particles regardless of the crosslinking density of the matrix rubber and the particle size. Additionally, the proportional limit strains were less sensitive to the particle percolation than the results of the normalized Young's moduli (Figure 14).
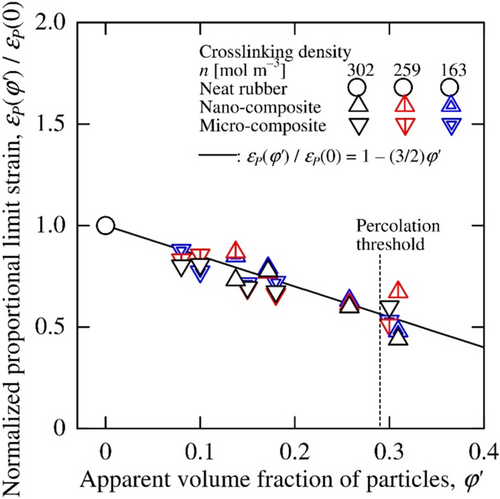
Thus, the coefficient of Equation (9) denotes the normalized proportional limit strain. The calculated coefficient is shown as the solid line in Figure 15. The measured results agree with the coefficient of Equation (9), so the normalized proportional limit strain was found to depend only on the apparent volume fraction of the particles.
3.2.1.4 Normalized Fracture Strain
The relation between the normalized fracture strains and the apparent volume fractions are shown in Figure 16. Despite the large variation in the measured results, the normalized fracture strains decreased only depending on the apparent volume fraction of the particles regardless of the crosslinking density of the matrix rubber and the particle size. The normalized fracture strain was also found to be insensitive to the particle percolation.
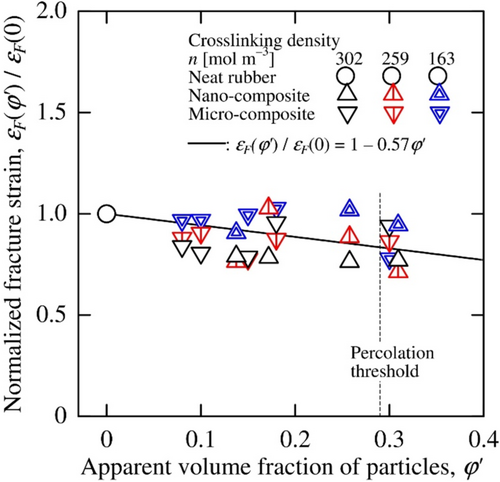
The normalized fracture strain of the composites was found to be less dependent on the apparent volume fractions of the particles than the proportional limit strains expressed as Equation (9) in Figure 15. The normalized fracture strain was also found to be insensitive to the particle percolation, similar to the normalized proportional limit strain. However, the coefficient of φ′ in Equation (10), 0.57, is smaller than that in Equation (9), 1.5, that is, the fracture strain was less sensitive to the apparent volume fraction of the particles than the proportional limit strain.
These results from Sections 3.2.1.2–3.2.1.4 led to the conclusion that the mechanical properties (stiffness: Young's modulus, and strength: fracture strain obtained from the stress–strain curves) can be derived from a simple mixture model of the apparent particles and matrix rubber, or the particles and matrix rubber. This conclusion indicates that there is little interference between the rubbery matrix and the particles or apparent particles in the research. However, the interference between the apparent particles and the matrix largely influences mechanical properties other than the elastic modulus in composites with the glassy matrix [36, 37].
3.2.1.5 Normalized Fracture Toughness
The normalized fracture toughness is shown in Figure 17. These results are different from those for the other normalized properties and clearly dependent on both the apparent volume fraction of particles and the crosslinking density of the matrix rubber. Due to the large scatter in the measured results, the results in Figure 17 for each specimen condition could not be fitted by an empirical equation.
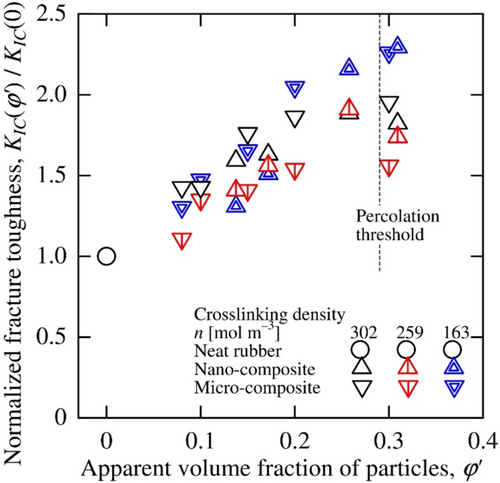
For the composites with the crosslinking densities of 302 and 259 mol m−3, there is no clear difference in the measured fracture toughness of the nano-composite ordered by the apparent volume fractions of the particles and that of the micro-composite without interphase layers. The fracture toughness of the composite with the crosslinking density of 302 mol m−3 increases monotonically up to an apparent volume fraction of 0.20, and thereafter approaches a constant normalized value of approximate 1.9. These results, together with the fact that crack propagated on the particle surfaces in the micro-composite (Figure 13a) and on the interphase layer surfaces in the nano-composite (Figure 13b,c), indicate that there was little chemical and mechanical bonding between the interphase layer surface and matrix rubber, as between the micro-particles and the matrix rubber in the micro-composite. Thus, the nano-particle with the interphase layer was revealed to simply behave as an apparent particle in the rubber matrix, similar to the micro-particle.
In contrast of the above results, the normalized fracture toughness of both nano- and micro-composites with a crosslink density of 163 mol m−3, continued to increase monotonically until the apparent volume fractions of 0.30, reaching 2.3 times that of the matrix rubber. This monotonic increase, which differed from the results for the composites with the crosslinking densities of 302 and 259 mol m−3, was considered to be the result of the interaction between the apparent particles or micro-particles and the microstructure of the matrix rubber.
The results obtained so far can be summarized as follows. The interphase layer made of matrix rubber in the glassy state was formed around the particle, and the nano-particle behaved as an apparent single particle together with the interphase layer in the rubber composite. The interphase layers were revealed to apparently increase the volume fraction of the particles, which affected the mechanical properties of the particle-filled composite. The mechanical properties of the matrix rubber were greatly affected by the crosslinking density of the rubber. As the crosslinking density increased, the Young's modulus and fracture toughness increased, and the proportional limit strain and fracture strain decreased. For both nano- and micro-composites, as the (apparent) volume fraction of the particles increased, the Young's modulus was greater than that of the matrix rubber, but the proportional limit and fracture strains were smaller. The proportional limit strain was highly sensitive to the (apparent) volume fraction of the particles, although the fracture strain was not. The fracture toughness of the composites increased with the (apparent) volume fraction of the particles, but the increase in the fracture toughness was limited as the crosslinking density increased. However, the fracture toughness monotonically increased for the composites with low crosslinking density of the matrix rubber due to the interaction between the (apparent) particles and microstructure of the matrix rubber. As a supplement, the density of silica particles is 2.2 × 10³ kg m−3 and that of silicone rubber is 1.0 × 10³ kg m−3, so filling the nano-particles naturally reduced the weight of the composite by forming the interphase layers around the particles.
3.2.2 Relations of Mechanical Properties
The relations between each mechanical property are discussed to consider the possibility of material design for the silica particles-filled silicone-rubber composites.
Figure 18 shows the relation between fracture strains and Young's moduli for the composites. By selecting the matrix rubber with different crosslinking density and the (apparent) volume fraction of the particles, the Young's modulus can be varied up to five times, although the fracture strain only decreased from 0.6 to 0.4. Thus, the Young's modulus of the composites can be changed greatly without the fracture strain significantly decreasing.
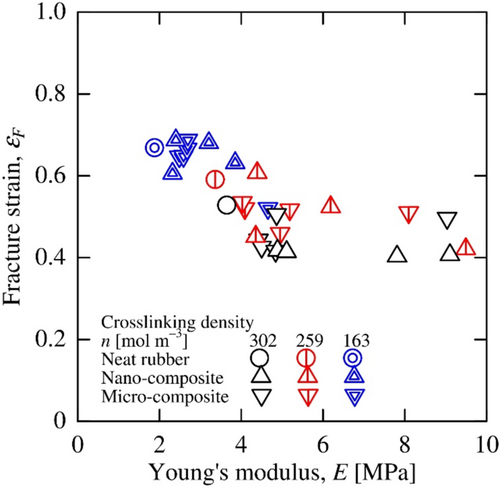
Figure 19 shows the relation between the fracture toughnesses and Young's moduli of the composites. The fracture toughness increases up to three times as the Young's modulus increases from 2 to 10 MPa. At higher Young's modulus, the fracture toughness is saturated even as the Young's modulus continues to increase.
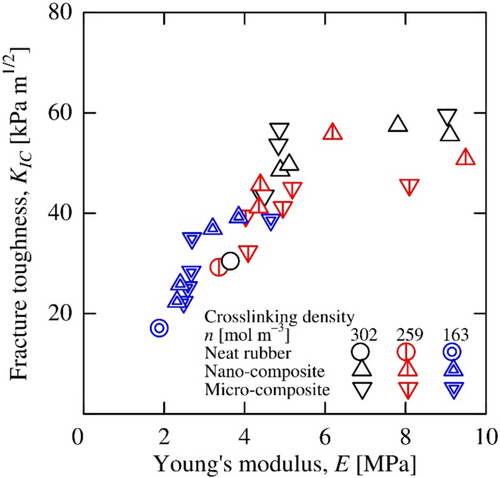
Figure 20 shows the relation between the fracture toughnesses and the fracture strains of the composites. Although the relation is observed to have a negative correlation similar to those of general materials, the fracture strains had a smaller range than the fracture toughness.

Therefore, the relations of mechanical properties can be designed by using the matrix rubber with the different crosslinking density in the composite as well as by using the (apparent) volume fraction of the particles.
4 Conclusion
In this paper, the mechanical properties of silicone-rubber composites filled with nano- or micro-silica-particles (such as Young's modulus, proportional limit strain, fracture strain, and fracture toughness) were discussed on the basis of the experimental results of the composites.
The interphase layer made of matrix rubber in the glassy state was formed around the nano-particle, and the nano-particle behaved as an apparent single particle together with the interphase layer in the rubber composite. The interphase layers were revealed to apparently increase the volume fraction of the particles, which affected the mechanical properties of the particle-filled composite.
The mechanical properties of the matrix rubber were greatly affected by the crosslinking density of the rubber. As the crosslinking density increased, the Young's modulus and fracture toughness increased, and the proportional limit strain and fracture strain decreased.
For both nano- and micro-composites, as the (apparent) volume fraction of the particles increased, the Young's modulus was greater than that of the matrix rubber, but the proportional limit and fracture strains were smaller. The Young's moduli and the proportional limit strains for both the composites can analyzed by using Lewis and Nielsen's mixture law (Equation (2)) with the (apparent) volume fractions and the equation that the authors suggested (Equation (5)). The fracture strains for both the composites were expressed empirically as Equation (10) with the fracture strain of the matrix rubber and the (apparent) volume fraction of the particles.
The proportional limit strain was highly sensitive to the (apparent) volume fraction of the particles, although the fracture strain was not. The fracture toughness of the composites increased as the (apparent) volume fraction of the particles increased, but it increased little at the (apparent) volume fraction above 0.2. However, the fracture toughness monotonically increased for the nano-composites with low crosslinking density of the matrix rubber due to the interaction between the apparent particles and microstructure of the matrix rubber.
The relations of mechanical properties can be designed by using the matrix rubber with the different crosslinking density in the composite as well as by using the (apparent) volume fraction of the particles.
Author Contributions
Tadaharu Adachi: conceptualization (lead), funding acquisition (lead), investigation (lead), methodology (lead), project administration (lead), resources (lead), supervision (lead), validation (lead), visualization (supporting), writing – original draft (lead), writing – review and editing (lead). Kaori Kobayashi: data curation (lead), formal analysis (equal), investigation (equal), software (lead), validation (equal), visualization (lead), writing – original draft (equal). Ayaka Noda: data curation (lead), formal analysis (lead), investigation (equal), software (equal), validation (equal). Kensuke Ishikawa: data curation (equal), formal analysis (equal), investigation (equal), software (equal), validation (supporting).
Acknowledgments
This research was supported by the Japan Society for the Promotion of Science (JSPS), KAKENHI, Grant Numbers JP17K06053 and JP20K04159. The specimen surfaces were observed using a low-vacuum scanning electron microscope (SU3500, Hitachi) in the Cooperative Research Facility Center at Toyohashi University of Technology.
Conflicts of Interest
The authors declare no conflicts of interest.
Open Research
Data Availability Statement
The data that support the findings of this study are available from the corresponding author upon reasonable request.


