Evaluation of the activity of natural phenolic antioxidants, extracted from industrial coffee residues, on the stability of poly(1,4-butylene succinate) formulations
Abstract
In this work, the evaluation of the antioxidant activity of natural phenolic compounds is performed and compared to that of a conventional antioxidative agent. Phenolic molecules, extracted from industrial processing coffee residues, are added to a matrix of poly(1,4-butylene succinate) (PBS). The apparent activation energy (Ea) of the thermo-oxidative degradation is calculated by employing different methods like Kissinger-Akahira-Sunose, Flynn-Wall-Ozawa and Friedman. The results are compared with the antioxidant activity evaluation obtained through the ABTS radical scavenging assay. From the average activation energies, it is observed that the addition of the natural antioxidants led to an increase in the activation energy of the degradation process as a function of the phenolic compound content. This trend is confirmed by the results of the ABTS assay. Hence, this study proves that the active molecules extracted from agri-food waste could be employed to improve the antioxidant capacity of the biopolymer, even if the composition of the extract must be evaluated in order to mitigate the effects of other components.
1 INTRODUCTION
Nowadays the management of plastics is a global hot topic. In particular, the end-of-life of plastic materials is an increasingly pressing issue due to the environmental impact of the plastic rubbish.
Various ways of plastic recycling are being explored, but, unfortunately, the intrinsic properties of polymers and the large array of polymeric materials with different physical and chemical characteristics complicate the process and only a limited portion of plastic waste is recycled.1, 2 According to the EPA report, in 2018, 36 million tons of plastic waste were generated and only 3 million tons are actually recycled.1 This certainly leads to an increased interest in biodegradable polymers that, for this property, can be a valid alternative to replace conventional and non-biodegradable materials in different applications, for example in the packaging field.
In this context, a specific attention must be spent on the additives used in polymer formulation: they have to be non-toxic and biodegradable too. Therefore, it could be a good strategy to test natural molecules as eco-friendly additives for biopolymers.
In particular, in polymer formulation, the presence of antioxidants is essential to retard the oxidation process and to allow the material to better preserve for longer times. In the green chemistry perspective, antioxidants from renewable sources and, better, from agro-industrial residues are increasingly studied.3-5
The exploitation of phenolic compounds, that are known to have antioxidant characteristics,6-10 extracted from industrial processing coffee residues, is exactly one of the purposes of the H2020 PROLIFIC project which funded the research described in this paper.
PBS is a polymer both bio-derived and biodegradable, therefore owning all the sustainability characteristics; in addition, it exhibits high flexibility and impact strength. A further benefit of PBS matrix consists in its relatively low melting temperature that can prevent the degradation of polyphenols during the melting processing. Moreover, PBS has good chemical resistance and controllable rate of biodegradation. For these reasons, PBS is considered an interesting high-performance environment-friendly biodegradable plastic.11 According to literature, oxidative degradation of PBS proceeds through the radical-radical coupling of an oxygen molecule on a carbon atom centered free radical, leading the formation of peroxyl radicals. Primary radicals, that are initiators of the degradative mechanism, can be produced on the polymer backbone in presence of oxygen.12, 13 Free-Radical Scavengers (like sterically hindered phenols) can react with the chain-propagating radicals interrupting this degradation process. Phenolic compounds are able to scavenge reactive oxygen species.5, 12, 14-16 Thus, phenolic molecules extracted from coffee beans may provide an antioxidant activity toward the PBS matrix.
The aim of this work is to evaluate the effective antioxidant activity of the natural phenolic compounds, extracted from coffee residues and dispersed in a PBS matrix in different small amounts by melt mixing. A kinetic approach has been used, by calculating the apparent activation energy (Ea) of the thermo-oxidative degradation. The results were compared with those obtained through the ABTS radical scavenging assay. In addition, a comparison with the activity of a conventional antioxidative agent was carried out.
2 EXPERIMENTAL
2.1 Materials
Poly(1,4-butylene succinate) (PBS) material was the BioPBS FZ91PM provided by PTTMCC Biochem (Thailand), produced from polymerization of bio-based succinic acid and 1,4-butanediol and characterized by Mw of 170 kDa and melt flow index (190°C, 2.16 kg) of 22 g 10 min−1.
A sample extracted from milled coffee green beans (CGB) by a subcritical water extraction (SWE), carried out by following a procedure reported in literature,17 was used as additive (labeled exCGB). The chemical composition, determined by HPLC-DAD as previously described and expressed as mg g−1,18 was: 40.0 mg of chlorogenic acid, 58.7 mg of neochlorogenic acid, 57.1 mg of cryptochlorogenic acid and 27.2 mg of caffeine. The corresponding total amount of phenolic compounds in the exCGB extracted was 16 wt%. The antioxidant activity of the extract, measured by the ABTS method (see section 2.3.5), is 75 ± 7 μgAA mg−1 of the sample.
Irganox 1010, 2,2-azino-bis (3-ethylbenzothiazoline-6-sulfonic acid) (ABTS) (≥ 98% HPLC grade), chloroform (HPLC grade) and water (HPLC grade) have been purchased by Merck.
2.2 Sample preparation
Composites containing PBS and exCGB or Irganox 1010 were prepared using a Haake Minilab II micro-compounder (Thermo-Scientific Haake GmbH). The micro twin-screw extruder was used to mechanically mix the materials at 140°C for 1 min to favor a good dispersion of additives within the matrix. PBS and exCGB were dried overnight at 60 and 80°C, respectively, before processing.
The melted materials were transferred from the mini extruder with a preheated cylinder into a MegaTech Tecnica DueBi injection molding machine. Tensile specimens Haake type 3 dog-bone bar were prepared. The size of dog bond specimens was: width 10 mm, width in the narrow section 4.8 mm, thickness 1.35 mm, length 90 mm.
Increasing amount of exCGB powder was introduced reaching a maximum of 5%. The PBS sample containing Irganox 1010 was prepared with 1% of additive. In addition, a control sample (pure PBS) without the addition of any amount of antioxidant was also prepared. The composition and the name of the prepared samples are reported in Table 1.
| Name | Additive | Additive amount [wt%] | Phenolic antioxidants [wt%] |
|---|---|---|---|
| PBS | - | - | - |
| PBS-exCGB1 | Extracted CGB | 1 | 0.2 |
| PBS-exCGB3 | Extracted CGB | 3 | 0.5 |
| PBS-exCGB5 | Extracted CGB | 5 | 0.8 |
| PBS-Irg1 | Irganox 1010 | 1 | - |
2.3 Characterization
2.3.1 Gel permeation chromatography
Gel permeation chromatography (GPC) measurements were performed at 30°C on a GPC Hewlett Packard Series 1100 using a PL gel 5 μm Minimixed-C column with chloroform (CHCl3) as eluent with a 0.3 mL min−1 flow; the Refractive Index detector was used and a calibration plot was constructed with monodisperse polystyrene standards. The samples were dissolved in CHCl3 and filtered on Teflon syringe filter with a pore size of 0.45 μm to eliminate the insoluble residue. The UV detector at 254 nm was used to measure the amount of Irganox 1010.
2.3.2 Determination of the composition of the PBS-based samples
The quantity of exCGB present in the composites was verified by exploiting the different solubility of exCGB and PBS in chloroform. 1 g of PBS-exCGB sample was dissolved in 100 mL of chloroform at room temperature for 3 h under magnetic stirring. The murky suspension, due to the presence of insoluble exCGB, was filtered under vacuum. The insoluble fraction was recovered and weighed.
In the case of the PBS-Irg1 sample, Irganox 1010 was quantified by GPC analysis in chloroform, using the peak recorded by UV detector at 254 nm and a calibration curve. A similar method has been reported in the literature.12
2.3.3 Differential scanning calorimetry
Calorimetric analysis was carried out by means of a Perkin Elmer DSC6 calorimeter, calibrated with high-purity standards. The measurements were performed under nitrogen. Melting temperature (Tm) and enthalpy (ΔHm) were collected during the first scan from 25 to 150°C at 20°C min−1.
2.3.4 Thermogravimetric analysis
The thermogravimetric analysis (TGA) was performed using a Perkin Elmer TGA4000 apparatus in nitrogen (gas flow: 40 mL min−1) or in air (gas flow: 50 mL min−1) at 10°C min−1 heating rate, from 30 to 600°C. The degradation temperature (TD) was calculated as the temperature of the maximum degradation rate, whereas the onset degradation temperature (Tonset) was defined as the initial temperature of degradation, corresponding to the intercept of the tangent drawn at the inflection point of the decomposition step with the horizontal zero-line of the thermal gravimetric curve. In addition, T5% has been determined as the temperature at which 5% weight loss was reached.
For kinetic studies, samples of 5.0 ± 0.5 mg were heated from ambient temperature to 600°C under air atmosphere (50 mL min−1). Heating rates of 2, 5, 7 and 10°C min−1 were used and continuous records of the sample weight as a function of the temperature and the first derivative were taken.
2.3.5 ABTS radical scavenging assay
Antioxidant activity of exCGB extract was measured using the ABTS method by incubating an aliquot of exCGB suspension with 1 mL of ABTS solution for 30 min at 30°C.19 Dog-bone bar were cut in 200 ± 35 mm2 parts for antioxidant property assessment. Each piece was incubated in 1 mL of ABTS solution (2,2-azino-bis(3-ethylbenzothiazoline-6-sulfonic acid)) at 30°C in a shaking thermostatic bath. The absorbance was measured at 734 nm and the results were expressed as micrograms of ascorbic acid (AA) equivalents per surface unit (μg AA eq cm−2) by means of a dose–response calibration curve (between 0 and 2 μg of AA).19, 20
2.4 Kinetic analytical methods
Activation energy (Ea) was evaluated with different iso-conversional (model-free) methods. In particular, Kissinger-Akahira-Sunose (KAS), Flynn-Wall-Ozawa (FWO) and Friedman's method were used, as reported in several papers.21-25 The mathematical treatment of each iso-conversional methods will not be discussed in depth since it is not the focus of this article and has been extensively covered in the scientific literature.21, 22
By plotting the left side of the equation against 1/T at different heating rates, the value of the (−Ea/R) for a given value of α can be directly obtained.
The main parameters of the methods used are summarized in Table 2.
3 RESULTS AND DISCUSSION
3.1 Description of the samples
Four samples of PBS with increasing content of antioxidants extracted from coffee green beans were prepared by melt mixing at 140°C and analyzed: pure PBS, PBS + 1 wt%, PBS + 3 wt% and PBS + 5 wt% of phenolic compounds, as summarized in Table 1 and described in the scheme reported in Figure 1. As reported in the Experimental part (section 2.1), the total amount of antioxidant components presents in the exCGB sample is 160 mg per gram, corresponding to the 16 wt%, while the remaining fraction is mainly composed of proteins, peptides and sugars. This means that the effective amounts of antioxidants in the composites are equal to 0.2, 0.5 and 0.8 wt%, respectively, as reported in Table 1.
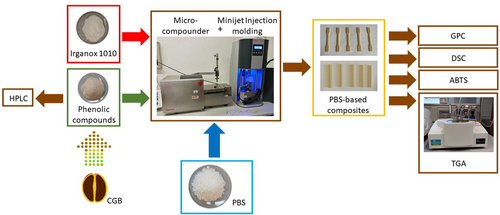
During the extrusion, the melt is homogeneous and uniformly colored with a yellow-brown tone (due to the brown color of the extract) whose intensity increases with increasing the amount of exCGB. In the final specimens, the exCGB appears well dispersed within the polymeric matrix (as confirmed by SEM analysis not reported in this work) and, then, the interaction of exCGB with the PBS matrix seems good. From the tests performed to verify the composition after extrusion process, the inclusion of exCGB in the PBS matrix results almost quantitative (>90 wt% for all compositions).
To compare the stabilizing activity of exCGB with the one of a conventional antioxidative agent, a sample containing 1 wt% of Irganox 1010 was formulated. In this case the melt is white and homogeneous and the inclusion of Irganox 1010 in the PBS matrix is quantitative.
The molecular weight (Mw) of the PBS-based samples was determined by GPC analysis after a filtration procedure to remove the insoluble residue. In general, the PBS-exCGB samples and the PBS-Irg specimen maintain high-molecular weight values, close to the one of pristine PBS.
The results obtained by differential scanning calorimetry (DSC) analysis, reported in Table 3, show similar behavior both for PBS and PBS-based samples, indicating that the presence of additives does not influence the crystallization and the melting processes of the matrix. Indeed, the crystallization degree is similar for all the samples and, then, does not affect the thermo-oxidation analyses.
| TGA in nitrogen | TGA in air | DSC (first scan) | ||||||
|---|---|---|---|---|---|---|---|---|
| T5% [°C] | Tonset [°C] | TD [°C] | T5% [°C] | Tonset [°C] | TD [°C] | Tm [°C] | ΔHm [J g−1] | |
| PBS | 360 | 376 | 403 | 336 | 360 | 393 | 118 | 68 |
| PBS-exCGB1 | 353 | 375 | 401 | 340 | 367 | 398 | 116 | 68 |
| PBS-exCGB3 | 336 | 369 | 396 | 334 | 362 | 391 | 116 | 69 |
| PBS-exCGB5 | 330 | 362 | 394 | 324 | 358 | 388 | 117 | 74 |
| PBS-Irg1 | 359 | 378 | 407 | 344 | 370 | 399 | 115 | 68 |
- Abbreviations: DSC, differential scanning calorimetry; PBS, poly(1,4-butylene succinate); TGA, thermogravimetric analysis.
A preliminary thermogravimetric analysis is carried out in nitrogen and in air atmosphere at 10°C min−1. The results extrapolated from TG e dTG curves are reported in Table 3. Figure 2 shows the TG curves recorded for PBS-exCGB samples and for exCGB under nitrogen (a) and air (b) (dTG curves in air can be viewed in Figure S1). From the TG curve of exCGB, it is evident that the additive starts to lose weight at low temperatures (about 120°C) and that the first remarkable decomposition process takes place at around 260°C. Considering that the effective amount of antioxidant molecules present in the exCGB additive is about 16 wt% and that these active molecules degrade at temperatures above 300°C,30 this significant weight loss at about 260°C should be mainly due to the degradation of other components present in the exCGB extract, such as proteins and sugars.
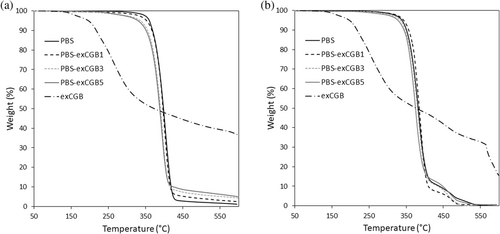
Concerning the behavior of PBS-exCGB samples in nitrogen (Table 3), it is possible to notice a continuous decrease in the T5%, Tonset and TD values with the increment of the additive content. As reported in literature, PBS degradation under inert atmosphere proceeds mainly by β-hydrogen-transfer bond scission, which is not affected by the presence of antioxidants.5, 12, 13, 24 Therefore, the decrease of the thermal stability of the samples in nitrogen atmosphere could be attributed to the low stability of some components of the exCGB extract itself. On the other hand, the thermal stability in nitrogen of the PBS-Irg1 sample is similar to the one of the PBS, in agreement with the literature.5, 12
Regarding the analyses performed under air flow, T5%, Tonset and TD for the PBS-exCGB1 sample are higher than those of the PBS reference. Moreover, these data are very similar to those obtained with the addition of Irganox 1010. Comparing these results with those reported in the literature,5 it can be asserted that the phenolic compounds used in this work have a stabilizing effect over the oxidative degradation. In addition, the values tend to return near the PBS ones increasing the amount of exCGB up to 3 wt% while they decrease with concentration of 5 wt%.
The different behavior of the samples observed in nitrogen and air atmospheres is highlighted by the graph shown in Figure 3, reporting the T5% data.
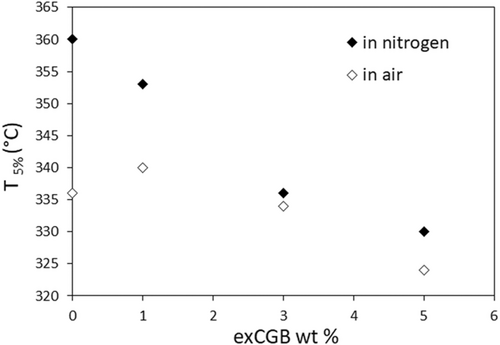
The gap of 25°C, between the T5% values of the PBS matrix recorded in nitrogen and in air, is not maintained in the samples containing exCGB. The reduction of this gap should indicate the stabilizing effect of phenolic compounds. Indeed, two contrasting effects have to be considered to explain the composites behavior due to the addition of exCGB: the effect of the phenolic molecules, which stabilize the material over the thermo-oxidative process, and the effect of the fraction of exCGB, which degrades at low temperature and whose degradation mechanism is not affected by the presence of the phenolic compounds. Therefore, to study more in depth the antioxidant effect of the quantities of phenolic compounds on the PBS matrix overcoming the not converged action, kinetic studies were performed and discussed in the following section.
3.2 Kinetic analysis
In order to study the influence of the characteristics and amounts of the antioxidant on the thermo-oxidative degradation reaction of the material, thermogravimetry and derivative thermogravimetry (TG/dTG) analysis under non-isothermal conditions at four heating rates (2, 5, 7 and 10°C min−1) were used (the corresponding TG curves and the extrapolated data are reported in Figure S2 and Table S1). For all the samples and at all the heating rates, the mass loss vs. temperature occurs in two steps as already observed in Figure 2b, obtained in non-isothermal conditions. The main weight loss process takes place at about 400°C whereas the second phenomenon is less important and occurs at around 480°C. The effect of the presence of the antioxidant molecules can be observed in the first degradation step: for this reason, the analysis has been carried out in this initial phase up to a weight loss of 60%. Moreover, to avoid degradation processes which are due to the different components, the conversion starting from 0.1 has been considered. Magnifications of the dTG profiles showing the exclusion of this effect are reported in Figure S3.
The KAS, FWO and Friedman's model-free methods have been employed to obtain the activation energy (Ea) of the thermo-oxidation degradation reaction. A conversion ranges from 0.1 to 0.6 was considered for the iso-conversional plots in order to calculate Ea.
As an example, the iso-conversional plots for the sample with 3 wt% of exCGB extract for the kinetic models employed in this work are shown in Figure 4.
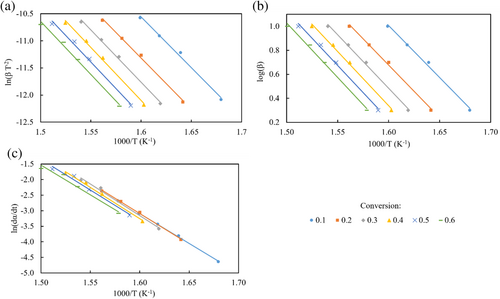
The Ea and the coefficient of determination (R2) obtained from the KAS, FWO and Friedman iso-conversional plots at different conversion values are shown in Tables 4, 5 and 6, respectively. It is worth mentioning that the correlation coefficient (R2) for all the samples and for each method were found to be greater than 0.97. These results demonstrate that the KAS, FWO and Friedman's methods could be highly reliable for calculating Ea for PBS samples.
| Conversion | PBS | PBS-exCGB1 | PBS-exCGB3 | PBS-exCGB5 | PBS-Irg1 | |||||
|---|---|---|---|---|---|---|---|---|---|---|
| Ea [J Kmol−1] | R2 | Ea [J Kmol−1] | R2 | Ea [J Kmol−1] | R2 | Ea [J Kmol−1] | R2 | Ea [J Kmol−1] | R2 | |
| 0.1 | 133 | 0.9778 | 141 | 0.9910 | 156 | 0.9932 | 172 | 0.9899 | 129 | 0.9942 |
| 0.2 | 140 | 0.9900 | 153 | 0.9882 | 157 | 0.9964 | 164 | 0.9948 | 142 | 0.9946 |
| 0.3 | 147 | 0.9910 | 160 | 0.9970 | 161 | 0.9966 | 164 | 0.9947 | 156 | 0.9966 |
| 0.4 | 152 | 0.9881 | 161 | 0.9985 | 163 | 0.9954 | 165 | 0.9947 | 163 | 0.9983 |
| 0.5 | 152 | 0.9876 | 161 | 0.9998 | 163 | 0.9941 | 167 | 0.9951 | 170 | 0.9973 |
| 0.6 | 153 | 0.9884 | 162 | 0.9994 | 163 | 0.9931 | 172 | 0.9933 | 176 | 0.9960 |
| Conversion | PBS | PBS-exCGB1 | PBS-exCGB3 | PBS-exCGB5 | PBS-Irg1 | |||||
|---|---|---|---|---|---|---|---|---|---|---|
| Ea [J Kmol−1] | R2 | Ea [J Kmol−1] | R2 | Ea [J Kmol−1] | R2 | Ea [J Kmol−1] | R2 | Ea [J Kmol−1] | R2 | |
| 0.1 | 136 | 0.9806 | 144 | 0.9898 | 158 | 0.9939 | 173 | 0.9910 | 133 | 0.9949 |
| 0.2 | 143 | 0.9913 | 156 | 0.9973 | 159 | 0.9941 | 165 | 0.9955 | 145 | 0.9953 |
| 0.3 | 150 | 0.9921 | 162 | 0.9986 | 163 | 0.9924 | 166 | 0.9954 | 159 | 0.9970 |
| 0.4 | 154 | 0.9895 | 163 | 0.9998 | 165 | 0.9939 | 167 | 0.9954 | 166 | 0.9985 |
| 0.5 | 155 | 0.9891 | 164 | 0.9998 | 165 | 0.9987 | 169 | 0.9957 | 172 | 0.9976 |
| 0.6 | 156 | 0.9898 | 167 | 0.9995 | 165 | 0.9979 | 172 | 0.9941 | 177 | 0.9964 |
| Conversion | PBS | PBS-exCGB1 | PBS-exCGB3 | PBS-exCGB5 | PBS-Irg1 | |||||
|---|---|---|---|---|---|---|---|---|---|---|
| Ea [J Kmol−1] | R2 | Ea [J Kmol−1] | R2 | Ea [J Kmol−1] | R2 | Ea [J Kmol−1] | R2 | Ea [J Kmol−1] | R2 | |
| 0.1 | 141 | 0.9869 | 152 | 0.9802 | 160 | 0.9981 | 165 | 0.9928 | 147 | 0.9897 |
| 0.2 | 154 | 0.9918 | 156 | 0.9997 | 163 | 0.9975 | 164 | 0.9984 | 175 | 0.9956 |
| 0.3 | 168 | 0.9813 | 162 | 0.9981 | 169 | 0.9898 | 176 | 0.9930 | 186 | 0.9970 |
| 0.4 | 159 | 0.9821 | 166 | 0.9977 | 167 | 0.9920 | 170 | 0.9923 | 188 | 0.9940 |
| 0.5 | 153 | 0.9882 | 167 | 0.9969 | 164 | 0.9816 | 178 | 0.9867 | 190 | 0.9917 |
| 0.6 | 158 | 0.9918 | 168 | 0.9934 | 164 | 0.9741 | 187 | 0.9739 | 194 | 0.9911 |
In agreement with the scientific literature, comparing the Ea values obtained through KAS and FWO methods, it can be observed that the FWO values are slightly higher and an excellent agreement between the Ea for both methods is notable, in agreement with publications on kinetic methods.31
The data reported in Tables 4, 5 and 6 can be discussed, firstly, by considering the comparison of the behavior of different samples at the same degree of the conversion.
A significant increment in Ea for each conversion values can be observed as the exCGB content increases. High Ea values can be observed also for the PBS sample containing Irganox, mainly at high conversions. This behavior suggests that the thermo-oxidation process of the polymeric matrix in oxygen is contrasted by the presence of exCGB additive, also in a small amount.
To compare the data of Ea as a function of the exCGB amount, the average values were calculated in 0.1–0.6 range of conversion and reported in Table 7. The values of kinetic parameters evaluated by the three methods are almost the same and in good agreement among them. All methods show that the virgin PBS sample presents the lowest Ea and a noticeable increase in Ea can be observed for all the samples.
| Methods | Average Ea PBS [J Kmol−1] | Average Ea PBS-exCGB1 [J Kmol−1] | Average Ea PBS-exCGB3 [J Kmol−1] | Average Ea PBS-exCGB5 [J Kmol−1] | Average Ea PBS-Irg1 [J Kmol−1] |
|---|---|---|---|---|---|
| Kissinger-Akahira-Sunose (KAS) | 146 | 156 | 160 | 167 | 156 |
| Flynn-Wall-Ozawa (FWO) | 149 | 159 | 162 | 169 | 159 |
| Friedman | 155 | 162 | 164 | 173 | 180 |
It is interesting to observe that the same Ea value has been calculated for both PBS-exCGB1 and PBS-Irg1 samples, using KAS and FWO methods. This means that the antioxidant activity of the additive investigated in this work is comparable to that observed with 1 wt% of Irganox 1010, a conventional antioxidant product. By considering that the real amount of phenolic compounds contained in this sample is about 0.1 wt%, this result indicates a very high antioxidant activity of the natural extracted molecules. This result is in agreement with the literature in which the protective effect of 0.1% caffeic and 0.1% chlorogenic acids is reported.10
By comparing the results obtained for the PBS-exCGB samples, it is possible to notice that the Ea data increase with the exCGB content up to the composition containing 5% of additive.
To explain this behavior, it is possible to consider that the phenolic compounds act as radical scavengers by the hydrogen atom donation from the phenolic hydroxyl group. Therefore, in the presence of phenolic molecules the thermal oxidative PBS degradation is inhibited and a different mechanism, probably similar to that occurring in inert atmosphere, characterized by a higher Ea, takes place.24 Accordingly, by observing the data reported in Table 7, it is possible to observe that the averaged Ea value is about 150 J Kmol−1 for PBS whereas it is about 170 J Kmol−1 for PBS-exCGB5. If the amount of radical scavengers is not enough high, the two mechanisms can occur simultaneously and the Ea data have intermediate values, as it occurs for PBS-exCGB1 and PBS-exCGB3 samples.
Similar results are reported in literature for agro-wastes rich in natural antioxidants.7 In particular it is also reported that the antioxidant activity reaches a maximum with increasing the antioxidant concentration. Iyer et al. found the best value between 4 and 12 wt% of natural compounds, depending on the agro-waste used. In our case, composites with higher concentrations of exCGB additive could be prepared to reach this maximum value but the presence of the less stable fraction in the exCGB extract must also be taken into account. Finally, it is noteworthy to underline that Ea data indicate also that the natural phenolic antioxidants investigated in this work remain active after the mixing with the polymeric matrix at 140°C: therefore, thanks to the relatively low processing temperature of PBS, the exploitation of exCGB in PBS formulation does not require specific strategies of natural additive protection, for example by encapsulation in inorganic lamellar structures.32
3.3 Antioxidant properties by ABTS radical scavenging assay
The 2,2-azino-bis(3-ethylbenzothiazoline-6-sulfonic acid) (ABTS) assay is one of the most widely used methods of antioxidant capacity measurement. The ABTS-based assay is experimentally and instrumentally easy to apply, give fast and reproducible data and is rather cheap.33
The approach of the ABTS assay is based on an electron transfer and involves reduction of a colored oxidant. In specification, the ABTS assay is based on the generation of a blue/green that can be reduced by antioxidants present in the reaction mixture. The amount of decolorization is related to the concentration of the added antioxidant.34 The basic chemistry of the ABTS-based assay is the interaction between an antioxidant and the pre-generated ABTS•+ radical cation. ABTS•+ scavenging can be easily quantitatively detected due to the bleaching of absorption spectrum characteristic maxima at 414, 417, 645, 734, and 815 nm.33 According to the literature the higher wavelength range is recommended to avoid possible interference.35 Some reviews have pointed out the issues related to the ABTS-based assay, nevertheless the ABTS assay proves to be very useful for tracking changes within the same antioxidant system and for composition effect evaluation.33 These factors together with the simplicity, rapidity, low cost and good reproducibility, have led to the widespread use of this approach for the evaluation of antioxidant activity.36, 37
In order to verify the results obtained with TG analysis, antioxidant properties were evaluated by the widely used ABTS radical scavenging assay.36, 37 The analyses have been carried out on the extract, the virgin PBS and the PBS samples mixed with 1%, 3% and 5% of exCGB. It is interesting to notice that the extract is very active (75 ± 7 μgAA mg−1 of the sample).
Figure 5 shows the obtained results in the first round of assay. The addition of additives increases the basal PBS antioxidant activity of 2.3, 4.9 and 5.3-times for 1%, 3% and 5% respectively. Pure PBS had an almost constant radical scavenging activity (on average 0.22 μgAA cm−2), which was reached by all composite formulation in the second (0.20–0.42 μgAA cm−2) and third (0.18–0.25 μgAA cm−2) rounds of analyses. It seems to suggest that all the antioxidant molecules exposed on the specimen surface react the first time as they are put in contact with the radical reagent.
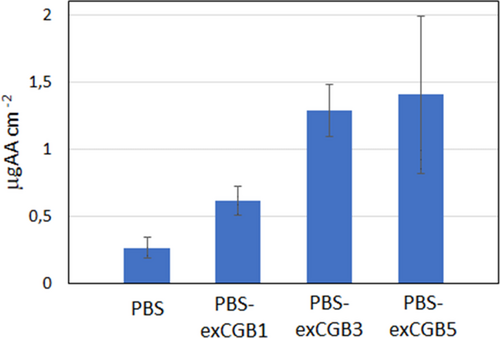
For the PBS-exCGB5, the error is high probably due to the presence of a large amount of not phenolic molecules that could contrast the efficiency of the antioxidant molecules.
Therefore, the ABTS assay confirms the results obtained through kinetic analysis up to 3 wt% in CGB extract.
4 CONCLUSIONS
In this study the antioxidant activity of natural phenolic compounds, extracted from coffee bean by-products, against the thermo-oxidative degradation of the PBS matrix was evaluated by TG analysis, employing model free iso-conversional mathematical methods. The results were compared with the antioxidant activity evaluation done by ABTS assay. Moreover, a comparison with the activity of a traditional antioxidant (Irganox) has been also carried out.
The thermogravimetric evaluation of the behavior of the PBS matrix by kinetic analyses shows that the activation energy of the degradation process increases with the increment of the amount of the phenolic molecules, indicating an antioxidant activity of the natural extract. This result is confirmed by the ABTS method. Moreover, the natural phenolic molecules appear to be very active, with an efficiency similar to the one of Irganox compound.
This result is significant because it highlights that the low PBS processing temperature (140°C) maintains the properties of the phenolic compounds avoiding degradation phenomena. Similar investigations are necessary for formulations based on polymeric matrixes with higher melting temperature.
As a conclusion, the present study demonstrates that natural molecules extracted from agri-food waste can be valorized as antioxidants for biopolymers, thus facilitating their application in the packaging field. However, it is noteworthy to underline that the extract contains only a percentage of phenolic molecules: it is characterized also by the presence of other compounds, such as peptides, proteins and sugars, that tend to degrade at low temperatures. Therefore, the use of natural extracts must be always carefully evaluated in order to mitigate this negative effect.
AUTHOR CONTRIBUTIONS
Paola Marchese: Conceptualization (equal); data curation (equal); supervision (equal); validation (equal); writing – original draft (equal); writing – review and editing (equal). Stefano Bianchi: Data curation (equal); formal analysis (lead); investigation (equal); writing – original draft (equal); writing – review and editing (equal). Micaela Vannini: Supervision (equal); writing – review and editing (equal). Laura Sisti: Supervision (equal); writing – review and editing (equal). Annalisa Tassoni: Data curation (supporting); formal analysis (supporting); writing – original draft (supporting). Maura Ferri: Data curation (supporting); formal analysis (supporting); writing – original draft (supporting); writing – review and editing (supporting). Norma Mallegni: Formal analysis (supporting). Patrizia Cinelli: Formal analysis (supporting). Annamaria Celli: Conceptualization (lead); data curation (equal); funding acquisition (lead); supervision (equal); writing – review and editing (equal).
ACKNOWLEDGMENTS
The authors would like to acknowledge Luciano Navarini (illycaffè spa – Trieste – Italy) for providing coffee green beans (CGB) and Job Tchoumtchoua and Stéphane Kohnen (Biomass Valorisation Platform – Extraction Department, CELABOR) for producing the extract from CGB. Open Access Funding provided by Universita degli Studi di Bologna within the CRUI-CARE Agreement.
FUNDING INFORMATION
This research was carried out in the framework of the PROLIFIC project, which is supported by the Bio Based Industries Joint Undertaking under the European Union's Horizon 2020 research and innovation program (grant agreement No. 790157).
Open Research
DATA AVAILABILITY STATEMENT
The data that support the findings of this study are available from the corresponding author upon reasonable request.


