Real-time Imaging of Nascent DNA in Live Cells by Monitoring the Fluorescence Lifetime of DNA-Incorporated Thiazole Orange-Modified Nucleotides
Graphical Abstract
A 2′-deoxycytidine triphosphate (dCTP) nucleotide modified with a thiazole orange moiety shows different fluorescence lifetimes in living cells depending on whether it is present as a free triphosphate or as a DNA-incorporated nucleotide. Due to this unique property, DNA synthesis in live cells can be monitored in real time using fluorescence lifetime imaging microscopy.
Abstract
A modified 2′-deoxycytidine triphosphate derivative (dCTOTP) bearing a thiazole orange moiety tethered via an oligoethylene glycol linker was designed and synthesized. The nucleotide was incorporated into DNA by DNA polymerases in vitro as well as in live cells. Upon incorporation of dCTOTP into DNA, the thiazole orange moiety exhibited a fluorescence lifetime that differed significantly from the non-incorporated (i.e. free and non-covalently intercalated) forms of dCTOTP. When dCTOTP was delivered into live U-2 OS cells using a synthetic nucleoside triphosphate transporter, it allowed us to distinguish and monitor cells that were actively synthesizing DNA in real time, from the very first moments after the treatment. We anticipate that this probe could be used to study chromatin organization and dynamics.
The imaging of dynamic changes in biological samples at subcellular resolution and in real time using fluorescent labels has developed rapidly over the past two decades and has now become an indispensable tool1, 2 in cell biology1 and medicine.3 The investigation of the organization, function, and dynamics of genomic DNA in chromatin is a challenging topic that has been addressed by various branches of fluorescence microscopy.4 Conventional DNA labeling methods employ metabolically active non-natural nucleoside analogs (BrdU,5 EdU,6 VdU7); however, these are “invisible” to common imaging techniques and therefore require subsequent secondary labeling with fluorescent tags once the incorporation is completed, which precludes real-time observation. The use of metabolically active fluorescent nucleoside triphosphates (dNFlTPs) delivered to the cells by means of a transient mechanical disruption of the cell membrane8 or—more recently—by the synthetic nucleoside triphosphate transporter SNTT1,9 enabled direct visualization of newly-replicated DNA in living cells. Yet, none of these methods have allowed for truly real-time monitoring of the nascent DNA because the background signal of a non-incorporated dNFlTP, which is abundantly present in the intracellular space after the delivery until it is reduced by efflux or cell fixation and washout, is indistinguishable from that of the DNA-incorporated nucleotide (dNFl). We have hypothesized that the detection of a signal originating exclusively from the incorporated dNFl in the presence of an excess of unincorporated dNFlTP can be achieved by fluorescence lifetime imaging microscopy (FLIM) under the assumption that the fluorophore changes its lifetime upon incorporation into DNA. In this way, the fluorescence signal of the free dNFlTPs could be differentiated from that of the DNA-incorporated dNFl even in the very first moments after dNFlTP delivery. Previously, we have reported BODIPY-based viscosity-sensitive fluorophores10 that changed lifetime when a labelled DNA interacted with proteins. We have also developed a nucleotide labelled with benzylidene-tetrahydroxanthylium which showed11 significant light-up upon incorporation to DNA. However, none of them was suitable for fluorescence lifetime imaging of DNA synthesis in live cells because of limited substrate activity and/or toxicity of the modified dNFlTPs. In our search for a suitable fluorophore, we chose thiazole orange (TO) because it belongs to a class of DNA-binding agents that significantly increase their quantum yield (proportional to the fluorescence lifetime) upon binding to DNA through intercalation.12 TO has repeatedly been used as a nucleobase surrogate13 as well as an external label14 in hybridization probes, but it has not been investigated as a marker for nascent DNA.
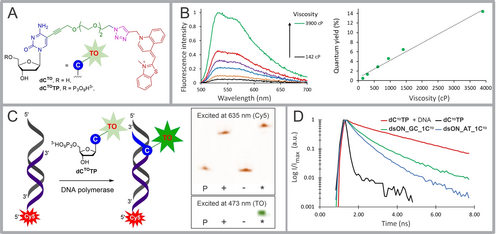
Thus, we have designed a conjugate dCTOTP (Figure 1A) in which the TO moiety was appended to 2′-deoxycytidine triphosphate (dCTP) via PEG3 linker which previously proved to be superior for attachment of other functional groups to dNTPs that preserved high substrate activity with polymerases.9d The desired model nucleoside dCTO and tri-phosphorylated nucleotide dCTOTP were obtained through copper-catalyzed alkyne-azide 1,3-dipolar cycloaddition (CuAAC) reaction of the corresponding azido-linked intermediates dCpegN3 or dCpegN3TP with the corresponding thiazole orange alkyne (Scheme S1 in Supporting Information).

(A) Structures of thiazole orange-modified nucleoside dCTO and its corresponding metabolically active triphosphate dCTOTP. (B) Photophysical properties of dCTO: fluorescence spectra of dCTO in glycerol at different viscosity (temperature range 10–50 °C; left graph); fluorescence quantum yield of dCTO in glycerol plotted against the viscosity (temperature range 10–50 °C; right graph). (C) In vitro incorporation of dCTOTP into dsDNA. Scheme of the PEX reaction with modified dCTOTP and PAGE analysis of the PEX using Temp1PEX, dCTOTP and KOD XL DNA polymerase. Primer (P), positive control (+; PEX with natural dNTPs), negative control (−-; PEX in absence of dCTP), and the dCTOTP incorporation (*; PEX with dCTOTP). (D) Fluorescence lifetime decay curves: dCTOTP in PBS (black line); dsON_AT_1CTO (blue line); dsON_GC_1CTO (green line); mixture of dCTOTP and DNA in PBS (red line; DNA was isolated from U-2 OS cells).
Measurement of the absorption and fluorescence emission spectra (Figure S1 and Table S1) of the model nucleoside dCTO in various solvents revealed only a mild solvatochromic effect. The nucleoside was essentially nonfluorescent in low-viscosity solvents such as H2O, MeOH, and dioxane, but fluorescence was detected in more viscous glycerol with a quantum yield of 4.6 % at 25 °C. The sensitivity of dCTO to viscosity was demonstrated by measuring the quantum yield (QY) of the solution of dCTO in glycerol at different temperatures (Figure 1B and Table S2).
Incorporation of dCTOTP into DNA was tested by primer extension (PEX) using KOD XL DNA polymerase along with the 19-mer template encoding for incorporation of a single modification (Figure 1C; Table S4).
The formation of the extended product was analyzed by PAGE and confirmed by MALDI. Fluorescence of dCTO-modified DNA was visible to the naked eye even on polyacrylamide gel (Figure 1C).
Real-time PCR study (Figure S6) using 98-mer template and involving different proportions of modified nucleotide dCTOTP and natural nucleotide dCTP revealed that the PCR amplicon was formed when a maximum 10 % of dCTOTP was used in combination with 90 % of natural dCTP; a higher proportion of dCTOTP inhibited the PCR and resulted in the formation of shorter products. The light-up effect was also detected in the course of the amplification by the PCR. We also prepared two oligonucleotides with specific sequences next to the dCTO-modified site: the double stranded “AT-rich” DNA dsON_AT_1CTO (Table S5), in which three adjacent nucleotides next to dCTO-modified position in both downstream and upstream directions of the modified strand were dA, and a “GC-rich” analogue dsON_GC_2CTO (Table S5) with triplets of dG in both strand directions.
The fluorescence lifetime (FLT) of free dCTOTP measured in PBS solution at 514 nm was very short (τ<0.1 ns; black line in Figure 1D; Table 1) but increased significantly upon incorporation into dsDNA; “AT-rich” dsON_AT_1CTO, exhibited a shorter FLT (mean τ=0.71 ns, blue line) than its “GC-rich” analog dsON_GC_2CTO (mean τ=0.99 ns, green line). The addition of DNA isolated from U-2 OS cells to a solution of dCTOTP (1 μM) in PBS, i.e. formation of an intercalation complex of DNA and dCTOTP without an intramolecular covalent bonding, resulted in a significant increase in FLT (mean τ=2.42 ns, red line). All measured FLTs exhibited decays that allowed for satisfactory two-exponential fits (for τ1, τ2, τmean and χ2 estimates see Table S6). Collectively, these experiments showed that dCTO nucleotide incorporated in a short dsDNA produced fluorescence emission with a FLT that is significantly different (shorter by 1.4–1.7 ns) from that observed for the non-covalent interaction of dCTOTP with isolated dsDNA.
Entry |
Compound(s) |
Conditions |
τ [ns][a] |
|---|---|---|---|
1 |
dCTOTP |
PBS |
<0.1 |
2 |
dCTOTP/DNA |
PBS |
2.417±0.100 |
3 |
dCTOTP/DNA |
in cellulo[b] |
3.115±0.043 |
4 |
dsON_GC_1CTO |
PBS |
0.987±0.018 |
5 |
dsON_GC_1CTO |
in cellulo[b,c] |
1.456±0.073 |
6 |
dsON_AT_1CTO |
PBS |
0.711±0.017 |
7 |
dCTO DNA-incorp. |
in cellulo[b] |
1.487±0.035 |
- [a] Mean intensity-weighted values of FLTs are shown; a complete list of all τ1, τ2, τmean and χ2 estimates can be found in Tables S6 and S7 in the Supporting Information. [b] FLT determined in the nucleoplasm of live U2-OS cells. [c] dsON_GC_1CTO was transfected to U2-OS cells.
It has been suggested14, 15 that intercalation of TO between base pairs of nucleic acids restricts the torsional motion of the benzothiazole and quinoline moieties around the methine bond, ultimately leading to an increase in the fluorescence QY and FLT. We hypothesized that the TO moiety, which is covalently bound to the DNA backbone via a linker, may experience sub-optimal intercalation resulting in reduced TO immobilization in the pocket. Consequently, an increase in the intramolecular twisting, decreasing the QY and FLT as compared to the intercalation of free dCTOTP, may be expected.
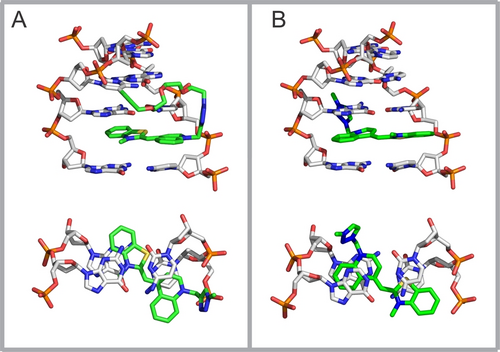
To gain insight into possible intramolecular intercalation binding modes, we performed a molecular modeling study (for details, see Supporting Information). We assumed that i) the degree of intercalation can be inferred from the calculated dispersion terms of the interaction energies arising from the interaction of TO moieties with the adjacent base pairs, and ii) the relative differences in these dispersion energies calculated for the ground states of the intercalation complexes will be similar in excited states. The study revealed that the TO moiety can intercalate into three consecutive pockets between the base pairs (referred to as the first, second, and third “floors”; Figure S11) adjacent to the modified cytosine. The TO moieties enter the pockets from the side of the major groove, where numerous non-covalent interactions between the PEG linker and DNA bases can occur. Binding of TO to the minor groove or intercalation from the side of the minor groove are not permitted, because the PEG linker protruding into the major groove is not long enough to encircle the DNA backbone. Finally, a comparison of the calculated dispersion term of the interaction energies of the three “covalent” binding modes with that of the free ligand (Table S8 and Figure S11 in Supporting Information) suggests that even the “best” intramolecular intercalation complex (Figure 2A; −63.0 kcal/mol) is stabilized by less dispersion energy by 15.7 kcal/mol than that containing linker-free ligand (Figure 2B; −78.7 kcal/mol). The modeling and calculations indicate that the covalent linkage of TO to cytosine in the DNA strand hampers the optimal intercalation mode, resulting in a lower FLT.

Geometry-optimized models of intercalation modes (side views, upper structures) in a fragment of dsON_GC_2CTO and trimmed structures used for the calculation of interaction dispersion energies (top-down views, lower structures). (A) Intramolecular intercalation into the “second floor” (−63.0 kcal/mol) versus (B) intercalation of free N-Me-triazole-TO conjugate (−78.7 kcal/mol). All models are depicted in Figure S11.
We were interested in whether this phenomenon also translates into live-cell experiments. Thus, we tested the incorporation of dCTO nucleotide into genomic DNA of living U-2 OS cells; dCTOTP was delivered into the cells using the synthetic transporter SNTT19 in the tricine buffer according to the protocol described9c earlier. Viability assays performed 24 and 48 hours after the treatment with 5 or 10 μM dCTOTP/SNTT1 indicated no cytotoxicity (Figure S7) under these conditions. Treatment of cells with a 5 μM solution of an equimolar mixture dCTOTP/SNTT1 at 37 °C for 5 minutes resulted in abundant fluorescence in the intracellular space as observed by confocal microscopy. Subsequent monitoring of the cells incubated in a complete L15 medium (see time-lapse Video S1 in Supporting Information) suggested that dCTO nucleotide was incorporated into DNA, as indicated by the typical fluorescent punctate patterns in the nuclei of some cells, observed after the decrease of the overall diffuse fluorescence signal in the intracellular space.
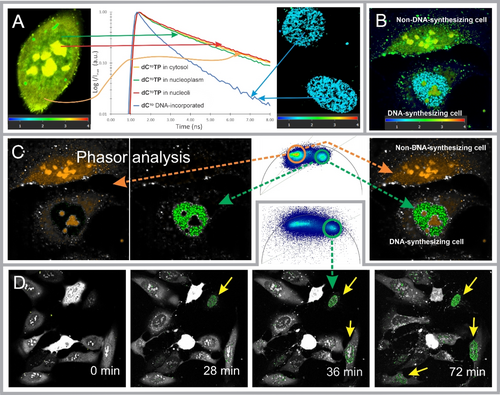
Next, we measured and evaluated the FLTs in various compartments of cells immediately after the treatment with dCTOTP/SNTT1 and also with a delay of 24 hours; the former measurement allowed us to determine the FLT of unincorporated dCTOTP in different compartments of live cells, whilst the latter revealed the FLT of the dCTO incorporated in DNA. The resulting decay curves (Figure 3A) showed an analogous pattern to that observed for in vitro experiments, although all FLTs were longer; the FLTs observed in nucleoli (mean τ=3.38 ns; Table S7; red line in Figure 3A), the cytosol (mean τ=3.43 ns; yellow line), and nucleoplasm of non-synthesizing nuclei (mean τ=3.12 ns; green line) were all significantly higher than the FLT determined in the dots of the active DNA foci found in some cells after 24-hour incubation (mean τ=1.49 ns; blue line). In an additional positive control experiment, the labeled oligonucleotide dsON_GC_2CTO was transfected into live U-2 OS cells, and the FLT in the environment of nucleoplasm was determined; the observed value (τ=1.46 ns; Figure S10) is consistent with that of the dCTO incorporated into genomic DNA (1.49 ns). Thus, the differences in FLTs of free dCTOTP—yet most likely non-covalently bound to various nucleic acids in the intracellular space—and DNA-incorporated dCTO in live cells are in the range of 1.6–1.9 ns.

Real-time imaging of in cellulo incorporation of dCOTP into genomic DNA. (A) “Calibration” measurements: FLT decay curves as determined in various compartments of live U-2 OS cells at 1-min (free dCTOTP; left image) and 24-hour time-points (incorporated dCTO; blue dots—DNA foci; right image) after the treatment with dCTOTP/SNTT1. The fluorescence lifetime color-coded scales (ns) based on an n-exponential re-convolution fit model are shown below the images. (B) Two live cells were imaged 20 minutes after the treatment with dCTOTP/SNTT1; the lower cell shows active DNA synthesis (blue dots) along with some unincorporated dCTOTP in nucleoli (orange and green spots) whereas the upper cell reveals no DNA synthesis (green to yellow green spots). (C) The same image as shown in (B) was analyzed by phasor approach; separated images with longer and shorter FLT pixels, which were selected using a universal circle plot; merged image (right). (D) A part of a time-lapse series of images of an ensemble of cells, which were monitored by FLIM after treatment with dCTOTP/SNTT1 at various time points in the course of incubation. The data was analyzed by phasor approach: active DNA foci (green) were detected by selecting pixels with the short FL population in the phasor universal circle plot (green circle in the inset) while all other pixels were displayed as fluorescence intensities in grayscale. A complete time-lapse video is available in Supporting Information (Video S2).
Having these “calibration” values of specific FLs in hands, we measured FLs in living cells at various time points after the delivery of dCTOTP into U-2 OS cells, in which unincorporated dCTOTP (including non-covalently bound to NAs) as well as DNA-incorporated dCTO were simultaneously present in the intracellular space. We were able to differentiate DNA-synthesizing and non-DNA-synthesizing cells in real time based on the FLTs detected in various compartments in individual cells (Figure 3B). Although pixel-by-pixel fitting using a two-exponential re-convolution algorithm allowed sufficient visual discrimination of DNA foci in cell nuclei in most cases, the presence of species with two-exponential decays in variable proportions in each pixel made the fitting approach inherently inaccurate and, in some cases, made it difficult to distinguish DNA foci from surrounding nuclear components. However, visualization of the active DNA foci was greatly improved and accelerated by using the phasor approach16 to data analysis (Figures 3C and S8E—S8K). We were able to distinguish very clearly nascent DNA in replicating cells even in a time-lapse image series (Figure 3D; for the complete sequence see Figure S9 and Video S2) by selecting the population of pixels with short FLT in the phasor universal circle and keeping all remaining pixels with longer FLT as intensities in grayscale representation.
In conclusion, we have developed a thiazole orange-dCTP (dCTOTP) probe that generates a fluorescent signal with a specific lifetime exclusively upon incorporation into replicating DNA, allowing real-time monitoring of nascent DNA from the very first moments after its formation. The dCTO incorporated into DNA gives shorter FLTs as compared to non-incorporated dCTOTP, most likely due to constraints imposed by the intramolecular linkage on the possible arrangements of TO moieties within the DNA pocket. The absence of the intramolecular bond allows the TO moiety of dCTOTP to intercalate more tightly in dsDNA, resulting in a FLT that is lengthened by 1.6–1.9 ns in the intracellular environment. Fluorescent lifetime imaging microscopy can accurately detect these different modes of interactions in live cells and, thus, allow the monitoring of the DNA synthesis in real time. We anticipate that this probe could be exploited in studies of genomic DNA organization, dynamics, and function.
Acknowledgments
Funding by the Czech Science Foundation (20-00885X) is acknowledged. We thank Dr. J. Humpolíčková (IOCB) for her valuable help and Dr. R. Pohl for the measurement of NMR spectra.
Conflict of interest
The authors declare no conflict of interest.
Open Research
Data Availability Statement
The data that support the findings of this study are available in the supplementary material of this article.


