From Ultrafast Photoinduced Small Polarons to Cooperative and Macroscopic Charge-Transfer Phase Transition
Abstract
We study by femtosecond infrared spectroscopy the ultrafast and persistent photoinduced phase transition of the Rb0.94Mn0.94Co0.06[Fe(CN)6]0.98 ⋅ 0.2H2O material, induced at room temperature by a single laser shot. This system exhibits a charge-transfer based phase transition with a 75 K wide thermal hysteresis, centred at room temperature, from the low temperature Mn3+−N−C−Fe2+ tetragonal phase to the high temperature Mn2+−N−C−Fe3+ cubic phase. At room temperature, the photoinduced phase transition is persistent. However, the out-of-equilibrium dynamics leading to this phase is multi-scale. Femtosecond infrared spectroscopy, particularly sensitive to local reorganizations through the evolution of the frequency of the N−C vibration modes with the different characteristic electronic states, reveals that at low laser fluence and on short time scale, the photoexcitation of the Mn3+−N−C−Fe2+ phase creates small charge-transfer polarons [Mn2+−N−C−Fe3+]* within ≃250 fs. The local trapping of photoinduced intermetallic charge-transfer is characterized by the appearance of a polaronic infrared band, due to the surrounding Mn2+−N−C−Fe2+ species. Above a threshold fluence, when a critical fraction of small CT-polarons is reached, the macroscopic phase transition to the persistent Mn2+−N−C−Fe3+ cubic phase occurs within ≃ 100 ps. This non-linear photo-response results from elastic cooperativity, intrinsic to a switchable lattice and reminiscent of a feedback mechanism.
Introduction
The development of photonic devices, based on photo-induced switching of the physical properties of materials, and which can be controlled on demand and on ultrafast timescale, is a major challenge for science and technology. Nowadays, it is possible to use a single laser pulse, containing a number of photons on the order of the number of active units, to drive ultrafast and cooperative transformations of materials.1 In many cases, these processes involve local electron-phonon couplings, such as polarons,2 which under favourable conditions can stabilise the crystalline lattice in another phase.3 Such ultrafast and contact-less control of materials are promising for various applications using light-based technologies. This is particularly true when the photo-switching occurs at room temperature toward states that can persist long after the stimuli.4 Molecular materials undergoing photoinduced phase transitions (PIPT) show various types of functionalities switchable under photoexcitation, such as conductivity, ferroelectricity, colour or magnetism.5 Among molecular materials, cyano-bridged bimetallic assemblies exhibiting inter-metallic charge-transfer (CT) are very attractive compounds,6 because their multi-functional properties can be reversibly controlled by light.
An ultrafast PIPT towards a persistent phase, occurring at room temperature, was recently reported for the material Rb0.94Mn0.94Co0.06[Fe(CN)6]0.98 ⋅ 0.2H2O (RbMn0.94Co0.06Fe).7 This heterobimetallic cyano-bridged system exhibits a wide charge-transfer thermal hysteresis centred at room temperature, between a low temperature Mn3+−N−C−Fe2+ tetragonal ground state and a high temperature Mn2+−N−C−Fe3+ cubic phase. This CT phase transition is similar to the one of the pure RbMnFe(CN)6 system and derivatives.6d, 6i, 8 At low temperature (LT), the value of the χMT product (Figure 1a, molar magnetic susceptibility χM and temperature T) is characteristic of the Mn3+(S=2)Fe2+(S=0) state, while its value at high temperature (HT) is characteristic of the Mn2+(S=5/2) Fe3+(S=1/2) state. For RbMn0.94Co0.06Fe, it was recently reported that the phase transition occurs around =328 K on warming and around =253 K on cooling, which corresponds to a 75 K wide hysteresis.7 Such entropy-driven CT phase transitions are also associated with giant barocaloric effect and are very promising for highly efficient solid refrigerant.9 Due to the wide thermal regions of bistability of the RbMnFe material and the different derivatives, it is possible to induce the phase transition by a single laser pulse excitation, which is able to switch the material towards a permanent state inside the thermal hysteresis or at low temperature.6i, 7, 10
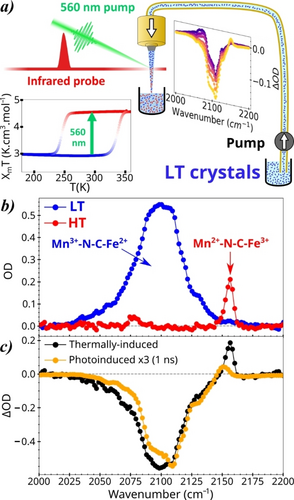
(a) Streaming powder Infrared spectroscopy technique used for time-resolved measurements, performed on sub-μm crystals of RbMn0.94Co0.06Fe dispersed in solution and streamed through a liquid jet. Photoexcitation is performed at room temperature on fresh crystals in the LT phase, which may eventually convert from LT (blue) to permanent HT phase (red). The thermal hysteresis between the HT and LT phases is characterized through the χMT vs T plot. (b) Infrared absorption spectra of RbMn0.94Co0.06Fe measured with the femtosecond IR spectroscopy set-up on a suspension in the liquid jet in HT (red) and LT (blue) phases, with characteristic N−C vibrational bands associated with the different electronic configurations. (c) OD changes of IR spectra for the full thermally-induced LT→HT conversion (black), extracted from the static measurements, and photoinduced changes (orange ×3) at 17.6 mJ cm−2 measured 1 ns after photo-excitation.
For understanding the ultrafast photoinduced CT dynamics in cyano-bridged bimetallic assemblies, different experiments were performed on various systems, such as Fe−Fe, Co−Fe, Mn−Fe or V−Cr materials. Those studies focused mainly on the ultrafast formation of local and transient CT states.6n, 11 Other studies shed a new light on the macroscopic process. On the one hand, femtosecond optical and X-ray spectroscopies revealed that local CT occur within ≃ 200 fs and that it is the photoinduced spin transition that induces local distortions, which are responsible for the trapping of photoinduced CT polarons.6m, 12
On the other hand, ultrafast X-ray diffraction measurements on RbMnFe derivatives revealed that these photoinduced CT polarons drive the macroscopic expansion of the crystalline lattice.7, 13 This volume expansion destabilizes the LT phase above a critical photoexcitation, which drives a macroscopic PIPT within ≃100 ps towards the cubic Mn2+−N−C−Fe3+ phase.7 It was shown that such a PIPT is accompanied by a macroscopic symmetry change towards the cubic phase, as the cooperative CT process occurs. However, the limited time resolution (≃70 ps) and the macroscopic nature of the volume and symmetry changes monitored by X-ray diffraction did not provide information on the role of the CT polarons or their dynamics during the PIPT. We overcome such limitation in the present study by using a combination of femtosecond infrared spectroscopy with the recently developed sample streaming method (Figures 1a and S1). We focus our study on the role of the small CT polarons [Mn2+−N−C−Fe3+]* in driving the far-from-equilibrium dynamics towards the persistent PIPT. In this paper we show that the small CT polarons form within ≃250 (50) fs and present their fluence excitation dependent dynamics. Above threshold excitation, multisite CT polarons appear and a cooperative and macroscopic PIPT occurs within ≃100 ps, from the LT Mn3+−N−C−Fe2+ tetragonal ground state to the persistent Mn2+−N−C−Fe3+ cubic phase. This study underlines the role of the local structural trapping of the photoinduced intermetallic CT process, forming so small polarons, and the key role of their elastic coupling to the active and switchable lattice in the out-of-equilibrium dynamics of the cooperative PIPT.
Results and Discussion
Probing Charge-Transfer with Infrared Spectroscopy
Femtosecond Infrared spectroscopy (IR) is a relevant technique to study ultrafast photoinduced phenomena, especially in molecular-based materials, for which electronic state and vibration modes are strongly coupled.14 In the case of heterobimetallic cyano-bridged materials, IR spectroscopy is known to be particularly sensitive to the intermetallic CT, due to the frequency shift of the IR active N−C stretching mode.11d, 15 For our time-resolved IR spectroscopy measurements, the IR probe beam was generated with a Coherent Astrella amplifier seeding an optical parametric amplifier and difference frequency generation set-up. The ≃90 fs broadband spectrum of the infrared beam was centred at 2105 cm−1 (Figure S2). We pumped the material on the red edge of the absorption band. This Mn-centred (d–d) excitation drives a reverse Jahn–Teller distortion, through the population of antibonding Mn−N orbitals, which induces the intermetallic CT within ≃200 fs.12a The pump wavelength was set to 560 nm where the optical penetration depth is ≃0.6 μm.16 Since excited crystals may reach a permanent photoinduced state, we used a sample powder streaming set-up (Figure 1a), whereby sub-micrometric RbMn0.94Co0.06Fe crystals in the LT phase are dispersed in ethanol and streamed through a free-flowing jet (300 μm thick—6 mm large, Figure S3). The IR optical density (OD) spectral analysis was carried out in transmission geometry, with a monochromator coupled to a Mercury Cadmium Telluride (MCT) photodiode from Infrared Associates and a lock-in amplifier from Stanford Research Systems. The IR probe was focused to a spot size of 130×120 μm2 on the sample.
The larger laser spot size of the pump beam (190×240 μm2) ensures a homogeneous excitation of the sample in the volume probed by the IR beam. The experimental time resolution achieved in this setup is ≃140 fs. The crystal-solvent weight ratio was 1 : 270 with a jet velocity of 0.3 m s−1 at the interaction region. We varied the pump fluence between 0 and 27 mJ cm−2. Figure 1b and S2c show the IR absorption spectra for the LT and HT phases of RbMn0.94Co0.06Fe, in the N−C stretching region. These spectra, measured with our femtosecond IR spectroscopy set-up, are similar to the ones measured with conventional FTIR (Figure S5). This experimental approach was important to use the same spectral resolution for measuring the IR absorption of the steady LT and HT states and out-of-equilibrium dynamics. In the HT phase, the sharp peak at 2157 cm−1 (8 cm−1 full width at half maximum) is assigned to the IR active N−C stretching mode of the Mn2+−N−C−Fe3+ valence state (Figure 2).15 This mode is triply degenerate (T2, x,y,z) in the point group of the cubic HT phase. In the LT phase, the band shifts around 2100 cm−1 as CT decreases the bonding strength.8 Due to the symmetry breaking in the tetragonal phase ( point group), the IR active N−C stretching mode of the Mn3+−N−C−Fe2+ valence state (Figure 2) splits in two: a B2 (z) mode and a doubly degenerate E mode (x,y).15 Due to the formation of boundaries and ferroelastic domains in the LT tetragonal phase, the infrared N−C band is quite broad (Figure 1b), as usually observed for RbMnFe samples and derivatives.8 The black curve in Figure 1c shows the differential IR spectrum upon thermal conversion (HT phase spectrum minus LT phase spectrum), resulting from coupled symmetry change and CT. It is characterized by the disappearance of the broad LT band centred around 2100 cm−1 (negative signal) and the appearance of the sharp HT band around 2157 cm−1 (positive signal). On the other hand, the orange curve shows the photo-induced ΔOD change for high pump fluence (17.6 mJ cm−2), measured 1 ns after photo-excitation of the LT phase at room temperature (within the thermal hysteresis). It is characteristic of the PIPT from the LT Mn3+−N−C−Fe2+ tetragonal phase to the HT Mn2+−N−C−Fe3+ cubic phase. The amplitude of the orange curve is multiplied by 3, which means that about one third of the crystals in the stream are photo-converted at this pump fluence.
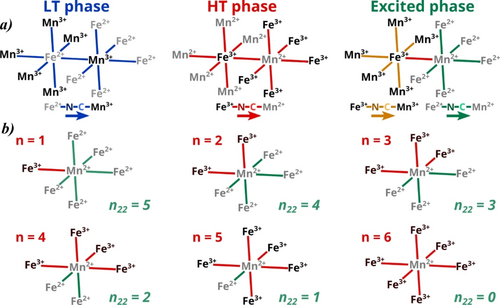
(a) LT phase with Mn3+−N−C−Fe2+ bridges (blue, left), HT phase with Mn2+−N−C−Fe3+ bridges (red, middle) and small CT polaron (right) where a single photoinduced Mn2+−N−C−Fe3+ CT unit (red bridge) is surrounded by 5 Mn2+−N−C−Fe2+ (green) and 5 Mn3+−N−C−Fe3+ (orange) bridges. (b) a single Mn2+−N−C−Fe3+ CT (red) creates 5 adjacent Mn2+−N−C−Fe2+ (green). The CT towards Fe3+ of n=1, 2, 3, 4, 5 or 6 adjacent site(s) (red) creates n22=5, 4, 3, 2, 1, or 0 Mn2+−N−C−Fe2+ bridge(s) (green).
The partial increase of intensity and the spectral shift of the photoinduced Mn2+−N−C−Fe3+ band, compared to HT phase, indicates that the macroscopic dynamics is not complete after 1 ns, as observed by X-ray diffraction.7 Hereafter, we present time-resolved IR measurements and discuss the non-equilibrium electronic and structural dynamics towards the persistent PIPT, inside the thermal hysteresis at room temperature.
Out-of-Equilibrium Dynamics
Figure 3 shows the evolution of the differential IR spectra with time delays for different pump fluences. At high fluence (17.6 mJ cm−2 Figure 3a) the disappearance of the broad LT band and the appearance of the sharp HT Mn2+−N−C−Fe3+ band is characteristic of the LT→HT PIPT. This agrees with the X-ray diffraction study, which evidenced that above a threshold fluence of about 10 mJ cm−2 the Mn3+−N−C−Fe2+ tetragonal→Mn2+−N−C−Fe3+ cubic PIPT occurs within ≃100 ps.7 Our time-resolved IR data confirm that the HT phase forms within this timescale, as directly monitored through the characteristic IR band of the Mn2+−N−C−Fe3+ species (inset Figure 3a).
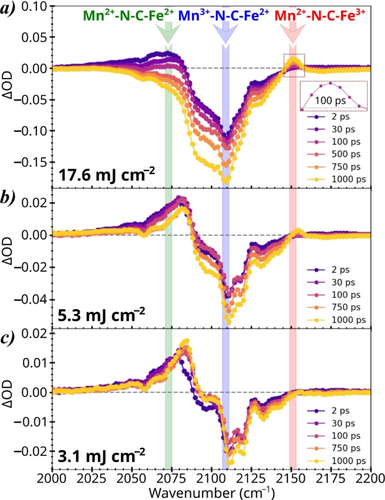
Transient ΔOD for pump fluences of 17.6 (a), 5.3 (b) and 3.1 (c) mJ cm−2, characterizing the depopulation of the LT Mn3+−N−C−Fe2+ state and the population of the Mn2+−N−C−Fe2+ polaronic and HT Mn2+−N−C−Fe3+ states.
However, another IR band appears on shorter timescale around 2073 cm−1. It disappears within 100 ps at high fluence as the HT phase forms, but it persists at 1 ns at low fluence (Figure 3c). The frequency of this IR band is characteristic of the N−C stretching mode of the Mn2+−N−C−Fe2+ electronic configuration (Figure S4), observed in the IR spectra of the Rb2Mn2+[Fe2+(CN)6] ⋅ 3.5H2O material, made of passive Mn2+−N−C−Fe2+ bridges. This band, which was also observed by time-resolved IR spectroscopy at low excitation density for the Rb0.94Mn[Fe(CN)6]0.98 ⋅ 1.3H2O sample, is known to be characteristic of the local structural trapping of the photoinduced CT.11d As shown in Figure 2a, photoexcitation of the homogeneous LT Mn3+−N−C−Fe2+ phase can result in a single intermetallic CT, forming an isolated excited bridge [Mn2+−N−C−Fe3+]*. It is surrounded by five Mn2+−N−C−Fe2+ and Mn3+−N−C−Fe3+ bridges. The detection of the characteristic Mn2+−N−C−Fe2+ IR band after photoexcitation constitutes a direct proof of the local nature of the structural trapping of the intermetallic CT, forming small CT polarons [Mn2+−N−C−Fe3+]*. The local structural trapping of these CT states, due to the spin transition on the Mn sites, is responsible for the macroscopic lattice expansion, which was directly monitored by time-resolved X-ray diffraction.7, 12a The strong oscillator strength of the Mn2+−N−C−Fe2+ band, about six times greater than that of the Mn2+−N−C−Fe3+ band,7 makes femtosecond IR spectroscopy particularly relevant to study the role of the small CT-polaron in the macroscopic dynamics of the photoinduced phase transition.
Figure 4a shows the photoinduced spectral change at 2 ps, scaled to laser fluence. The superposition of the spectral changes at 3.1 and 5.3 mJ cm−2, with a clear common isosbestic point at 2090 cm−1, shows that the differential spectrum changes linearly with the laser fluence at low excitation density. The decrease of intensity of the ground state Mn3+−N−C−Fe2+ band and increase of the Mn2+−N−C−Fe2+ band are linear with pump fluence, as expected for the formation of the small CT polaron.
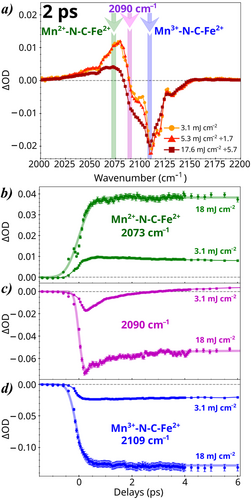
(a) Infrared ΔOD measured after 2 ps and scaled to laser pump fluences. (b) ΔOD(t) measured at 2109 cm−1 (LT Mn3+−N−C−Fe2+ band), 2073 cm−1 (polaronic Mn2+−N−C−Fe2+ band) and 2090 cm−1.
A femtosecond X-ray spectroscopy study of the photoinduced CT process in the Co−Fe material revealed that the mechanism corresponds to a spin-transition-induced CT process.6m Another femtosecond optical spectroscopy study, supported by DFT calculations, on a Mn−Fe material has shown that the optical excitation promotes a Mn (d–d) centered electronic transition. The coupled reverse Jahn–Teller distortion drives intermetallic CT within ≃200 fs.12a Consequently, we consider that the evolution of the ΔOD(t) time traces in Figure 4 should be described through an exponential depopulation of the LT Mn3+−N−C−Fe2+ state and a simultaneous exponential population of the polaronic Mn2+−N−C−Fe2+ band. The fit of these time traces ΔOD(t) (Figures S6–S9) are consistent with this mechanism and indicates that the Mn3+−N−C−Fe2+→[Mn2+−N−C−Fe3+]* electron transfer process occurs within ≃250 fs. Indeed, in the case of a direct photoinduced CT, an instantaneous decrease of OD of the LT Mn3+−N−C−Fe2+ band and an instantaneous increase of the polaronic Mn2+−N−C−Fe2+ band should be observed.
At higher fluence (17.6 mJ cm−2), the ΔOD decrease at 2 ps on the LT band is still scaling with laser fluence (Figure 4a), due to the bleaching of the ground LT phase. However, the ΔOD change on the Mn2+−N−C−Fe2+ band (2075 cm−1) is lower than at lower pump fluence. In addition, the isosbestic point at low fluence (2090 cm−1, Figure 4c) shifts to 2083 cm−1 at higher fluence. These observations highlight that the spectral changes strongly deviate from the linear response at high pump fluence.
Figure 5 shows the normalized ΔOD(t) for the LT Mn3+−N−C−Fe2+ (2109 cm−1), the polaronic Mn2+−N−C−Fe2+ (2073 cm−1) and the HT Mn2+−N−C−Fe3+ (2152 cm−1) species for low and high pump fluences. In agreement with X-ray diffraction,7 we can distinguish two regimes. In the low fluence polaronic regime (bottom) the CT remains local. The photoexcited LT Mn3+−N−C−Fe2+ bridges disappear to form small CT polarons [Mn2+−N−C−Fe3+]*, surrounded by Mn2+−N−C−Fe2+ bridges. These small CT polarons live ≃15 μs, as characterized by time-resolved optical spectroscopy and X-ray diffraction studies.12a, 13 In this polaronic regime, the HT phase does not form and the partial decay of the Mn2+−N−C−Fe2+ band and the associated increase of the LT Mn3+−N−C−Fe2+ band may be interpreted as a partial decay of the small CT polarons towards the ground LT state within 100 ps, which is characteristic of the equilibration timescale of the polarons with the crystalline lattice.7, 13 In the high fluence PIPT regime (top) the macroscopic CT phase transition occurs. The photoexcited LT Mn3+−N−C−Fe2+ phase disappears as small CT polarons [Mn2+−N−C−Fe3+]* form, which is witnessed through the increase of the surrounding Mn2+−N−C−Fe2+ bridges (Figure 4). Then, the Mn2+−N−C−Fe2+ species decay (Figures 3a & 5) while the IR band of the HT Mn2+−N−C−Fe3+ phase grows, indicating a cooperative PIPT process. When a sufficient amount of small CT polarons are initially created, the remaining Mn3+−N−C−Fe2+ sites are further converted because of internal pressure. Our time-resolved IR spectra indicate that this cooperative PIPT occurs within ≃100 ps. This result is in very nice agreement with the recent time-resolved X-ray study, which monitored the growing of the cubic HT phase on a similar timescale.7
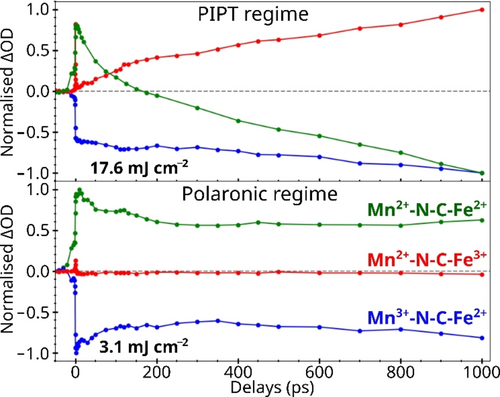
Normalized infrared ΔOD(t), in the PIPT regime (top) and in the polaronic regime (bottom), for the LT Mn3+−N−C−Fe2+ (2109 cm−1), polaronic Mn2+−N−C−Fe2+ (2073 cm−1) and HT Mn2+−N−C−Fe3+ (2152 cm−1) species. We tentatively assign the transient peak around 0 ps in the red curves to the transient Mn-centered excitation.
The change from a local polaronic regime to a macroscopic and cooperative PIPT regime above a threshold fluence is also described in Figure 6, which shows the fluence dependence of the three IR bands at different delays. Figure 6a shows that the LT Mn3+−N−C−Fe2+ species decay almost linearly with laser fluence up to ≃10 mJ cm−2, where their number remains constant up to ≃30 ps and photoexcitation remains local. At higher fluence, the signal saturates below 30 ps as the laser penetration depth (0.6 μm) is a limiting factor, given the size of the crystals (0.9 μm). However, for higher fluence, looking on the amplitude of this depopulation band, it is clear that a cooperative transformation starts around the 100 ps as seen by further decrease of the signal.
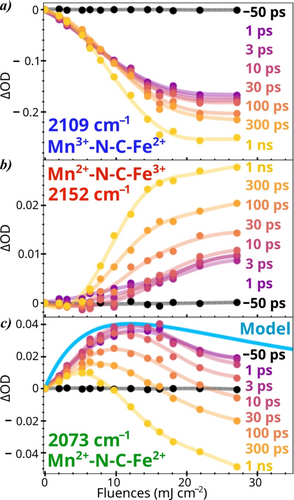
Fluence and time dependence of the ΔOD(t) on the LT Mn3+−N−C−Fe2+ band (a), the HT Mn2+−N−C−Fe3+ band (b) and the polaronic Mn2+−N−C−Fe2+ band (c), where the blue curve corresponds to the model.
Figure 6b also shows that the low fraction of photoinduced Mn2+−N−C−Fe3+ species increases almost linearly with laser fluence below 10 ps, which agrees with the local nature of the photoinduced CT. However, above ≃6 mJ cm−2 the photoinduced Mn2+−N−C−Fe3+ species strongly increase with delay and saturate around 1 ns. This is the signature of the cooperative and self-amplified PIPT. Figure 6c shows a more complex evolution with laser fluence of the Mn2+−N−C−Fe2+ species. For time delays shorter than 10 ps the amplitude of the Mn2+−N−C−Fe2+ band increases almost linearly with pump fluence up to ≃6 mJ cm−2. Above, the amplitude of this band decreases within ≃100 ps as the PIPT occurs. This decrease includes both the decaying photoinduced small CT polaron and the disappearance of the ferroelastic domain walls, containing Mn2+−N−C−Fe2+ species. Figure 2a shows different 3D electronic configurations of the crystalline lattice in the LT phase made of Mn3+−N−C−Fe2+ bridges (blue) and in the HT phase made of Mn2+−N−C−Fe3+ bridges (red).
When a single CT occurs around one site, , and . When CT occur on two adjacent sites, , and per site, etc. The ΔOD around 2075 cm−1 scales linearly with the total number of photoinduced
In a rough approximation, considering a homogeneous excitation, the fraction of photoexcited sites is where ϕ corresponds to the laser fluence and is related to penetration depth. The cyan line in Figure 6c shows the evolution of the number of Mn2+−N−C−Fe2+ bridges calculated with this model and scaled to OD. This model accounts only for the photoinduced change of electronic configuration on picosecond timescale, i.e. when the cooperative elastic effects are not activated yet. This simple model can qualitatively reproduce the measurements, as it explains the almost linear increase of ΔOD on the Mn2+−N−C−Fe2+ band with low laser fluence and its decrease when CT occurs statistically over adjacent crystalline sites. For the Mn2+−N−C−Fe2+ band, the ΔOD is maximum for X=0.3. A more advanced model, such as the mechano-elastic one,17 would be required to describe the cooperative PIPT occurring on the 100 ps acoustic timescale, which corresponds to the time required for the macroscopic expansion of the sub-micrometric crystals. Such an elastically-driven process, associated with elastic deformation waves propagating at the speed of sound, can account for the cooperative conversion of the Mn2+−N−C−Fe2+ species towards the higher volume Mn2+−N−C−Fe3+ ones.
Conclusion
The present time-resolved IR spectroscopy study of the photoinduced and persistent phase transition, at room temperature and within the thermal hysteresis of the RbMn0.94Co0.06Fe material, provides new information on the local and microscopic processes. The results are complementary to the time-resolved X-ray diffraction study published recently.7 Combining both studies provides a global overview of the out-of-equilibrium dynamics behind the macroscopic PIPT. The local nature of the small CT polaron is clearly evidenced by the appearance of the IR bands characteristic of the small CT polaron, with adjacent Mn2+−N−C−Fe2+ bridges. The IR data show that the intermetallic CT timescale is ≃ 250 fs, as directly monitored through the fast decay of the Mn3+−N−C−Fe2+ band and population of the Mn2+−N−C−Fe2+ band. The ultrafast formation of these small CT polaron, driven by the photoinduced spin transition on the Mn site, expand the lattice. The macroscopic acoustic timescale for volume expansion at the level of single sub-μm crystals is around 100 ps.7 Above a critical excitation density, the volume expansion driven by the photoinduced CT small polarons favors the higher volume HT cubic phase and the Mn2+−N−C−Fe3+ electronic state. The IR data show that the PIPT is a highly non-linear process. On short timescale and at low fluence, the fraction of small photoinduced CT polarons [Mn2+−N−C−Fe3+]* evolves linearly with pump fluence. However, on the acoustic timescale, a self-amplified transformation occurs. This elastically driven cooperativity, activated by the light pulse, is similar to the one reported in spin-crossover materials.17 This process far exceeds the action of the photons alone, which leads to the formation of isolated CT polaron on short timescale, scaling linearly with pump fluence. In the present photoactive and volume changing material, for a fluence of 12.1 mJ cm−2, just above threshold, the OD of the photoinduced Mn2+−N−C−Fe3+ CT species changes from 0.003 at 10 ps to 0.018 after 1 ns (Figure 6b). This shows that when a critical fraction of CT polaron is photoinduced, the consecutive volume expansion drives a self-amplified CT and cooperative PIPT. The efficient structural trapping of the small CT polarons, which live more than 10 μs, allows for an efficient elastically-driven cooperative transformation. The size of the crystals, slightly larger than the penetration depth of the pump, precludes more quantitative analysis in terms of photoexcited fractions. However, IR spectroscopy made it possible to highlight the key role of the small CT polarons in the out-of-equilibrium dynamics of the cooperative photoinduced phase transition.
Acknowledgments
The authors gratefully acknowledge the Agence Nationale de la Recherche for financial support under grant ANR-19-CE30-0004 ELECTROPHONE, ANR-19-CE07-0027 SMAC, ANR-19-CE29-0018 MULTICROSS. G.P. thanks Région Bretagne for partial Ph.D. funding (ARED PHONONIC). E.C. thanks the University of Rennes, the Fondation Rennes 1 and Region Bretagne (Boost′ERC) for funding. This work was carried out in the frame of a JST FOREST Programme (JPMJFR213Q), a JSPS Grant-in-Aid for Scientific Research (B) (22H02046) and Scientific Research (A) (20H00369).
Conflict of Interests
The authors declare no conflict of interest.
Open Research
Data Availability Statement
The data that support the findings of this study are available from the corresponding author upon reasonable request.


