Desolvation-Induced Highly Symmetrical Terbium(III) Single-Molecule Magnet Exhibiting Luminescent Self-Monitoring of Temperature
Abstract
A conjunction of Single-Molecule Magnet (SMM) behavior and luminescence thermometry is an emerging research line aiming at contactless read-out of temperature in future SMM-based devices. The shared working range between slow magnetic relaxation and the thermometric response is typically narrow or absent. We report TbIII-based emissive SMMs formed in a cyanido-bridged framework whose properties are governed by the reversible structural transformation from [TbIII(H2O)2][CoIII(CN)6] ⋅ 2.7H2O (1) to its dehydrated phase, TbIII[CoIII(CN)6] (2). The 8-coordinated complexes in 1 show the moderate SMM effect but it is enhanced for trigonal-prismatic TbIII complexes in 2, showing the SMM features up to 42 K. They are governed by the combination of QTM, Raman, and Orbach relaxation with the energy barrier of 594(18) cm−1 (854(26) K), one of the highest among the TbIII-based molecular nanomagnets. Both systems exhibit emission related to the f–f electronic transitions, with the temperature variations resulting in the optical thermometry below 100 K. The dehydration leads to a wide temperature overlap between the SMM behavior and thermometry, from 6 K to 42 K. These functionalities are further enriched after the magnetic dilution. The role of post-synthetic formation of high-symmetry TbIII complexes in achieving the SMM effect and hot-bands-based optical thermometry is discussed.
Introduction
Directed by requirements of miniaturization and multi-tasking for devices and sensors, molecular materials are investigated because they can incorporate several functionalities in a single phase.1 They can co-exist,2 or interplay giving the switching of one property by the other or even generating new physical cross-effects.3 For instance, the coupling between magnetism and photosensitivity of the material can result in light-induced ferrimagnetism4 or photoswitching of second-harmonic light when the system is chiral.3c Other products of magneto-optical coupling include magneto-chiral dichroism, optically addressable qubits, and magnetoluminescence.5, 6, 7 Aiming at high-density data storage, an enormous scientific interest is given to single-molecule magnets (SMMs), which exhibit a magnetic memory effect at the molecular level.8 The design strategy for high-performance SMMs is based on the use of lanthanide ions (Ln3+) of an oblate-type character of the highest mJ state's electron density, in an axially strengthened ligand field.9 As a result, the Dy3+-based SMMs raised the magnetic blocking to ca. 80 K,10 making SMM-based memory devices achievable.11 Some Ln3+-based SMMs offer intriguing optical features due to the emission from f–f electronic transitions.12 Luminescent SMMs were studied for magneto-optical correlations,13 e.g., the spectroscopic determination of ligand-field states,14 control over emission by a magnetic field,15 and field sensing by the optical signal.16 One of the emerging routes is optical thermometry using SMMs, aiming at a non-invasive read-out of temperature through the emission of a magnetic center.1f, 2b, 16, 17 Since the effect of slow magnetic relaxation is T-dependent, insight into the working temperature is of primary importance for future SMM-based devices.18 The idea is to construct a single-phase material that will exhibit both the SMM and thermometric effects (Scheme 1). It will have vast advantages over the system of two bonded materials showing these properties separately as the composite will have a slower response and an additional noise in SMM features can appear. Such issues are solved for SMM-based optical thermometers which give a fast sensing response and the undisturbed SMM features. To accomplish such an idea, the working T-range between magnetic and optical effects must overlap. Among the known SMMs showing optical thermometry, only one example meets this criterion but within a narrow range of 5–10 K while the other report shows the ca. 10 K overlap between the moderate optical thermometry and the SMM features generated by the strong field of 3.6 T.17b, 19 The difficulty of finding T-overlap can be attributed to the limited working regime for most SMMs;9c thus, optical thermometry has to operate at cryogenic temperatures. This happens for some LnIII complexes but these examples -did not show the distinct SMM effect.13 Thus, the simultaneous design of magnetic anisotropy, as well as thermometry at cryogenic temperatures, is the key to achieving high-performance SMM-based optical thermometers.
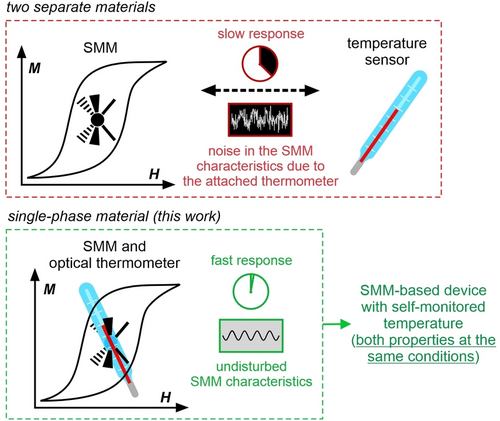
Concept of the work—the construction of the single-phase material working both as the SMM and the optical thermometer at the same temperature conditions for the future application in SMM-based devices with optically self-monitored temperature.
In recent years we and others employed cyanido complexes of d-block metal ions for bimetallic d-f systems working as luminescent SMMs.2b, 20, 21-23 Using this strategy, optical thermometry was found in the vis or NIR region;2b, 21, 22 however, no overlap with SMM behavior was identified due to moderate magnetic anisotropy. We also demonstrated that magnetic anisotropy of DyIII centers can be enhanced by the post-synthetic dehydration of a three-dimensional (3D) DyIII−[CoIII(CN)6]3− framework.23 To get large magnetic anisotropy for an SMM-based luminescent system, we decided to study an analogous framework built of Tb3+ ions. These 4 f metal centers show green emission due to f–f electronic transitions.24 They are non-Kramer's magnetic centers but of large magnetic anisotropy when embedded in a crystal field of high symmetry. This was identified for complexes built with phthalocyaninato ligands (D4d symmetry),1g, 8b, 25 and recently for arachno-carboranyl ligands (D6h symmetry).26 The TbIII-analog of the 3D hydrated DyIII−[CoIII(CN)6]3− network was shown to give moderate magnetic anisotropy;27 but its dehydration toward the D3h symmetry and their emission was not presented. Here, we report structures, magnetic and optical properties of the 3D coordination network, [TbIII(H2O)2][CoIII(CN)6] ⋅ 2.7H2O (1), and its dehydrated phase, TbIII[CoIII(CN)6] (2) (Figure 1). The latter shows the conjunction of SMM behavior and optical thermometry, with a wide T-overlap of their working ranges. These effects are enriched by the magnetic dilution as shown in the [Tb0.026Y0.974(H2O)2][Co(CN)6] ⋅ 2.7H2O (1 md) and Tb0.026Y0.974[Co(CN)6] (2 md) phases.
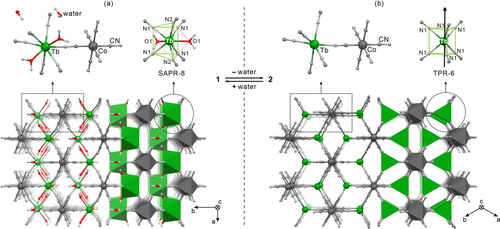
Crystal structures of 1 (a) and 2 (b): the views of the molecular building units, the geometry of TbIII complexes, and the cyanido-bridged framework. For 2, the direction of the easy magnetic axis determined by the ab initio calculations was shown as a black arrow.
Results and Discussion
The initial system, 1, was obtained from an aqueous solution of TbIII(NO3)3 and K3[CoIII(CN)6], while 2 was prepared by the thermal dehydration of 1 (see SI). The single-crystal X-ray diffraction (SC-XRD) studies revealed a single-crystal-to-single-crystal manner of transition between 1 and 2 (Figures 1 and S1, Tables S1–S4). This happens due to the stability of the coordination skeleton built of rigid octahedral [CoIII(CN)6]3− units and Tb3+ ions. All the CN− ligands serve as molecular bridges between the TbIII and CoIII centers, as depicted by SC-XRD and IR spectra (Figure S2). The inorganic Tb[Co(CN)6] network is stable up to ca. 570 K, as shown by TGA (Figure S3). The hydrated 1 crystallizes in an orthorhombic Cmcm space group. Per the formula unit, it contains a single [Co(CN)6]3− ion, two aqua ligands coordinated to the TbIII center, as well as two water molecules of crystallization (Figure 1a). The resulting TbIII complex has a coordination number of eight, constituted by two O-atoms and six N-atoms from CN– molecular bridges. The geometry for the {TbIIIO2N6} unit is close to a square antiprism (SAPR-8); however, the first coordination sphere can be also described as a bicapped trigonal prism (BTPR-8) (Table S3). The removal of all water molecules leads to the dehydrated phase of 2, of a hexagonal P63/mmc space group. The geometry of the {CoIIIC6} unit remains unchanged but the TbIII coordination sphere transforms into a trigonal prism (TPR-6), consisting of six N-atoms of cyanido ligands (Table S4). The transformation between 1 and 2 is reversible as shown by the powder X-ray diffraction (P-XRD) patterns (Figure S4).
 (1a)
(1a)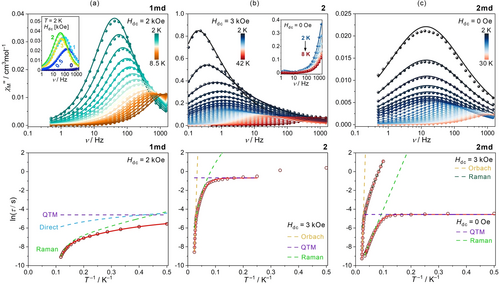
Alternate-current (ac) magnetism of 1 md (a), 2 (b), and 2 md (c): the T-variable frequency dependences of the χM”, gathered under the indicated dc fields (top), and the T- dependences of the relaxation times with the best-fit curves obtained using the components of equation 1ab (bottom). For 1 md (a, top), the representative χM”(ν) curves under variable dc fields were presented in the inset. For 2 (b, top), the zero-dc-field χM”(ν) curves were shown in the inset. For 2 md (c, bottom), the T-dependence of the relaxation time for the ac data under 3 kOe, with the best-fit curves, was presented for comparison (see Figures S16–S19).
Compound (Hdc) |
Parameters of relaxation processes (eq. 1ab) |
|||
|---|---|---|---|---|
Orbach: ΔE [cm−1] {ΔE/kB [K]}, τ0 [s] |
Raman: ω1, ω2 [cm−1], C1, C2 [s−1], n, CRaman [s−1 K−n] |
QTM: B1 [s−1], B2 [Oe−1], or τ [s] |
direct: Adir [Oe−2 s−1 K−1] |
|
1 md (2000 Oe) |
– |
ω1=28(2), ω2=340(17), C1=1.7(2)×103, C2=5(2)×109 |
B1=2.0(2) ×103, B2=4.9(7) ×10−6 |
1.04(2)× 10−5 |
2 (3000 Oe) |
594(18) {854(26)}, 3(2)×10−13 |
n=4.79(6), CRaman=6(1)×10−6 |
τ=0.51(1) |
– |
2 md (0 Oe) |
596(8) {859(12)}, 3.2(9)×10−13 |
ω1=306(3), C1=6.2(3)×104 |
τ=0.011(2) |
– |
2 md (3000 Oe) |
ω1=306(3), ω2=729(31), C1=340(25), C2=1.2(3)×104 |
– |
– |
|
2 md (5000 Oe) |
ω1=306(3), ω2=729(31), C1=201(14), C2=6(1)×104 |
– |
– |
|
2 (ab initio) |
598.8 (S-unit) 564.5 (L-unit) |
– |
– |
– |
 (1b)
(1b)Taking the latter into account the T dependence of relaxation time for 1 md was fitted using QTM and Direct parameters extracted from the H variable experiment and Raman relaxation described by two vibrational modes of 28(2) and 340(17) cm−1. The Orbach pathway was not found for this phase (Figures 2a, S8, and S9). The best-fit parameters are collected in Table 1. 2 reveals the χM” signal in the high-frequency regime under a zero external dc field (Figures 2b, S10, and S11). Although the χM” maxima are lying above the detection limit of 1500 Hz, this onset of dc-field-free slow magnetic relaxation suggests the improved SMM effect after dehydration. More precise studies of 2 were performed with an applied dc field. To find an optimal Hdc, the ac dependences were analyzed in the 0–9 kOe range at 15 K (Figure S12). Upon elevating the dc field, the τ values increase as evidenced by the continuous shift of the χM”(ν) maxima. However, above 3 kOe magnetic relaxation slows down to a much smaller extent (Figure S12). Thus, we chose Hdc=3 kOe, under which the T-variable data were collected in the 2–42 K range (Figures 2b and S13). The relaxation times were then extracted and their combination with the ones extracted from the Hdc-variable experiment (Figure S12) gave all parameters of the magnetic relaxation (Table 1). Due to the presence of weak interactions affecting the relaxation time at the lowest temperatures, the Raman contribution was fitted with the term depicted in eq. 1a. The resulting fit shows that the QTM effect dominates at the lowest T, further, the Raman contribution with the power n of 4.79(6) plays an essential role, while the highest T-range above 30 K is governed by Orbach relaxation (Figures 2b, S12, and S13). The thermal energy barrier of 594(18) cm−1 (854(26) K) is comparable with the largest ones for TbIII SMMs [8b,26] and matches the theoretical value (Tables S7 and S9).
Prompted by the value of ΔE unveiled under the external dc field, we decided to obtain a more pronounced SMM behavior using the dilution effect. The 2 md-TbxY1–xCo (x=0.01–0.11) samples were prepared (see the SI, and Figure S14). The ac data revealed that the TbIII concentration at the 10 % level is proper to induce the SMM behavior with χM”(ν) maxima lying below 1500 Hz (Figure S15). Further decrease of the TbIII amount slows down the relaxation giving the magnetic hysteresis loop. It is the most visible for 2 md-Tb0.01Y0.99Co. For this system, the blocking temperature is 5 K, however, the M(H) butterfly shape appears due to the QTM effect (Figure 3a). The dilution reveals an evident deceleration effect, which is pronounced for the τ values at lower T (Figure S15d). This improvement can be ascribed to the quenching of dipolar Tb−Tb interactions. A similar trend, but for the weaker SMM, was also found for 1 and 1 md.
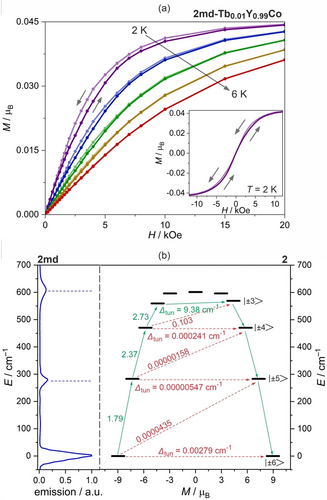
Magneto-luminescent characteristics of 2: the fragments of magnetic hysteresis loops for the 2 md-Tb0.01Y0.99Co (a) shown with the full loop at T=2 K (a, the inset), the energy splitting of the ground 6H15/2 multiplet obtained from the ab initio calculations (Table S9) with the probable Orbach relaxation represented by green arrows (b), compared with the emission spectrum at 3.5 K for 2 md. The numbers placed above each arrow indicate the corresponding matrix element of the transversal magnetic moment whereas the Δtun is the tunneling gap of the indicated doublets.
For full ac characterization, the 2 md-Tb0.026Y0.974Co system, named 2 md, was selected (Figures 2c and S16–S19). The zero-dc-field curves for 2 md were used to extract the set of τ values up to 30 K (Figure 2c). The ln(τ) vs. T−1 plot shows linear dependence of Arrhenius type above 17 K, giving the energy barrier of 52.1(7) cm−1. This value is too small for the expected Orbach relaxation, suggesting that the dc-field-free relaxation is governed by the Raman process. In the lower T regime, the QTM still plays a pivotal role. After the application of the dc field, the QTM is quenched, the Raman is modified, and the Orbach appears to be well visible for the high-T range above 35 K. All three T dependencies under different Hdc values were fitted simultaneously with the Orbach parameters (τ0, ΔE) and two vibrational frequencies (ω1, ω2) shared. The Orbach relaxation is described by the energy barrier of 596(8) cm−1 (859(12) K), close to found for 2 (Table 1). This proves that the Orbach process is due to the generated TbIII complexes of 2. On the other hand, the crucial vibrational modes were identified as 306(3) and 729(31) cm−1, with Ci parameters being H-dependent. The ac magnetism was also used to check the reversibility of the dehydration (Figures S20 and S21).
The conclusions from the ac magnetic measurements are supported by the ab initio calculations performed for TbIII centers of 1 and 2 (Figures 3 and S22, Tables S5–S10), and the emission spectra at various T (Figures 3 and S23–S27). The calculations provided the energy positions of the excited mJ levels for the Orbach relaxation; in 1, the relaxation can occur through the first excited pair at ca. 100 cm−1 while, in 2, the Orbach process is likely to occur through the third one, at ca. 580 cm−1 above the ground level (see Supporting Information for details). The magnetic axes for the ground states were calculated (Figures 1b and S22). In 1, it nearly goes through the walls of two triangular arrangements of CN− ligands with a deviation towards aqua ligands. In 2, the anisotropy axis goes ideally perpendicular to the triangular walls of the trigonal prismatic polyhedron along the 3-fold rotation axis. The validity of the calculations is confirmed by the good reproduction of the dc data, especially for 2 (Figure S5). The T-variable emission spectra, in the range of the 5D4→7F6 electronic transition, were gathered down to 3.5 K for 1, 2, 1 md, and 2 md. For this transition in 2 md at 3.5 K only three maxima are observed (Figure 3b). They correlate with the calculated energies of the ground pseudo-doublet, the first excited one, and those of higher energy. A similar case was found for 2, while for 1 and 1 md the comparison between the calculations and the low-T spectra needed the analysis of the hot bands. We calculated the energy splitting for the emissive 5D4 multiplet (Table S10). It helped us in the assignment of transitions which enables the magneto-optical correlations (Figures S23–S26).
The optical properties of 1 were first studied using UV-vis-NIR absorption spectra. An intense absorption band below 380 nm is due to d–d electronic transitions of CoIII embedded in a strong crystal field (Figure S28). In the next step, the emission properties of 1, 2, 1 md, and 2 md were studied (Figures 4, 5, and S29–S44, Tables S11–S26). The presence of [Co(CN)6]3− ions, which at least partially transfer the excitation energy to the TbIII centers, induces the green 4 f metal-centered luminescence at 300 K for 1 and 2 (Figures 4, S29, and S30).27 For 1, the UV irradiation of the 240–370 nm band (Figure S29) induces Tb3+ emission peaks at 490, 540, 582, 619, and 640 nm (Figure 4a). Such a pattern is related to f–f electronic transitions of the 5D4→7F6, 7F5, 7F4, 7F3, and 7F2 origin, respectively. Within each emissive band, several sharp components can be identified reflecting the crystal field splitting. Moreover, in the 500–750 nm range, an additional band at ca. 610 nm appears which is attributed to red emissive [Co(CN)6]3− ions (3T1g→1A1g transition, Figure S32).20, 29 It was found strong for the YIII-based analog of 3 (Figure S31). In 1, the residual CoIII-centred emission with the TbIII-related peaks produces a yellowish-green emission at 300 K (Figures S33 and S44). 2 exhibits a series of TbIII bands but shows modified energy-splitting patterns (Figures 4a and S35). The intensity of the d–d band is weaker when compared with 1 (Figure S32). Moreover, 2 shows ca. 6.8 and ca. 5.3 times stronger intensities of the 5D4→7F6 and 5D4→7F5 emissive peaks, respectively (Figure 4a). The increase of TbIII-centered emission is supported by the lifetime measurements, which reveal the increased value in 2 (Figure 4b). With the higher contribution of TbIII emission, 2 at 300 K shows green emission without a yellow hue (Figures S35 and S44). The re-hydrated 1′ reveals an identical emission to the one for 1 (Figure S32).
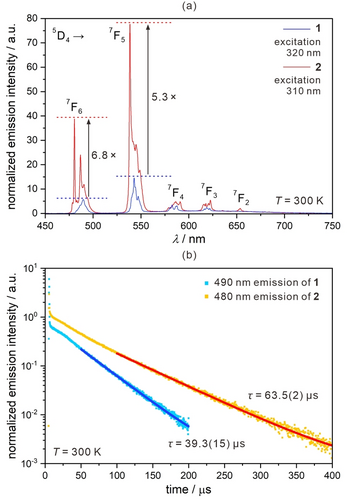
Room-temperature photoluminescence of 1 and 2: the spectra normalized to the 610 nm band of the CoIII origin (a), the emission decay profiles (b).
Both 1 and 2 were tested in the 300–3.5 K range for optical thermometry (Figures 5, and S33–S44, and Tables S11–S26). For 1, upon cooling, the intensity of TbIII emissive lines increases faster than the CoIII emission suggesting the enhanced efficiency of the sensitization process combined with the reduction of the quenching effect by O−H oscillators. As a result, down from 230 K the emission color shifts to green (Figures S33 and S44). Below 90 K, the increase of Tb3+ emission slows down and further slightly decreases due to the thermal depopulation of the hot transitions (Figures 5a, S23, S33, and S34). For 2 similar trends are observed. By lowering the temperature, the TbIII emission increases, and a set of gradually depopulating hot bands is found (Figures 5a, S25, S35, and S36). To assign the specific peaks to hot and cold electronic transitions, we analyzed the spectra using the calculated energy splitting both for the ground and excited multiplets of TbIII centers (Figures S23–S27). 1 and 1 md show a large overlap between emissive bands which stays in agreement with the small splitting both for the ground and emissive multiplets (Figures S23 and S24). On the contrary, 2 and 2 md exhibit the large energy splitting for the ground TbIII multiplet providing good separation of the cold emission bands. Thus, the hot bands are distinguished much easier, especially since the splitting for the emissive multiplet is smaller (Figures 5a, S26, and S27). The other, lower-energy bands behave similarly for 1, and in the whole T range the emission of the 5D4→7F5 origin dominates (Figure S33). Then, the emission color shifts from yellowish-green to a deeper green due to the red emission of the CoIII origin which becomes marginal at low T. On the contrary, 2 exhibits an unusual cooling-induced change in the emission color. On cooling from 300 to 200 K, it behaves similarly as 1 shifting the emission from yellowish-green to green, but, at lower T, the emission shifts toward the white color (Figures S35 and S44). This is related to the change in the ratio between the main emission components corresponding to the 5D4→7F6 and 5D4→7F5 transitions (Figure S35). The intensity of the 5D4→7F5 band in comparison to the 5D4→7F6 one is usually stronger. Both these transitions are of a dominant electron-dipole character, thus, they are sensitive to the local environment; however, they belong to different selection rules, ΔJ=±2 and ΔJ=±1, respectively. It results in distinguishable sensitivity to, e.g., the local structure and the TbIII-ligand bond covalency.30 The 5D4→7F5 band is strongly dependent on the asymmetry of the ligand field, so it appears that the high-symmetry TbIII centers in 2 provide a rare example of weakening the 5D4→7F5 band in comparison to the 5D4→7F6 band.
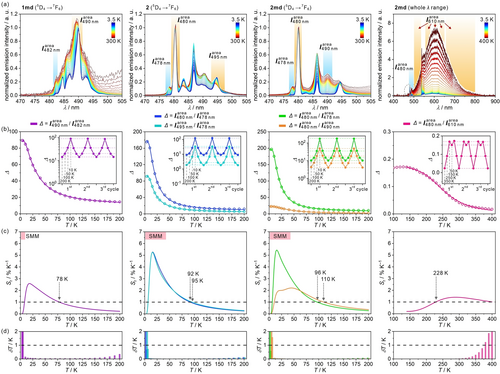
Selected T-dependent emission spectra of 1 md, 2, and 2 md, and the resulting thermometry characteristics: the normalized emission spectra of 1 md, 2, 2 md in the view for the 5D4→7F6 electronic transition, and 2 md in the range of 400–610 nm (a), the thermometric calibration curves, Δ(T), for the thermometric parameters involving the ratios between the integrated areas for the peaks (b), the relative sensitivity dependences, Sr(T), (c), and the T uncertainty curves, δT(T) (d). The empty circles in (b) are the experimental data, while the solid curves are the best fits of the Mott–Seitz model. The resulting parameters are gathered in Tables S14, S16, S18, S22, S24, and S26. The insets in (b) correspond to three thermal cycles. In the (c) part, the T-range of SMM behavior was shown.
 , Figures S34 and S36, Tables S12, S14, S20, and S22). Similar characteristics can be obtained with the emission intensities at the maximum (
 , Figures S33 and S35, Tables S11, S13, S19, and S21). Both 1 and 2 offer many combinations of peaks suitable for the thermometric parameters, Δ=
 /
/ , among which one is assigned to the hot band, while the second is the cold band. Thus, we explore the cooling-induced enhancement of the cold bands and the disappearance of the hot bands. As the energy splitting of the emissive multiplet is small, the lowest-lying excited levels are still populated below 50 K, and the thermometry appears in the 10–100 K range. All four f–f bands of the 5D4→7F6,5,4,3 origin for 1 and 2 can be employed for the thermometry (Figures 5 and S33–S36); however, the highest-energy 5D4→7F6 band of 2 is particularly good as the hot bands are easily distinguished. The Δ(T) relationship is given by a Mott–Seitz model, equation 2:18, 24
 (2)
(2)where Δ0 is the thermometric parameter at T=0 K, αi and α2 are the ratios between non-radiative and radiative rates, and ΔE1 and ΔE2 are the activation energies for the non-radiative channels. The best-fit ΔE1/kB, ΔE2/kB values lie in the ranges of 110–180 and 30–40 K, respectively, for 1, and 130–230 and 39–45 K, respectively, for 2 (Tables S11–S14). To evaluate the performance of Δ(T) curves, parameters of relative thermal sensitivity, Sr=|∂Δ/∂T|/T, and T uncertainty, δT=(δΔ/Δ)/Sr were examined, taking into account the criteria of good performance thermometry, Sr>1% K−1 and δT<1 K.18, 24 Such analysis revealed that selected Δ parameters provide good performance in the characteristic λ ranges (Figures 5c and S33–S36), working for the low T region up to 113 K (Tables S19–S22). 1 and 2 offer a readout in four different visible-light sub-ranges of the emission spectra related to 5D4→7FJ transitions. Furthermore, using the integrated areas, the best performances were found for the Δ(T) curves obtained for the 5D4→7F6 transition, which, for 1, provides the maximal Sr of 5.49 % K−1 at 13.6 K for the Δ parameter defined as  /
/ , and, for 2, gives the high maximal Sr of 5.28 % K−1 at 15.9 K with the Δ parameter defined as
  /
/ . More importantly, for 2 in the wide 6–42 K range, the high-performance regime for most of Δ(T) curves overlaps with the SMM (Figures 2 and 5c). The T-dependent emission of 1 md and 2 md was also examined (Figures 5 and S37–S44). They exhibit similar TbIII emission as 1 and 2. However, at 300 K, the emission originating from CoIII is dominant (Figures S37, S38, and S44). Upon cooling, emission intensities of both origins increase, yet for the TbIII faster. In 1 md/2 md, the thermometry based on the 5D4→7F5,4,3 transitions is disabled due to the broad CoIII emission but the emission of the 5D4→7F6 transition can be used for thermometry (Figures 5 and S39–S43, Tables S15–S18 and S23–S26). The analyses for 1 md revealed a good thermometric performance in the 8–78 K range with the max. Sr of 2.58 % K−1 at 18.3 K using Δ=
 /
/ . The 5D4→7F6 transition of 2 md offers two parameters, Δ=
 /
/ and Δ=
 /
/ , showing working T-ranges of 6–96 K and 10–110 K, respectively (Figures 5, Tables S13 and S17). The max. Sr values are enhanced, reaching 5.44 % K−1 at 14.7 K for the first range. 1 md and 2 md serve also as higher-T optical thermometers employing the intensity ratio between TbIII and CoIII emissions (Figures 5, S39, and S40, Tables S15–S18 and S23–S26). Thus, the obtained set of compounds explores two types of optical thermometry, the single-center one working on the hot and cold f-f electronic transitions, and the dual-center one relying on the thermally coupled d–d and f–f emissive states (Figure S45).
Conclusion
We report a 3D TbIII−CoIII network showing a reversible dehydration-induced phase transformation that gives trigonal prismatic TbIII complexes bearing six cyanido ligands. These TbIII complexes combine high symmetry and the axial alignment of charged ligands, two prerequisites for high-performance TbIII SMMs, rarely accessible within the coordination chemistry. As a result, they exhibit large magnetic anisotropy with a thermal energy barrier of 594(18) cm−1, comparable with the best TbIII SMMs.8b, 25, 26 Moreover, the obtained SMMs exhibit optical thermometry which works at the cryogenic T-range, thus overlapping with the region of the SMM phenomenon.
We prove that the high-symmetry TbIII complexes with the axial alignment of charged ligands are great candidates for the generation of luminescent SMMs whose temperature operating ranges for both physical properties overlap, which realizes the idea of the SMM-based optical thermometer for the future application in magnetic nanodevices with optically self-monitored temperature. The high-performance SMM behavior for TbIII, as the product of high local symmetry and the axial arrangement of ligands, follows the well-defined, yet rarely realized, strategy for strong magnetic anisotropy. On the contrary, we show that such specific TbIII complexes reveal efficient optical thermometry below 100 K. It uses the strong thermal variation of hot emission bands from the higher-lying mJ states within the emissive 5D4 multiplet to the series of mJ levels of the ground 7F6 multiplet. We found two key features of the obtained complexes that result in the optical thermometry of desired characteristics. First, the large energy splitting for the ground multiplet provides a good separation of the emission components related to cold electronic transitions, thus the hot bands, showing strong T-dependence, can be employed in the thermometer's construction. Second, the large energy splitting is observed for the ground multiplet, but for the emissive multiplet is much smaller. As a result, the higher-lying energy states of the emissive multiplet are populated even below 100 K enabling the observation of the hot emission bands disappearing down to low T. The high symmetry may contribute to this effect as it is expected to induce not only the pure bottom mJ state of the ground but also the emissive multiplet decreasing the related emission in comparison to that from the hot bands. These features are critical for optical thermometry overlapping with the SMM property in the broad range of 40 K. As the emission of TbIII centers always occurs from the same types of energy multiplets, it is expected that TbIII centers in a high symmetry environment with the axially aligned negatively charged ligands will give efficient low-T optical thermometry accompanied by the SMM effect.
Acknowledgments
This research was financed by the National Science Center of Poland, the OPUS-21 project (2021/41/B/ST5/02544), and the JSPS within a Grant-in-Aid for JSPS fellows (19J22088), a Grant-in-Aid for Scientific Research (A) (20H00369), a Grant-in-Aid for Scientific Research (B) (22H02046), and a JST FOREST Program (JPMJFR213Q). The Cryogenic Research Center, The Univ. of Tokyo, the Center for Nano Lithography & Analysis, The Univ. of Tokyo, supported by MEXT, Q-LEAP (JPMXS011806 8681), is also acknowledged. J. J. Z. thanks the Polish Ministry of Education and Science for funding the “Diamond Grant” program (DI2018 017848). J. W. thanks the Tsukuba Basic Research Program (Type S). The open-access publication has been supported by a grant from the Faculty of Chemistry under the Strategic Programme Excellence Initiative at Jagiellonian University.
Conflict of interest
The authors declare no conflict of interest.
Open Research
Data Availability Statement
The data that support the findings of this study are available from the corresponding author upon reasonable request.


