Contact Charge Transfer between Nominally Identical Materials
Abstract
Differences in concentrations of excited electrons arising from geometry-dependent differences in de-excitation paths lead to differences in Fermi energies, which enable contact charge transfer between otherwise identical solids of different size. This model is used with a quasi-equilibrium description of the Fermi energy to estimate a lower bound of the magnitude of charging of pairs of like particles and the charge distribution in groups of interacting like particles. The predictions agree with observed charge transfer directions between large and small particles and with the broad particle size range over which charging is observed. Estimates of charging are compared to available measurements, the breakdown limits of air, and the relative strengths of interparticle electrostatic and gravitational forces. The influence of particle size distribution on the charge distribution in groups of particles is examined.
1 Introduction
Contact charge transfer between chemically identical solids with no evident asymmetry other than size or surface morphology has been a fascinating, unsolved problem in electrostatics for over two centuries. The effect gives rise to safety and quality control issues in industrial and pharmaceutical particle processing, to electrical effects in volcanic plumes, and in both terrestrial and non-terrestrial dust clouds. Charging can play a role in the agglomeration of particles, the adhesion of particles to surfaces, and can interfere with electronic circuitry. The most well-known early observations are on charge transfer between solid particles of different size, but otherwise identical properties.[1-3] Much of this literature has been ably reviewed in recent years.[4-7] Less well known are the reports of charge transfer between rougher and smoother glass plates, some of which go back to the 18th century.[8-13] In most observations, the smaller (or rougher) object becomes negatively charged with respect to the larger (or smoother) object; however, there are isolated reports of charging in the opposite direction for both polymer[14] and glass[15] particles. Tribo-charging has also been proposed as a source of electrical energy for wearable electronic devices.[16, 17]
No consensus has been reached on the mechanism.[18-24] There is evidence that under some conditions, ions rather than electrons may act as the charge carriers.[25] Recent work by Wang et al. using N and P-type silicon indicates that either electrons or holes can serve as the charge carriers during contact charging.[13] Xu et al. have recently proposed a contact charging model based on thermionic emission of electrons.[23] The centrality of excited electrons in contact charging may be traced back to Frenkel.[26] Unfortunately, perhaps because of an arithmetic error in the article, his insightful work has been largely ignored.[27]
We have proposed that geometry-dependent differences in de-excitation paths for excited electrons are symmetry breaking and lead to different excited electron concentrations and hence to different Fermi energies, which in turn enable contact charging of chemically identical solids.[28, 29] Here we use this geometric-access model together with a quasi-equilibrium description of the Fermi energy to describe contact charge transfer. We examine the factors determining the direction of charge transfer, estimate the particle size range over which charging can occur, and calculate a lower bound on the charging of pairs of particles of different size. We calculate the charge distribution in groups of interacting particles and examine the effect of particle size distribution on the asymmetry of the charge distribution. The calculated charging is compared to existing data, the breakdown limits of air, and interparticle gravitational forces. The use of the quasi-equilibrium relation between excited electron concentrations and Fermi energies extends the understanding of contact charging of chemically identical materials to contact charging of unlike materials, which is known to arise from differences in Fermi energies.
2 Equilibrium Criterion
2.1 Electrochemical Potential of Electrons
We consider situations in which excitation of electrons by absorption of photons or from thermal spikes results in a concentration, n*, of electrons in higher energy conductive states that is greater than the concentration, n, at thermal equilibrium. The excited state can be a conduction band or an impurity band.
The quasi-Fermi energy approximation is based on the assumption that thermalization of excited electrons within the conduction band is very rapid compared to interband de-excitation. If this condition is met, the excited electrons are distributed thermally in the electronic states at the bottom of the conduction band. Therefore, the thermodynamic potential for charge transfer between particles is minimized, and the resulting predictions give a lower bound on the amount of charge transfer.
Important caveats: If the above conditions are not met, for example, under extreme radiation intensities, the quasi-Fermi energy approximation cannot be used. Also, the separation of the electrochemical potential into purely electrical and concentration terms cannot be done exactly. Equation (3) must be seen as a semi-empirical approximation. Since nc contains only physical constants and the effective mass, m*, of the charge carriers, it is the same in two chemically identical solids with the same crystal structure. Similarly, is the same in identical solids.
Thermodynamic stability arguments require that the chemical potential is a monotonically increasing function of concentration, n*. Therefore, the difference in excited electron concentrations, , can serve as the criterion for direction of charge transfer rather than difference in electrochemical potentials.
2.2 Phase and Electrostatic Equilibrium
3 Modeling of Electron Excitation, Diffusion, and De-Excitation
3.1 Electron Excitation/De-Excitation
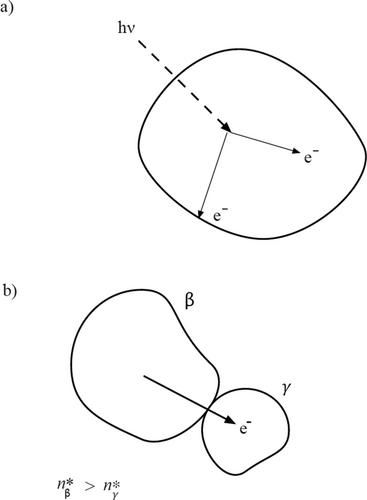
Consider a dielectric solid exposed to ultraviolet radiation, shown schematically in Figure 1a. Electrons excited into a conductive state by ultraviolet photons can migrate to a bulk or to a surface de-excitation site. The local steady-state concentration of excited electrons, n*, will be determined by the radiation intensity, I0, absorption coefficient, α, the electron diffusion coefficient, D, the kinetic coefficients, h and k, for bulk and surface de-excitation, and the geometric access to the de-excitation sites, which depends on the size and shape of the object. In the most commonly encountered parameter ranges, smaller particles have a lower concentration of excited electrons because of the greater relative importance of surface over bulk de-excitation in smaller particles. Less commonly, relatively large diffusion rates can counter this behavior.
The bulk de-excitation coefficient, h(s−1), is the reciprocal of the charge carrier lifetime, τ, in the bulk; the surface de-excitation coefficient, k (m s−1), is reported as a surface recombination velocity. Values of h and k are typically not known for the solids of interest here, but there are many reported values for related systems from which estimates may be made.
3.2 Diffusion and De-Excitation
The results presented here are for crystalline dielectric solids with a well-defined band structure; organic polymers with different conductivity mechanisms are not covered. We have previously presented extensive results of steady-state numerical solutions of Equation (7), neglecting the electrical field term, with the boundary condition that the diffusive flux to the surface matches the surface de-excitation rate.[28] We have also presented results that included the effects of the internal electric field.[29] The latter results showed that the electric field changed the excited electron concentration by only small amounts in the parameter ranges considered here, and more generally that the predicted direction of the charge transfer does not change if the internal electric field is neglected. In Figure 2, we present several examples of solutions of Equation (7), obtained using Mathematica, which illustrate many of the important characteristics of the excitation/diffusion/de-excitation process. We previously presented a more extensive set of these solutions,[28] where we displayed results in nondimensional parameters. The current curves for values of k/h become curves for kα/h. This latter parameter is the limit of the ratio of surface to bulk de-excitation at large R, as the concentration reaches its asymptotic value. This behavior occurs where the bulk de-excitation is restricted to a narrow region and is discussed in Section 3.4.
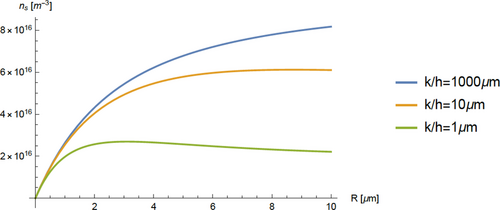
The slope of the n* versus R curve is positive over most of the expected parameter range, and the predicted electron transfer will be from large to small particles. In Figure 2, the limiting slopes at R = 0 are the same for fixed k and all values of h. For large R and k/h, the excited electron concentration, n*, approaches an asymptotic value that decreases with increasing h. For sufficiently large h, the concentration reaches a maximum at some R; see the lowest curve in Figure 2. In the region where n* decreases with R, electron transfer is from small to large particles, opposite to the commonly observed behavior.
3.3 Constant Excited Electron Concentration
3.4 Direction of Charge Transfer
The direction of interparticle charge transfer is always determined by the relative values of electron electrochemical potential (Fermi energy) in the two particles as outlined in Section 2. In the great majority of cases, the observed direction of transfer is from large particles to small particles, which is consistent with the predicted results over most parameter ranges. In this section, we examine the factors that can lead to model predictions of electron transfer in the opposite direction, i.e., from small to large particles.
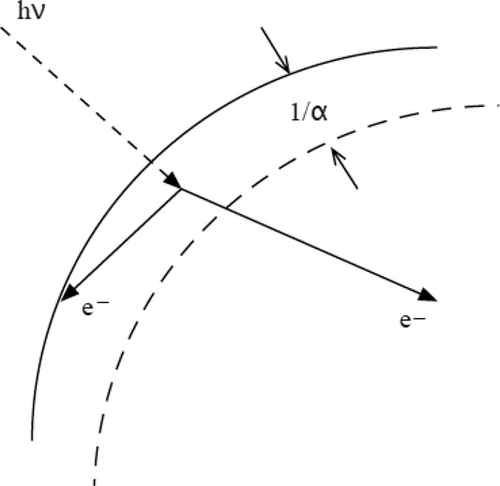
Charge motion in this direction has been reported by Mehrani et al.[15] for glass beads. However, because of the ubiquity of experimental reports of charging in which small particles become negative and large particles positive, the combination of properties that would lead to k/Dα << 1 appears to be rare. We note that this inequality would be most easily met with treated, high-quality solids that have small k and large D.
3.5 Parameter Values and Charge Carrier Concentration
A range of values of h, k, α, D, and g and the dimensionless parameters αR and (k/h)(3/R) for a nominal particle radius of ten microns are given in Table 1. The values shown in Table 1 were taken from reported data on silica, SiO2, and TiO2.[33] The data in the upper row show the approximate range of parameters for solid oxide phases. The values of h and k in the bottom row of Table 1 are normally only found in treated solids of high crystalline quality and low defect density.
| h [s−1] | k [m s−1] | α [m−1] | D [m2 s−1] | (k/h)(3/R)a) | αRa) | g = I0α [m−3 s−1]b) |
|---|---|---|---|---|---|---|
| 106−109 | 102−105 | 103−109 | 10−2−10−7 | 30 | 10−2−104 | 1022−1028 |
| 103 | 0.1 | 103 | 0.1 | 30 | 10−2 | 1022 |
- a) R = 10−5 m
- b) I0 ≈ 1019 m−2 s−1, the approximate solar photon flux at energies above 4 eV on the earth's surface.
Bulk and surface de-excitation are independent processes with rate coefficients, h and k, that reflect physical and chemical differences between the bulk and surface de-excitation sites. However, empirically both h and k will be larger in imperfect solids with high defect densities; the ratio h/k will vary less than the individual h and k values.
The absorption coefficient, α, depends strongly on the nature of the particular solid, and whether it has a direct or indirect band gap; indirect gaps lead to much lower absorption than direct gaps.
The model described here does not rely on surface donors; however, it does require electrons in bulk states where they are mobile and can provide conductivity. In particle clouds, excitation can occur from solar ultraviolet photons or, in principle, from thermal excitation arising from particle/particle collisions. In laboratory settings, the ambient level of ultraviolet light is often not controlled; it may be set by fluorescent lighting. Whether or not there is sufficient excitation to provide conductivity must be assessed for each particular situation.
We estimate the concentration of excited electrons, n*, from solar photons in one example situation: a 10−6 m radius spherical particle with α = 105 m, k = 102 m s−1, and h = 106 s. We assume a silica-based solid with a band gap of 4 eV. The solar photon flux, Io, at energies above 4 eV at the earth's surface is ≈1019 m−2 s−1. Assuming all absorbed photons lead to electron excitation, the relationship between the excitation rate, g(r); the intensity of radiation, I(r); and the absorption coefficient, α, is g(r) ≈ αI(r). Therefore, the excitation rate is g = αI ≈ 1024 m−3 s−1. Since αR = 0.10, Equation (10) is appropriate. For a particle of 1 µm radius and k/h = 10−4, Equation (10) gives (h/αI)n* ≈ 0.003. This leads to a value of n* ≈ 3 × 10¹⁵ m−3. For comparison, the concentration of mobile electrons in intrinsic silicon is ≈1016 m−3.
Equations (10) and (11) show that n* varies approximately linearly with particle size when the conditions αR < 1 and R < 3(k/h) are met. Measured values show that the k/h ratio often falls between 10−5 to 10−3 m, which means charging may occur in particle pairs with radii less than these values if αR < 1. Also from Equation (10), particle pairs with R >> 3(k/h) are predicted to show little charging. These broad ranges are consistent with experimental observations from many sources.
Interstellar dust in the form of silicates, graphite, or polyaromatic hydrocarbons (PAH) can range in size down to near molecular dimensions.[33] The low particle size tail of clouds of terrestrial sand particles has been reported to extend from 1 nm to 10 µm.[34-36] Therefore, in many situations, particles will be in a regime where the concentration of excited electrons varies with particle size as described by Equation (11).
4 Quasi-Equilibrium Charge Transfer
4.1 Quasi-Equilibrium Charge Transfer: Particle Pairs
Consider a pair of particles of identical composition and crystal structure, but different size that are continuously excited by ultraviolet radiation. Each particle develops a steady-state concentration, n*, of excited electrons. If the particles come in contact, electrons transfer from the particle with higher μe to the particle with lower μe, i.e., from higher n* to lower n* (see Figure 1b). We assume that the radiation field maintains the values of n* in both particles after contact as described by Equation (11). In subsequent contacts, charge transfer and the build-up of an electrical potential difference between the particles can occur until , at which point charge transfer ceases and a steady-state distribution of charge on the two particles has developed.
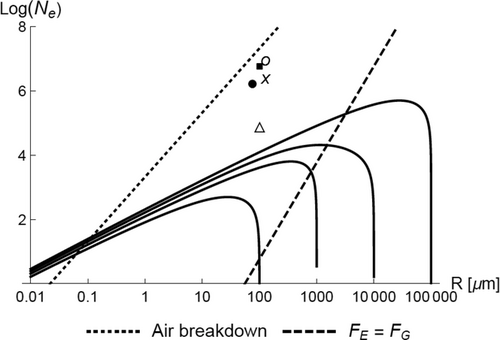
The quasi-equilibrium relation, Equation (4), was used with Equations (5), (6), and (11) to compute the number of electrons, Ne, transferred between a particle of radius, R, with a series of larger particles. The resulting curves are shown in Figure 4.
4.2 Other Comparisons: Data Points, Air Breakdown, and Gravity
The experimental values of Ne reported in Figure 4 are significantly greater than the model predictions. The computed curves in Figure 4 are for charging of particle pairs. In Section 4.3, we show that in groups of interacting particles, the distribution of charge can be highly nonuniform; larger particles can become much more highly charged than smaller particles. Also, as noted in Section 2.1, the quasi-equilibrium Fermi energy approximation gives a lower bound on the magnitude of charge transfer. Kinetic modeling, rather than a quasi-equilibrium model, will give a more accurate description of the process (see Sections 4.4 and 5.2).
The small dashed line on Figure 4 shows the points where the electric field given by Equation (5) is equal to the breakdown field for air (≈3 × 10⁶ V m–1). At small R, the predicted field strengths from the model are high enough to give breakdown of air.
The large dashed line on Figure 4 indicates the points where the electrostatic repulsive force, FE, between equal size particles with the same charge is equal to their mutual gravitational attractive force, FG. This calculation, inspired by the calculation by Gamow[42] of the relative strengths of electrostatic and gravitational forces of isolated protons, illustrates the great disparity of electrostatic and gravitational forces. For example, in the limiting case of two equal size particles, each charged with only a single electron, the electrostatic repulsive force is equal to the gravitational attractive force for particles with a 90 µm radius. The model predictions in Figure 4 show a wide range of values of Ne and R to the left and above the FE = FG line, which correspond to conditions where FE > FG. These results indicate that the charging mechanism described here may provide electrostatic forces large enough to influence the motion and agglomeration of dust particles.[43-47]
4.3 Quasi-Equilibrium Charge Distribution in a Particle Cloud
In a cloud of interacting particles charge transfer between particles will take place until for all pairs of particles. At that point, a steady-state distribution of charge over the particles has developed. For a cloud of NP interacting particles, we use Equation (11) with Equations (4)–(6). The resulting 2NP equations were solved numerically for the 2NP variables Qi and ϕi. We note that Equation (5) implies that the particles are sufficiently separated in the final spatial configuration that the potential of a particle is independent of the charges on the other particles. The results are therefore a limiting case of more relevance to dilute particle clouds than to packings of particles.
Because we directly calculate the quasi-equilibrium charge distribution, it is not necessary to make assumptions about some of the kinetic parameters, e.g., collisional contact area, contact time, and the local surface concentrations of donor/acceptor sites.[48] However, we emphasize that the charge distributions described here depend on having sufficient excitation (photonic or thermal) of charge carriers into an excited state where they are mobile. The results do not apply to non-conductive polymeric systems.[22]
In Figure 5a, we show the steady-state charge distribution in an interacting group of 11 particles with sizes ranging from 5 µm through 15 µm with adjacent sizes differing by 1 µm. In Figure 6, we show the calculated charges in a group of ten interacting particles with a wide size range from 0.1 to 512 µm with adjacent sizes differing by a factor of two.
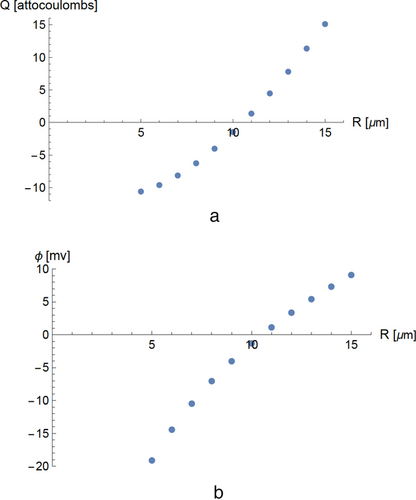
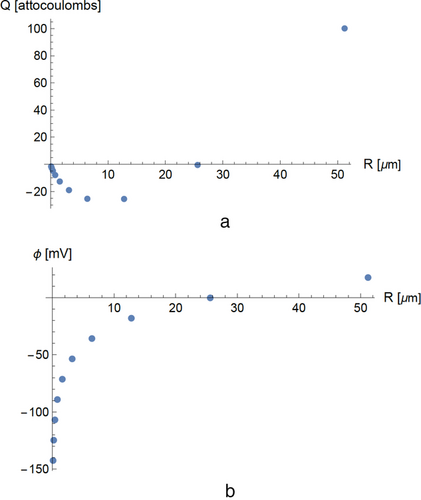
The calculated distribution of charge over the particles is uneven. In the particle group described in Figure 6, the positive charge occurs entirely in the largest particle; the negative charge is distributed over the smaller particles. For very wide and nonuniform particle size distributions, the difference in charging of the smallest and largest particles can be extreme. We note that charge effects of this kind could provide positive feedback if present during particle agglomeration: large positively charged particle attracts small negative particles and becomes larger, the larger particle becomes still more positive.
4.4 Other Descriptions of Charge Transfer
The quasi-equilibrium description of the Fermi energy embodied in Equations (3) and (4) permits estimation of the magnitude of charge transfer without knowledge of the kinetic coefficients for interparticle charge transfer. However, by its nature, the quasi-Fermi energy approximation gives a lower bound on the amount of charge transfer. Nonequilibrium, kinetic descriptions can give a more accurate description. A simple nonequilibrium model is to assume that the flux of excited electrons within and between particles is described by the diffusion equation, Equation (7). A steady state will be achieved when the interparticle electron diffusion flux between every particle pair is balanced by the reverse electron drift flux arising from the electrical field. In principle, for a system of NP particles, there are NP – 1 constraints from Equation (7) that can replace Equation (4) and used with Equations (5) and (6) to calculate the steady-state charge distribution. Depending on the details of the modeling, nonequilibrium methods require estimates of kinetic parameters, e.g., collisional contact area, collision duration, electron diffusion coefficient, and surface barriers.
Explanations of interparticle charge transfer often assume that the rate of transfer is proportional to the number of electrons in high-energy surface states[19, 21, 23, 48] rather than their concentration. Electron transfer between of particles of different size arises directly from this assumption. If electrons are the charge carriers, in all cases, small particles will become negative and large particles positive; reversal of direction would not occur under this mechanism. In one situation, it has been reported that there were insufficient electrons in surface states to provide the observed charge transfer.[37] Also, these models predict that two particles of different size, but with the same Fermi energies, would spontaneously exchange charge.
Very far from equilibrium, there may be regimes of “ballistic transport” of highly excited electrons that follow neither the quasi-equilibrium description (Equation (4)) nor the classic diffusion law (Equation (7)). These conditions might be found in environments of extremely high-energy photon flux or in particles undergoing high velocity collisions. They could in principle provide regimes where transport rates are proportional to the number of charge carriers rather than their concentration.
5 Summary and Conclusions
5.1 Summary
We propose that differences in geometric access to surface and bulk de-excitation sites give rise to differences in excited electron concentrations in otherwise identical solids. The difference in access arising from differences in size or surface morphology is a symmetry-breaking difference that permits spontaneous contact charge transfer between chemically identical solids and gives a potential solution to a two-century old unexplained phenomenon. This basic mechanism was used with a quasi-equilibrium description of Fermi energies to predict the steady state charge distribution and potential differences between pairs of particles and in interacting groups of particles. Predicted transfer directions and the broad particle size range over which charging is observed agree with experimental observations.
The proposed geometric-access model is based on well-understood optical and electronic processes, i.e., photonic or thermal excitation of electrons to conduction or impurity bands; diffusive transport of electrons; and de-excitation of electrons at bulk and surface sites by independent processes with different kinetic coefficients. The quasi-Fermi energy approach serves to unify the understanding of charge transfer between like solids and that between unlike solids, the latter of which has long been understood to be determined by differences in Fermi energies.
5.2 Confirmation of Model
There is a large discrepancy in Figure 4 between the measured and estimated magnitudes of charge transfer between particle pairs. Some of this difference may arise from charging asymmetry arising in particle clouds that was noted in Section 4.3. Also, the quasi-Fermi energy description gives a lower bound on the magnitude of charge transfer. Nonequilibrium methods can give a more accurate description of the charge transfer as suggested in Section 4.4. However, confirmation of the predictions of charging magnitude will only be possible when spectroscopic and charge carrier lifetime data become available for the systems of interest.
Controlled experiments under conditions where the geometric-access model predicts charge carrier transfer in the “reverse direction,” i.e., from small (or rough) samples to large (smooth) samples, would be particularly instructive, and could serve to distinguish the model from mechanisms based on the number of surface state donors. Silicon or gallium arsenide wafers with high charge carrier mobilities and low surface recombination velocities could provide the range of parameters required for this direction of charge transfer.
5.3 Relevance of Proposed Mechanism
The geometric-access mechanism described here may take place during industrial processing of fine particles, in clouds of terrestrial or planetary sand particles, and in certain interstellar dust clouds, wherever there is sufficient excitation to provide conductivity. The mechanism provides particles of both signs, which has been suggested to be of importance in enhancing the rate of particle agglomeration.[49-51] We note that the distribution of charge in groups of interacting particles can be highly nonuniform with excess charge of one sign concentrated in the largest particles. This effect can, in principle, lead to instabilities that influence particle agglomeration.
Finally, we emphasize that other charging processes, e.g., exposure to electron or ion fluxes, secondary emission and photoemission,[39] or charge transfer by ions,[25] can operate in parallel with the mechanism described here. The relative significance of the geometric-access model will depend on the radiation environment, the fluid mechanical regime, the humidity, and the optical and electrical properties of the particles. In addition, in polymeric systems other types of interparticle charge transfer may be present.[7, 22]
Acknowledgements
The authors acknowledge insights provided by Prof. Kathleen Kash, Prof. Dan Lacks, Prof. Mohan Sankaran, and Dr. Andrew Wang.
Conflict of Interest
The authors declare no conflict of interest.


