Punctate White Matter Abnormality in Moderate-to-Late Preterm Infants
Abstract
Objective
Moderate-to-late preterm (MLP) infants contribute to the greatest proportion of preterm children with neurodevelopmental impairments. White matter injury (WMI) is common and predicts adverse outcomes in very preterm (VP) infants. However, little is known about white matter abnormality (WMA) in MLP infants. We investigated the burden and distribution of WMA in MLP infants.
Methods
MLP infants were recruited from a randomized trial on neonatal nutrition and a prospective observational cohort in New Zealand, and underwent brain magnetic resonance imaging (MRI) soon after birth and at term-equivalent age (TEA). WMA was manually segmented using an established method. Total and regional WMA volumes and percentage of WMA to total cerebral volume were calculated. Probabilistic WMA maps were generated and compared with WMI in VP infants and term infants with congenital heart disease.
Results
Of 101 infants (32 females), 40 (39.6%) had WMA on at least 1 scan. In 37 infants with WMA who had both scans, WMA was less visible in 22 (59.5%) or undetectable in 7 (18.9%) infants with a mean reduction of 72.7 ± 207.5 mm3 in WMA volume from early-life to term. Infants with and without WMA had mostly comparable pregnancy and neonatal characteristics. Probabilistic maps demonstrated a characteristic WMA topology, with most lesions in posterior followed by central and anterior regions. Trigonal areas were vulnerable across neonatal populations.
Interpretation
WMA is much more common in MLP infants than previously reported and occurs in a characteristic topology. WMA may be missed on TEA MRI, and its relationship with outcomes in MLP infants warrants attention. ANN NEUROL 2025;98:329–340
Thirteen million babies were born preterm (ie, <37 weeks' gestation) globally in 2020.1 Over 80% of all preterm births occur in the moderate-to-late preterm (MLP) period (32–36 weeks' gestation).1 Survival rates for MLP infants are excellent, but MLP children are at significantly increased risk for adverse neurodevelopmental outcomes, learning and behavioral spectrum disorders, as well as mental health problems.2-7 MLP children are 36% and 50% more likely to experience developmental delay and have special education needs, respectively, than their term-born peers.8 MLP infants are the highest contributors to the healthcare burden related to preterm birth.9, 10
Despite their global impact because of neurodevelopmental impairment, MLP infants have been less well studied compared with very preterm (VP) infants (<32 weeks' gestation), and the reasons underlying their neurodevelopmental deficits are not known. The final weeks of pregnancy are a critical time of rapid brain development, with a 22mL weekly increase of total brain tissue.11 Neuronal proliferation, axonal growth, oligodendrocyte maturation, and synaptogenesis taking place in these weeks result in a dramatic increase in both cerebral volume and neuronal connectivity.12 During this time, infants born MLP are removed from placental oxygen, nutrients and growth factors, and exposed to many clinical and environmental stimuli that potentially impact susceptibility of the immature brain to injury.
Punctate white matter injury (WMI), best visualized on early-life T1-weighted MRI images as areas of abnormal hyper-intensity with or without T2-hypointensity, is the characteristic brain injury in VP infants.13, 14 In children born VP, greater lesion volume and anteriorly located WMI were more likely to be associated with adverse early childhood outcome, whereas mild lesion burden and posteriorly located WMI were less concerning.15, 16 Furthermore, term infants with congenital heart disease (CHD) share similar vulnerability to WMI as VP infants,17 consistent with impaired in utero brain development.18 Although diffuse microscopic WMI were associated with brain dysmaturation, they are not readily detectable by commonly used magnetic resonance imaging (MRI) techniques, and therefore, beyond the scope of this study.19, 20
Brain imaging of MLP populations has only been reported in a limited number of studies undertaken at term-equivalent age (TEA) or later.21-27 WM abnormality (WMA) identified on TEA or later MRI had been reported in 0.5 to 16% of MLP infants in studies before 2022.25, 28 However, in MLP infants, early-life MRI scans before TEA have not been routinely performed,28, 29 and the prevalence and spatial distribution of WMA is unknown. Here, we characterized WMA in MLP infants by quantitatively assessing the burden and spatial distribution of punctate WMA observed on early-life and TEA MRI scans and their clinical correlates. In addition, we compared volume and topology of WMA in MLP infants relative to WMI in VP infants13, 30 and term infants with CHD.17
Punctate areas of T1-hyperintensity in VP infants were inferred to represent WMI given experimental observations in a sheep model of hypoxia-ischemia, where lesions corresponding to areas of necrosis,31 and their extent are associated with neurodevelopmental impairments.13, 15, 20 As no precise histopathological correlates have yet been demonstrated in MLP infants, we refer to them in MLP infants as WMA.
Methods
Participants
Infants were born 32+0 and 36+6 weeks' gestation at Auckland City, Middlemore, and North Shore Hospitals, Auckland, New Zealand between March 2019 and August 2021. Infants were either participating in a prospective observational study exploring early brain development—the Moderate-to-late Preterm Infants Early Brain Development (MoPED) study, or in a factorial randomized trial addressing questions about how to improve nutrition in MLP infants—the Different Approaches to Moderate and Late Preterm Nutrition: determinants of feed tolerance, body composition and development (DIAMOND) trial, ACTRN12616001199404.32 Because the conditions in the DIAMOND trial reflect usual feeding practices and none could be considered a control or an intervention arm, we considered infants recruited to both studies as a single prospective cohort.
All infants underwent early-life brain MRI as soon as they were clinically stable and scans were logistically feasible after birth, and again at TEA. Detailed clinical information about antenatal, perinatal and postnatal factors was collected from medical records.
Standard Protocol Approvals, Registrations, and Patient Consents
Ethics approval was granted by the Southern Health and Disability Ethics Committee (20/STH/85) and the Northern A Health and Disability Ethics Committee (16/NTA/90/AM05). Parents gave written informed consent.
Image Acquisition
MRI was performed without sedation on a MAGNETOM Skyra 3 T MRI scanner (Siemens Healthcare, Erlangen, Germany), at the Centre for Advanced MRI (CAMRI) using a 16-channel shoulder flex coil or a 32-channel head coil. The shoulder flex coil was used in the first 34 datasets acquired (n = 20 infants) until a head coil compatible incubator was available for the rest of the study. We acquired a 3-dimensional (3D) T1-weighted image (repetition time [TR]/echo time [TE] = 6.0/2.6ms; 9° flip angle; field of view [FOV] = 192mm; voxel size = 1.0 × 1.0 × 1.0mm3), a 3D T2-weighted variable flip angle SPACE image (TR/TE = 3200/571ms; FOV = 192mm; voxel size = 1.0 × 1.0 × 1.0mm3), a 2D T2-weighted turbo spin echo (TR/TE = 3650/140ms; 120° flip angle; FOV = 128mm; voxel size = 0.4 × 0.4 × 3.0mm3) and susceptibility-weighted images (SWI) (TR/TE = 28/20ms; 15° flip angle; FOV = 128mm; voxel size = 0.7 × 0.7 × 1.0mm3]. Comparable image quality was achieved with both coils. The same coil was used to acquire both early-life and TEA scans for the same baby to maintain within subject consistency.
Neuroradiological Review
All scans were reviewed by an experienced pediatric neuroradiologist (D.P.) without knowledge of the clinical history, using a scoring system chosen for ease of use, high reliability, and clinical applicability as described in Miller et al.33 Punctate WMA was characterized as areas of T1-hyperintensity and/or T2-hypointensity, and classified according to number, size, and location of the lesions as none, minimal (≤3 areas measuring <2mm), moderate (>3 areas or measuring >2mm but <5% hemisphere), or severe (>3 areas with 5% hemisphere involved).15, 33 Detailed summaries of the findings on both early-life and TEA scans were provided.
Quantitative Assessment and Lesion Mapping of Punctate WMI
Using methods established in VP infants and applied to full-term infants with CHD,13, 17 WMA was manually segmented on the T1-weighted MRI.34 Tricubic interpolation enabled consistent differentiation of WMI from surrounding tissue and only voxels that contained over 50% WMA were considered. A trained researcher (T.G.) manually segmented the images, which were then reviewed by an experienced neonatal neurologist (S.P.M.). The final WMA segmentation was determined when a consensus was obtained. Total WMI volume, WMA volume by brain lobe, and the percentage of WMA volume to total brain volume (TCV) were calculated. TCV was obtained using a semi-automatic method reported previously.35, 36
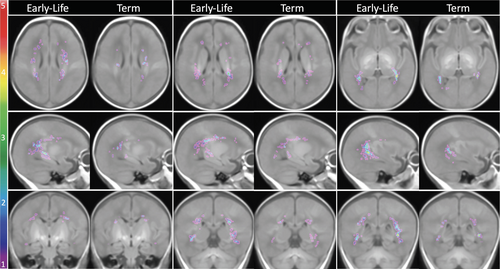
Each participant's T1-weighted image was non-linearly registered to a neonatal brain template and the WMA segmentation was mapped to the template using the resultant transformation matrix to generate probabilistic WMA maps.13 Three WMA maps were generated with the WMA identified in 36 infants at early-life, in 31 infants at TEA, and the maximum WMA at either early-life or TEA in 40 infants. The early-life and TEA WMA maps allowed direct visualization and comparison of the spatial distribution patterns of WMA at the 2 timepoints.
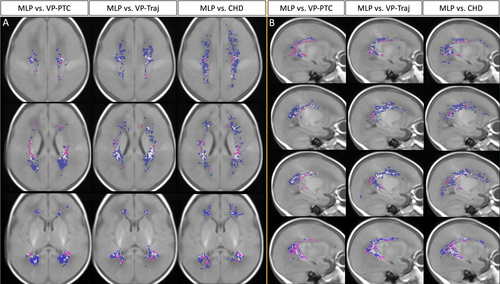
Furthermore, WMA volumes and location in MLP infants were compared with WMI in other neonatal populations. Because WMI is a well-recognized brain injury pattern in VP infants12, 14, 19, 20, 30 and term infants with CHD,17, 18, 37, 38 and the total lesion volume and spatial location of WMI were associated with neurodevelopmental outcomes,17, 18 the comparison across these neonatal populations may provide insights in the pathophysiology and clinical significance of WMA in MLP infants. In this study, the maximum WMA volumes of 40 MLP infants were compared with WMI of VP infants at early-life from 2 cohorts: preterm care (VP-PTC) cohort30 and trajectories (VP-Traj) cohort,13 and the maximum WMI of term infants with CHD.17 Although there were differences in MRI scanners and parameters across cohorts (details reported previously13, 17, 30), the same protocol was used to assess WMI/WMA for all cohorts. Because sex, gestational age (GA) at birth, and post-menstrual age (PMA) at MRI vary in infants with WMI from VP-PTC (63% male; GA at birth: 28.3 [26.3–29.9] weeks; PMA at MRI: 32.6 [31.6–34.3] weeks), VP-Traj (46% male; GA at birth: 28.6 [26.2–29.9] weeks; PMA at MRI: 31.9 [30.6–32.8] weeks), and CHD (66% male; GA at birth: 39.0 [38.0–40.0] weeks; PMA at MRI: 40.6 [39.7–42.1] weeks), they were adjusted in the analysis. Maternal education can serve as a reliable socioeconomic status (SES) proxy.39 Therefore, we categorized maternal education data as level 1: college and below and level 2: university and above, and compared the differences in maternal education levels across the cohorts. Three cross-population WMI/WMA comparison maps were generated to show the spatial distribution similarities and differences between these cohorts. The lesions/abnormalities that are unique to each population and those that are common were given different colors to allow intuitive comparison.
Statistical Analysis
Infants with brain injuries or abnormalities (eg, conatal cyst) other than WMA that were not deemed to be of clinical significance by the neuroradiologist (D.P.) and neonatal neurologist (S.P.M.) were included in the group without WMA, and the influence of these on the study findings tested by excluding them in sensitivity analyses. Findings are reported as n (%), median (interquartile range [IQR]) or mean (standard deviation [SD]). Between group comparisons of clinical variables were made using Kruskal-Wallis tests for continuous data, and chi-square or Fishers exact tests for categorical data. p < 0.05 Was considered significant. The associations between total WMA volume and variables with p < 0.10 in the group comparison analyses were examined using generalized linear models, adjusted for GA at birth and type of coil. All analyses were conducted using R (Version 4.4.2) and R Studio (Version 2024.12.0 + 467).
Results
Clinical characteristics of study participants
A total of 101 infants (69 male, 32 female) were included in this study, of whom 98 underwent MRI scans soon after birth; 84 of the 98 infants returned for a second MRI scan at TEA and 3 infants underwent MRI scan at TEA only. The early-life scans took place at a median of 10 (IQR: 6.3–13.8) days after birth at a median PMA of 35.6 (IQR: 34.7–36.1) weeks. The second scans at TEA were obtained a median of 43 (IQR: 38–49) days after birth at a median PMA of 40.3 (IQR: 39.4–40.9) weeks. WMA was observed in 40 of 101 (39.6%) infants; 36 of 98 (36.7%) on early-life MRI, 31 of 87 (35.6%) at TEA, and 37 of 84 (44%) of infants who underwent both scans. WMA with a hemorrhagic component was only identified in 2 of 40 infants with WMA.
Ten infants with WMA had co-occurring abnormalities: mild prominence of the lateral ventricles in 7 infants (1 bilateral, 6 unilateral) and grade 1 intraventricular hemorrhage in 4 infants (1 of whom also had mild prominence of left lateral ventricle). Among the infants with no WMA, 4 had mild prominence of lateral ventricles unilaterally, 1 participant had cavum vergae, 8 had intraventricular hemorrhage (5 with grade 1 and 3 grade 2, of whom 2 also had very small cerebellar hemorrhages, and 1 had bilateral parafrontal conatal cysts). One participant had periventricular hemorrhagic infarction and a short corpus callosum with down-sloping morphology and was excluded from the analyses given the suspicion of an underlying genetic condition. Therefore, there were 100 infants included in the comparison of clinical characteristics between infants with (n = 39) and without (n = 61) WMA.
Most pregnancy and neonatal (Table S1) characteristics were comparable between infants with and without WMA. However, those with WMA had a higher rate of fetal distress on cardiotocography (CTG) (p < 0.05). The number of infants with Apgar scores <8 at 5 minutes was slightly higher (p = 0.06) and placental weight was slightly heavier in infants with WMA (p = 0.09), but neither difference was statistically significant. Rates of maternal medication use during pregnancy, including routine supplements, were similar between groups and caesarean section (either elective or emergency) was the most common mode of delivery. There was a high rate of anti-hypertensive medication use in the cohort (18.8%), but only 6 mothers were admitted to hospital for gestational hypertension. Most infants (92.1%) were admitted to the neonatal intensive care unit (NICU). More than two-thirds of infants received some respiratory support at birth, but only 2 infants were intubated and 1 received drugs as part of the resuscitation. Only 1 infant without WMA and 2 infants with WMA had early onset sepsis, and 1 infant without WMA had late onset sepsis. Two infants with WMA underwent neonatal surgery. No infants had postnatal hypotension, necrotizing enterocolitis, or neonatal encephalopathy. Although two-thirds of the cohort were boys, there were no statistically significant differences in most of clinical and neonatal factors between boys and girls (Table S2a,b).
Quantitative Assessment of WMA: Volumes, Percentage, and Location
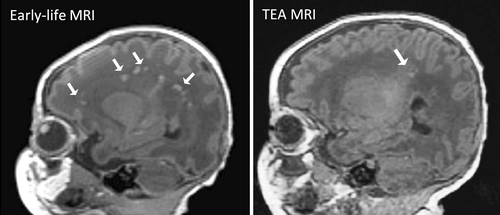
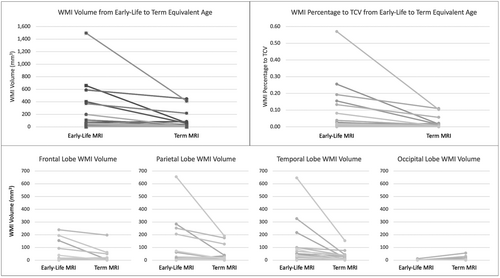
The 1 infant with periventricular hemorrhagic infarction who was excluded from the comparison of clinical characteristics was included in the quantitative assessment of WMA. Among the 40 infants who had any WMA, 37 had both early-life and TEA scans, 1 infant had a TEA scan only, and 2 infants had early-life scans only. The volume of WMA ranged from 0 to 1495mm3. WMA was moderate in all 3 cases where only an early-life or a TEA scan was available. Based on clinical scoring of infants with WMA at either timepoint who had both scans (n = 37), the severity of WMA on early-life MRI was minimal in 16 (43.2%), moderate in 15 (40.5%), and severe in 3 (8.1%) (Table 1). WMA was undetectable in 7 of 37 (18.9%) or less visible, that is, less T1 hypointense on the TEA scan in 22 of 37 (59.5%) infants (see Fig 1 for an example). All of the infants with undetectable WMA at TEA had minimal WMA (≤3 areas measuring <2mm) at early scan. The total WMA volume identified on the TEA scans was less than that on the early scans (mean difference −72.7 ± 207.5mm3, p = 0.025). The percentage of WMA to TCV at TEA was also significantly less than that at early-life (mean difference −0.033 ± 0.088, p < 0.001) (Table 1). WMA volumes in the parietal lobe and temporal lobe were greater than those in frontal and occipital lobes. Total WMA volume in frontal, parietal, and temporal lobes for most of the 37 infants with both scans were reduced from early-life to TEA. Eleven of 37 infants had some WMA in the occipital lobe, 5 infants on early-life MRI (range: 1–4mm3), 10 on TEA MRI (range: 1–30mm3), and 1 on both (early-life: 12mm3; TEA: 56mm3). Interestingly, 8 of these 11 infants had slightly increased WMA in occipital lobe from early-life to TEA (range: 1–44mm3), although this increase was minimal (Fig 2). In these 8 infants, the total WMA volume at TEA (p = 0.022), percentage of WMA to TCV at TEA (p = 0.026), and WMA volume in occipital lobe at TEA (p < 0.001) were greater than those in 29 infants without increased occipital lobe WMA. These measurements were not statistically significantly different on early scan. The total WMA volume from early-life to TEA decreased in both groups (Table S3).
| Early-life MRI | Term-equivalent age MRI | |
|---|---|---|
| Scans complete, n | 37 | 37 |
| Post-menstrual age at MRI, wk, median [IQR] | 35.6 [34.7–36] | 39.9 [39.4–40.7] |
| WMA identified, n (%) | 35 (94.6) | 30 (81.1) |
| Severity of WMAa, n (%) | ||
| None | 3 (8.1) | 7 (18.9) |
| Minimal | 16 (43.2) | 17 (45.9) |
| Moderate | 15 (40.5) | 12 (32.4) |
| Severe | 3 (8.1) | 1 (2.7) |
| Total and lobar WMA volume | ||
| Total WMA volume, mm3, median [IQR] | 17.0 [6.0–61.0] | 12.0 [5.0–36.0] |
| Mean ± SD | 119.5 ± 282.1 | 46.8 ± 100.9 |
| WMA %TCV, Median [IQR] | 0.007 [0.002–0.021] | 0.003 [0.001–0.010] |
| Mean ± SD | 0.044 ± 0.106 | 0.012 ± 0.025 |
| Frontal lobe WMA volume, mm3, median [IQR] | 1.5 [0–12.0] | 0 [0–4.8] |
| Mean ± SD | 24.1 ± 57.7 | 12.8 ± 37.7 |
| Parietal lobe WMA volume, mm3, median [IQR] | 5.5 [0–16.5] | 5.5 [0–13.0] |
| Mean ± SD | 49.3 ± 128.3 | 23.1 ± 49.7 |
| Occipital lobe WMA volume, mm3, median [IQR] | 0 [0–0] | 0 [0–1.0] |
| Mean ± SD | 0.6 ± 2.2 | 4.1 ± 11.7 |
| Temporal lobe WMA volume, mm3, median [IQR] | 6.5 [2.3–44.5] | 5. 0 [0.3–26.5] |
| Mean ± SD | 55.9 ± 124.1 | 17.7 ± 31.2 |
- Data are presented as n (%) or median [IQR] and mean ± SD. Two infants with WMA who had early scans only, and 1 infant with WMA who had term-equivalent scan only are not included in this table.
- a Minimal, ≤3 areas measuring <2mm; moderate, >3 areas measuring >2mm but <5% hemisphere; severe, >3 areas with 5% hemisphere involved; % IQR = interquartile range; MRI = magnetic resonance imaging; SD = standard deviation; TCV = as a percentage of total cerebral volume;WMA = white matter abnormality.
WMA Volume and Percentage were not Related to Clinical Factors
Neither WMA volume nor the percentage of WMA to TCV was associated with GA at birth (Spearman correlations: volume rho = −0.06, p = 0.54, percentage rho = −0.08, p = 0.45 at early-life MRI; volume rho = 0.02, p = 0.84, percentage rho = 0.01, p = 0.92 at TEA MRI). Generalized linear models showed that the 3 clinical variables with p < 0.10 between infants with and without WMA (fetal distress, placental weight, and Apgar score less than 8 at 5 minutes; Table S1) were not associated with either WMA volume or WMA percentage to TCV, adjusting for GA at birth and coil type. Sex and PMA at MRI were also not associated with either WMA volume or WMA percentage to TCV.
WMA Distribution Pattern in the 3D Brain Space of MLP Infants
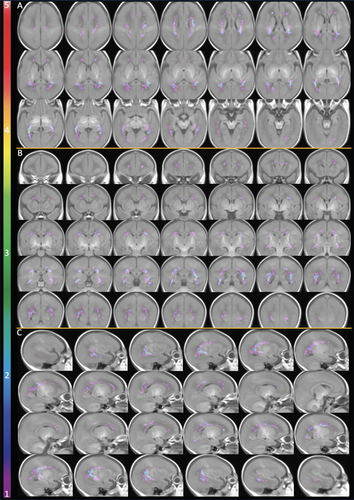
The probabilistic map of maximum WMA from 40 MLP infants indicated that WMA occurred predominantly in the posterior regions, with anterior and central white matter less affected (Fig 3). The trigonal regions and areas around the temporal and occipital horns of the lateral ventricles were more vulnerable to WMA, followed by some areas in the central white matter above the body of the lateral ventricles. In comparison with the WMA identified at early-life in 36 MLP infants, those seen at TEA in 31 MLP infants were at homologous regions, but much less prominent (Fig 4).
WMA in MLP Infants Relative to WMI in VP Infants and Term Infants with CHD
The total WMA volumes in the 40 MLP infants (median: 21.5mm3, IQR: 8.8–70.0) were significantly smaller than the total WMI volumes in 86 term CHD infants (median: 88.0mm3, IQR: 42.0–217.3; β = −273.4, p = 0.022), but not different from the total WMI volumes in the 2 VP cohorts (68 VP-PTC infants [median: 16.0mm3, IQR: 6.8–45.1] and 58 VP-Traj infants [median: 43.9mm3, IQR: 21.4–296.2]), adjusting for sex and PMA at MRI. Results were similar when GA at birth was also included in the model. WMI/WMA occurred in certain homologous regions in all cohorts, with majority of the WMI/WMA in the regions around the trigones (Fig 5). MLP infants and VP infants were more likely than term CHD infants to have WMI/WMA in the bilateral central white matter above the body of the lateral ventricles (see Fig 5A: 1st row, Fig 5B: 2nd row). More areas in the anterior regions of the superior white matter in VP infants appeared vulnerable to WMI/WMA than in MLP infants. In the medial posterior regions, MLP infants shared more similar WMI/WMA distribution with VP-PTC infants than with VP-Traj infants. However, near temporal horns, MLP infants had more similar WMI/WMA distribution to VP-Traj infants and term CHD infants than to VP-PTC infants (see Fig 5B: 4th row). WMI in term CHD infants were more widespread and extended more anteriorly and posteriorly than WMA in MLP and WMI in VP infants. Maternal education level used as an indicator for SES was not significantly different across the 4 cohorts (p = 0.09).
Discussion
In this contemporary prospective cohort of MLP infants, we found a high incidence of punctate WMA assessed with brain MRI soon after birth (median 35.6 weeks) and at TEA. Infants with/without WMA had similar pregnancy and neonatal characteristics, most were admitted to the NICU, and GA at birth was not related to WMA load. WMA was most evident on the early-life T1-weighted MRI and in most cases was of smaller volume and less visible or undetectable at TEA. WMA volume in MLP was similar to WMI volume in VP infants, but WMI volume in term CHD infants was greater. Occurring in a characteristic distribution pattern within the brain, WMA was most commonly seen in the posterior regions and less in the central and anterior regions, with considerable similarity to the WMI locations in VP and term CHD infants, supporting the selective vulnerability of the oligodendrocyte progenitor cells in the pathophysiology of WMI.40
Previous assessments of WMA in MLP infants have been at TEA or later, with reported rates of 2 to 15%12, 13 and a recent investigation in 500 healthy full term infants reported WMI in 12%.41 In contrast, we found 36.7% of MLP infants had WMA identified on early-life scan, which is surprisingly similar to reported rates of WMI in VP infants.42-44 The previous studies in MLP infants used serial cranial ultrasound and/or MRI at TEA or later,21-27 whereas the peak vulnerability to punctate WMI in neonatal brain occurs before TEA.19 Some studies either did not examine T1-weighted images21, 26 or with lower resolution.25 Small lesions are hard to identify because of partial volume effect with large voxel. We measured WMA at both early-life when the neonatal brain is more susceptible to WMA and again at TEA on high resolution T1-weighted images (1mm3). Importantly, most of the WMA that we found on early-life scans were much harder to detect on scans acquired at TEA, and may have been missed without knowledge of the findings from earlier scans. Consistent with this, we found a significant decrease in WMA volume from first to second scan, although a small number of infants had minimal increased WMA in the occipital region. In comparison with the majority of infants without increased occipital WMA, this group had greater total WMA volume. The worsening occipital WMA from early-life to TEA in some babies may reflect ongoing vulnerability of pre-oligodendrocytes in the context of maturation arrest.14 Our findings suggest that much of the burden of WMA in MLP infants occurs before or very soon after birth and may be underestimated when scanning takes place only around TEA.
Most maternal, pregnancy, birth, and neonatal characteristics were similar for MLP infants with and without WMA. Generally, WMI is more common in VP infants with more severe illness45 and frequently co-occurs with other brain abnormalities.46 In contrast, although most MLP infants in our cohort were admitted to NICU, very few had evidence of perinatal asphyxia, developed sepsis, or required surgery, and most co-occurring brain abnormalities were not clinically significant. In healthy term infants, instrumental delivery was more common in those with WMA,41 but in our MLP cohort there were just 3 infants with forceps delivery and none with ventouse delivery. Among term infants with CHD, lower GA at birth is a robust predictor of WMI volume, even when accounting for lowest arterial saturation level pre-operatively, lowest mean blood pressure and total bypass time,17 but we found no association with GA at birth in this MLP cohort. The cohort was characterized by complicated pregnancies, but uneventful neonatal courses, suggesting WMA might reflect a prenatal problem, but we found no obvious risk factors to help identify those at highest risk. Future studies with greater number of participants may allow identification of risk factors related to WMA burden with sufficient power.
WMI is thought to reflect microglial activation in response to neuroinflammation,46 and correspond histologically to focal infarction and arrested pre-oligodendrocyte maturation.47 In the normal process of oligodendrocyte lineage and myelination, central white matter matures first, followed by posterior to anterior white matter. Therefore, by MLP gestations, immature oligodendrocytes in the central white matter may be resistant to injury, but pre-oligodendrocytes in anterior and posterior white matter may still be vulnerable.40 The distribution of WMI in term infants with CHD is consistent with delayed in utero brain development and matches the spatial localization of pre-oligodendrocytes expected in MLP infants, where there is a paucity of lesions in central white matter with predilection for anterior and posterior regions.17 In our MLP cohort, WMA pattern was similarly focused in posterior regions, and the white matter around the trigones and temporal and occipital horns were most affected, which corresponds to injury to the immature pre-oligodendrocytes. WMI in term CHD infants extended more anteriorly and posteriorly than that in MLP infants. Being born later than VP infants, MLP infants also exhibited less WMA in the central and anterior white matter. Although a consistent WMA assessment protocol was followed, differences exist in scanners and parameters of brain MRI across MLP, VP, and CHD cohorts, as they were conducted at multiple centers.
The typical abnormal T1-hyperintense MRI signals identified in VP infants and term CHD infants are often linked to microscopic areas of necrosis or regions of gliosis, indicating a form of pathological injury in the white matter.12, 19, 20 These signals have been histologically correlated with areas of cell loss, including pre-oligodendrocytes, which are particularly vulnerable in preterm infants.19 This injury can lead to myelination disturbances and includes both cystic and non-cystic forms. It is well recognized that necrosis in the neonatal brain is replaced by tissue loss rather than glial scar. Therefore, the expected evolution of these lesions represented on the neonatal brain MRI is to “resolve” when measured as T1 brightness from early-life to TEA. However the decrease or disappearance of T1 hyperintensity does not reflect a resolution of the injury, and understanding long-term impact on brain maturation and neurodevelopmental outcomes requires longitudinal follow-up studies. The correlation between histopathological findings and MRI signals was also elegantly demonstrated in Riddle's paper.31 The T1-hyperintense MRI signals that we observed in this MLP cohort share remarkable similarity in both the radiological appearance and spatial distribution with those in VP infants and term CHD infants, although no precise histopathological correlates have yet been demonstrated in human MLP infants.
We postulate that WMA as detected at early MRI may be an important contributor to the known risks of adverse long-term outcomes after MLP birth.8, 9 The pattern of WMA in posterior supratentorial white matter that we found in MLP infants shared similarities with that identified in term infants with CHD,17 and in that population was predictive of poorer motor outcomes at age 30 months.18 WMI seen on early scans in VP infants was also associated with increased likelihood of poor motor outcomes,13 especially when identified in anterior brain regions,15, 30 even if the lesions were no longer visible at TEA. In the VP-Traj cohort, WMI located anterior to the mid-ventricle line had a positive predictive value of 90% for adverse motor development at 4.5 years.15 Others have shown that preterm infants (<33 weeks) with WMI on MRI at TEA had smaller thalamic volumes, altered white matter maturation, and greater risk of poor motor outcomes at 20 months.16 Given these findings that anteriorly located WMI is associated with adverse outcomes,13, 15, 17 better neurodevelopmental outcomes might be expected in the MLP population with WMA than VP and term CHD populations. Previous studies also showed that impairments in MLP infants were milder than those in VP infants.48 However, the neurodevelopmental assessment of the present MLP cohort is still ongoing, and we have not yet able to comprehensively and systematically review the burden of impairment in this cohort. Future long-term follow up of the infants in our cohort will help to elucidate the relationship between WMA and neurodevelopment in MLP infants.
A robust and accurate segmentation method is necessary to quantify WMI/WMA. Manual segmentations carried out by experts are labor intensive and risk operator bias. With the advancement of computational methods and larger training dataset available, in the future, accurate automatic delineation of WMI/WMA may be possible. The Gaussian process regression model proposed by O'Muircheartaigh et al49 showed promise.
Although MRI findings at TEA have been reported in MLP infants, this is the first report of early-life MRI findings in these infants. The rates of WMA at both early-life and TEA scans were much higher than previously reported at TEA, most WMA found on early scan was more challenging to identify on scans at TEA, and WMA volume was smaller on the TEA scan. With the current sample size, we were not able to identify clinical risk factors for WMA in this cohort. A voxel-wise comparison of WMA distribution in MLP infants and WMI distribution in VP and term CHD populations reflected the regional variability in the maturation of pre-oligodendrocites.40 Future studies should investigate the association between the volume and location of WMA and later neurodevelopmental outcomes.
Acknowledgements
This work was supported in part by grants from the Health Research Council of New Zealand (16/605, 18/407, 22/113), the Jubilee Crippled Children Foundation Trust, and the Cerebral Palsy Alliance Research Foundation (02821). We are extremely grateful to all the families who participated in the study. We thank the staff of the Centre for Advanced Magnetic Resonance Imaging for MRI scanning, of the Centre for eResearch for computing support, and Dr. I. Zwaan for data checking. Open access publishing facilitated by The University of Auckland, as part of the Wiley - The University of Auckland agreement via the Council of Australian University Librarians.
Author Contributions
E.K., T.G., S.W., J.M.A., F.H.B., M.B., D.D., S.P.M., C.M., D.P., N.S.S., and J.E.H. contributed to the conception and design of the study; E.K., T.G., S.W., T.S., J.M.A., F.H.B., M.B., D.D., S.P.M., C.M., D.P., J.E.H., and the MR DIAMOND and MoPED Study Groups contributed to the acquisition and analysis of data; E.K., T.G., S.P.M., and J.E.H. contributed to drafting the text or preparing the figures.
MR DIAMOND Study Group: Catherine Carter (Advanced Diploma in Neonatal Nursing), Te Toka Tumai Auckland, Auckland, New Zealand. Liggins Institute, University of Auckland, Auckland, New Zealand. Janine Chant (PGDip Health Science (MRI), Centre for Advanced MRI, University of Auckland, Auckland, New Zealand. Greg Gamble (MSc), Liggins Institute, University of Auckland, Auckland, New Zealand. Isabel Zwaan (PhD), Liggins Institute, University of Auckland, Auckland, New Zealand. Listed individually as authors: J.E.H. (chair), J.M.A., F.H.B., D.D., T.G., E.K., S.P.M., C.M., S.W., D.P.
MoPED Study Group: Catherine Carter (Advanced Diploma in Neonatal Nursing), Te Toka Tumai Auckland, Auckland, New Zealand. Liggins Institute, University of Auckland, Auckland, New Zealand. Greg Gamble (MSc), Liggins Institute, University of Auckland, Auckland, New Zealand. Louise Pearce (PgDip Health Science), Auckland Children's Physiotherapy, Auckland, New Zealand. Jenny Rogers (MHSc), Liggins Institute, University of Auckland, Auckland, New Zealand. Corinne Watson (Doctorate of Physical Therapy), Liggins Institute, University of Auckland, Auckland, New Zealand. Isabel Zwaan (PhD), Liggins Institute, University of Auckland, Auckland, New Zealand. Listed individually as authors: J.E.H. (chair), M.B., T.G., S.P.M., C.M., S.W., D.P., N.S.S.
Potential Conflicts of Interest
Nothing to report.
Open Research
Data Availability
De-identified data will be available after publication of key primary papers by the MR DIAMOND and MoPED study groups. Data will be available to researchers who provide a methodologically sound proposal with appropriate ethical approval, where necessary, and following approval of the proposal by the Data Access Committee at the Liggins Institute. Data requestors will be required to sign a data access agreement before data are released. Request for access to data can be made to the Human Health Research Services platform at the Liggins Institute, University of Auckland ([email protected]) ([email protected]).


