Population-Based Evidence for the Use of Serum Neurofilaments as Individual Diagnostic and Prognostic Biomarkers in Amyotrophic Lateral Sclerosis
Abstract
Objective
Neurofilament light chains (NfL) and phosphorylated neurofilament heavy chains (pNfH), established as diagnostic and prognostic biomarkers in hospital-based amyotrophic lateral sclerosis (ALS) cohorts, are now surrogate markers in clinical trials. This study extends their evaluation to a population level, with the aim of advancing their full establishment and assessing the transferability of biomarker findings from controlled cohorts to real-world ALS populations.
Methods
We measured serum NfL and pNfH levels in all ALS patients (n = 790) and general population controls (n = 570) with available baseline samples participating in the epidemiological ALS Registry Swabia, providing platform-specific (ELLA™) reference data and Z-scores for controls, as well as reference data, disease-specific Z-scores and longitudinal data in ALS. We evaluated the diagnostic and prognostic utility of neurofilaments and quantified the impact of ALS-related factors and non-ALS confounders.
Results
Neurofilaments showed high diagnostic and prognostic utility at the population level, with NfL superior to pNfH. The novel concept of a population-based ALS Z-score significantly improved the prognostic utility compared to absolute raw values. Both biomarkers increased more strongly with age in controls than in ALS, and age adjustment improved diagnostic accuracy. Our data show that disease progression rates, ALS phenotype, body mass index (BMI), and renal function need to be considered when interpreting neurofilament levels; longitudinal neurofilament levels were generally stable in individual patients, especially when adjusted for age and baseline levels.
Interpretation
Population-based assessment enhances the utility of particularly serum NfL as a diagnostic and prognostic biomarker in ALS and improves the translation of findings from controlled cohorts to real-world populations. ANN NEUROL 2024;96:1040–1057
Neurofilaments are neuron-specific proteins that assemble into heteropolymers and form a part of the axonal cytoskeleton.1 Ultra-sensitive assays allow reliable quantification of neurofilament light chains (NfL) and phosphorylated neurofilament heavy chains (pNfH) not only in cerebrospinal fluid (CSF) but also in blood. With improved accessibility in blood, neurofilaments have emerged as promising biomarkers for monitoring neuroaxonal damage in neuroinflammatory and neurodegenerative diseases.2-4
Very rapid neurodegeneration in amyotrophic lateral sclerosis (ALS) is associated with overall high neurofilament levels compared to the vast majority of other diseases.2, 4 Evidence from various ALS centers and research networks suggests diagnostic and prognostic utility of neurofilaments.5-17 They can support the diagnostic work-up and help to optimize patient care by providing prognostic information. Due to their prognostic ability, neurofilaments are also considered potential surrogate markers for classical clinical endpoints such as disease progression and survival and are currently used as pharmacodynamic endpoints in randomized controlled trials. Pathophysiologically, it can be assumed that a treatment that slows down neurodegeneration will also lead to a longitudinal decrease in neurofilament levels. A neurofilament reduction observed in patients with superoxide dismutase (SOD) -associated ALS (approximately 2% of all ALS cases) treated with the antisense oligonucleotide tofersen provided important proof of principle18 – and had a decisive role in its accelerated approval by the US Food and Drug Administration (FDA).19 Neurofilament data from the tofersen trial18 and from a randomized controlled trial with a high-caloric fatty diet in patients with sporadic ALS20 suggests that biomarker reduction precedes clinical response to treatment, which holds promise for more efficient evaluation of new therapeutic approaches – an important consideration given the low prevalence of the disease and the increasing number of treatment options available for clinical evaluation.21
Although extensively studied, the establishment of neurofilaments in ALS has so far taken place within the confines of hospital-based research. This inherently introduces selection bias and limits the generalizability of findings in controlled cohorts to the broader ALS population encountered in real-world settings – a critical issue considering recent steps toward biomarker-driven drug development. Hospital-based research is associated with limited sample sizes in control cohorts and the inclusion of either overly healthy volunteers or hospitalized patients with a heterogeneous range of non-neurodegenerative diseases. Epidemiological research can help to overcome these limitations by providing population-based data and is therefore considered crucial for the full establishment of biomarkers.22
In the NF-ASSESS study (Neurofilament Assessment in an Epidemiological Biomarker Study in the ALS Registry Swabia), we measured NfL and pNfH in serum in participants from the epidemiological ALS Registry Swabia using a latest-generation ultra-sensitive immunoassay platform (ELLA™). Our objectives were to assess the diagnostic and prognostic utility and the longitudinal stability of neurofilaments at the ALS population level and to quantify the impact of ALS-related factors and non-ALS confounders. As the reliability of ELLA™ has already been demonstrated in head-to-head comparisons with the market-leading Simoa™ platform,16, 23, 24 an additional aim was to provide previously lacking comprehensive ALS and control reference data for ELLA™, adding to the existing neurofilament reference data for the Simoa™ platform.25
Methods
Study Population
The epidemiological ALS registry Swabia covers a target population of about 8.4 million inhabitants in the defined geographical region Swabia in southern Germany and has been described previously.26-28 ALS patients are categorized into the sub-phenotypes classical ALS, primary lateral sclerosis (PLS), progressive bulbar palsy, progressive muscular atrophy (PMA), flail-arm syndrome, and flail-leg syndrome and followed up at 1-year intervals, including reconciliation with the death register to ensure completeness of survival data. In a case–control substudy, for each patient enrolled between October 01, 2010, and December 31, 2014, 2 sex- and age-matched controls were randomly selected from the general population. Bio samples are collected at each visit, following standard operating procedures. The study was approved by the ethics committee of Ulm University (No. 11/10), the Medical Association of Baden-Wuerttemberg (No. B-F-2010-062), and the Medical Association of Bavaria (No. 7/11300).
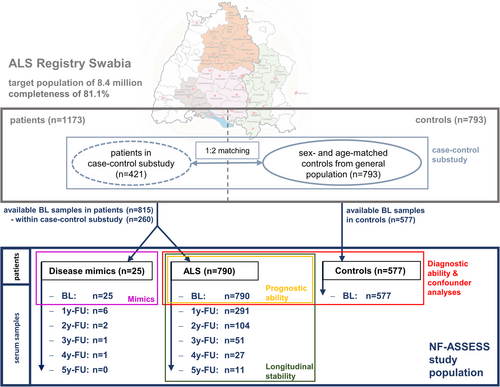
The present study includes all ALS patients and controls in the ALS Registry Swabia with available serum samples from the baseline visit, which in ALS takes place as soon as possible after the diagnosis of ALS (data closure: December 3, 2020; Fig 1). Demographic data consistency across the present study, the entire ALS registry, and the case–control substudy was confirmed (Table S1). Patients in whom an initial ALS diagnosis was revoked during follow-up (disease mimics; n = 25) were excluded from diagnostic and prognostic analyses (final diagnosis in Table S2). Baseline disease progression is measured by points lost per month on the ALSFRS-R from disease onset, and follow-up progression by points lost per month between enrollment and the last visit. Equations for computing disease progression, blood volume,29 body fat,30 and cystatin-C-based glomerular filtration rate (GFR)31 are provided in the Supplementary Methods.
Biomarker Measurement
Serum neurofilament measurements were conducted with the Ella™ automated immunoassay system (biotechne, Minneapolis, USA) using commercially available kits: Human NF-H (assay range 7.47–28,480 pg/ml) and Human NF-L (assay range 2.7–10,290 pg/mL) as instructed by the manufacturer. The inter-assay coefficients of variation determined by analyzing 2 serum quality control samples (low and high endogenous levels of the analyte) on each cartridge were 11.4/10.1% for pNfH and 9.3/6.1% for NfL, respectively. All samples were measured in technical triplicates with the acceptance criterium of a coefficient of variation <10% and with cartridges from the same lot. Longitudinal samples in individual patients were measured on the same cartridge.
Statistical Analysis
Demographic and clinical data at enrollment are reported as mean and SD or median and interquartile range (IQR) (Q1-Q3) as appropriate. Metric data were tested for normal distribution using the Shapiro–Wilk test or Q-Q plots as suitable. Group differences in continuous variables were tested using a t-test or analysis of variance (ANOVA) for normally distributed variables or the Mann–Whitney U test or the Kruskal-Wallis test in not-normally distributed variables; a chi-squared test was used in categorical variables. The right-skewed distribution of the biomarker levels in both groups was transformed into a normal distribution using the natural logarithm (Ln) followed by the calculation of 2 different Z-scores: 1 based on the neurofilament distribution in controls (Control Z-score) and 1 based on the distribution of the biomarkers in ALS (ALS Z-score) (Equations see supplementary methods, Figs S1 and S2).
The diagnostic performance of NfL and pNfH was assessed using the area under the curve (AUC) of receiver operating characteristics (ROC) curve, with diagnostic cutoff values determined for 90% and 95% specificity. The impact of age on NfL and pNfH levels was assessed using scatterplots to visualize at which age serum levels start to rise and by linear regression models and Kruskal–Wallis test using age groups (≤50, 51–60, 61–70, 71–80, >80 years). Age-adjusted Control Z-scores were computed using mean and SD from each age group.
To quantify the effect of ALS-related factors and non-ALS confounders, we used multivariable regression models with backward elimination; non-significant variables were eliminated 1 by 1, starting with the variable with the highest p-value, until only significant variables remained. The full model included the variables age, sex, and BMI in controls, extended by the disease-specific variables disease progression at baseline, phenotype, and site of disease onset (spinal versus bulbar) in ALS. Additionally, we used the same models with body fat and blood volume estimated based on BMI instead of BMI itself. The quality of the model fit was assessed by the multiple correlation coefficient (R).
Prognostic evaluation of NfL and pNfH utilized ALS Z-scores grouped in 0.5 SD intervals centered around the population mean (mean ± 0.25 SD) and ranging from ≤ −1.75 to > +1.75 on the ALS Z-scale. Survival was evaluated using Kaplan–Meier Statistics and the log-rank test, prediction of disease progression at baseline and follow-up by visualization in boxplots, and comparison of groups using the Kruskal-Wallis test. Longitudinal individual stability of biomarkers was assessed by absolute and relative changes in raw and logarithmically transformed neurofilament levels.
Statistical analyses were performed using SPSS (version 28.0.1.0) and R Software for Statistical Computing (v4.2.2; R Core Team 2023), with a significance level set at p < 0.05.
Results
Baseline Characteristics
Patients with ALS had a lower BMI at enrollment (24.34 kg/m2 vs 26.08 kg/m2, p < 0.001), whereas age and sex distribution did not differ from controls (Table 1A). The baseline characteristics of the ALS patients are shown in Table 1B and those of the disease mimics in Table S3.
| A | General Characteristics & Neurofilament Levels | ALS (n = 790) | Controls (n = 577) | p-Value |
|---|---|---|---|---|
| Male sex, n (%) | 478 (60.5) | 335 (58.1) | 0.363 | |
| Age [y], median (IQR) | 66.5 (58.2–73.8) | 66.1 (59.3–72.4) | 0.515 | |
| BMI [kg/m2], median (IQR) | 24.34 (21.97–26.93) | 26.08 (23.51–28.83) | <0.001 | |
| Raw NfL [pg/ml], median (IQR) | 119 (72–177) | 24 (19–32) | <0.001 | |
| Raw pNfH [pg/ml], median (IQR) | 1,522 (570–3,055) | 249 (122–452) | <0.001 |
| B | ALS Specific Characteristics | ALS (n = 790) |
|---|---|---|
| Time since disease onset [m]; median (IQR) | 12.1 (7.8–19.3) | |
| ALSFRS-R sum score [pt], median (IQR) | 38 (33–42) | |
| Disease progression at baseline [pt lost/month], median (IQR) | 0.75 (0.41–1.33) | |
| Follow-up disease progression [pt lost/month], median (IQR); n = 386 | 0.58 (0.28–1.06) | |
| Follow-up time after baseline [m]; median (IQR) | 18.8 (10.2–35.7) | |
| Deceased at data closure, n (%) | 554 (70.1) | |
| Survival time from disease onset [y]; median (95% CI) | 3.15 (2.94–3.36) | |
| El Escorial status | ||
| Suspected, n (%) | 223 (28.2) | |
| Possible, n (%) | 97 (12.3) | |
| Possible (lab supported), n (%) | 161 (20.4) | |
| Probable, n (%) | 247 (31.3) | |
| Definite, n (%) | 62 (7.8) | |
| Onset site | ||
| Bulbar, n (%) | 230 (29.1) | |
| Cervical, n (%) | 228 (28.9) | |
| Thoracic, n (%) | 25 (3.2) | |
| Lumbar, n (%) | 270 (34.2) | |
| Uncertain, n (%) | 37 (4.7) | |
| Phenotype | ||
| Classical ALS, n (%) | 605 (76.6) | |
| Progressive bulbar palsy, n (%) | 58 (7.3) | |
| Primary lateral sclerosis (PLS), n (%) | 24 (3.0) | |
| Progressive muscular atrophy (PMA), n (%) | 87 (11.0) | |
| Flail arm syndrome, n (%) | 15 (1.9) | |
| Flail leg syndrome, n (%) | 1 (0.1) |
A Kaplan–Meier plot for overall survival in ALS is provided in Fig S3.
Neurofilaments as Diagnostic Markers
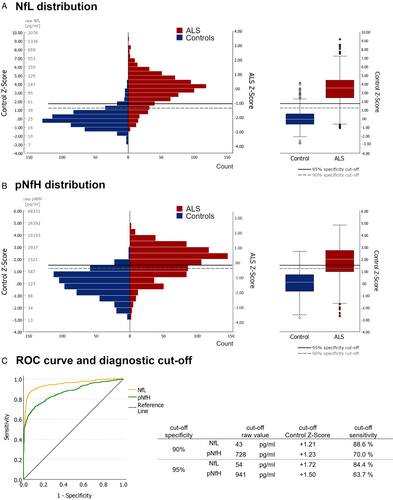
Baseline neurofilament levels were significantly elevated in the ALS cohort with a Control Z-score of +3.37 (±1.68) for NfL and + 1.80 (±1.24) for pNfH compared to the general population control cohort (± 0.0; SD ± 1.0 by definition). Baseline levels showed a relatively small overlap between ALS patients and controls for NfL, but a much larger overlap for pNfH (Fig 2A,B). Accordingly, NfL showed superior diagnostic ability (ROC AUC 0.947, 95% confidence interval [CI] 0.935–0.958) compared to pNfH (ROC AUC 0.867, 95% CI 0.848–0.886; Fig 2C). At 95% specificity, NfL had a sensitivity of 84.4% (cutoff: 54 pg/ml), exceeding the sensitivity of pNfH of 63.7% (cutoff: 941 pg/ml). Exploring a combination of both biomarkers using binary logistic regression showed that pNfH does not augment diagnostic capability when combined with NfL. Because of its superior diagnostic performance, we focused on NfL as the primary diagnostic marker in subsequent analyses.
Factors Confounding the Diagnostic Utility
A significant increase in NfL and pNfH was observed in controls after 60 years of age, with notable differences between adjacent age decades for NfL (Fig 3A,B; reference values in Table S4). Multilinear regression in controls (R = 0.579, p < 0.001) confirmed the effect of age (+0.025 log units per year, stand. ß = 0.568, p < 0.001) and additionally showed a smaller effect of BMI (−0.011 log units per kg/m2, stand. ß = −0.111, p = 0.001). Exploratory analysis using estimated body fat and blood volume instead of BMI slightly improved the model performance (R = 0.593, p < 0.001). In this scenario, both parameters showed significant effects (estimated body fat: −0.008 log units per % body fat, stand. ß = −0.127, p < 0.001; estimated blood volume: −0.038 log units per L blood volume, stand. ß = −0.074, p = 0.032), with age maintaining the main impact (stand. ß = 0.616, p < 0.001).
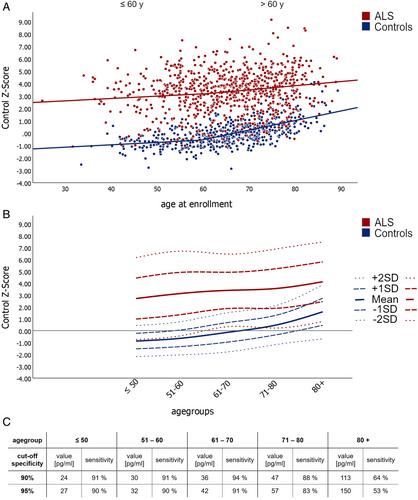
In ALS patients, an age-dependent increase in NfL and pNfH was also noted, though levels were more scattered, lacking significance between adjacent decades (Fig 3A,B, Table S4). Multilinear regression models in ALS revealed significant correlations between NfL levels and the following factors: PMA and PLS phenotypes, sex, site of onset (bulbar vs. spinal), disease progression at baseline, BMI, and age (R = 0.496, p < 0.001). Negative correlations were observed for BMI (−0.025 log units per kg/m2, stand. ß = −0.150, p < 0.001), PMA (ß = −0.337 log units, p = 0.008), and PLS (ß = 0.340 log units, p = 0.017). Positive correlations were found for disease progression at baseline (+0.266 log units per change of 1 ALSFRS-R pt lost/month, stand. ß = 0.333, p < 0.001), age at enrollment (+0.008 log units per year, stand. ß = 0.109, p = 0.001), bulbar onset (ß = +0.200 log units, p < 0.001), and female sex (ß = +0.238 log units, p < 0.001). In conclusion, disease progression at baseline was the clinical variable that most influenced neurofilament levels in ALS patients, while an effect of age was present but significantly weaker than in controls.
Notably, the sex effect on NfL levels observed in ALS was not present in controls. Exploring an alternative model with estimated body fat and blood volume instead of BMI revealed a consistent effect size for sex (+0.253 log units), independent of estimated body fat (−0.013 log units per % body fat, stand ß = −0.135, p = 0.027) and estimated blood volume (−0.108 log units per L blood volume, stand. ß = −0.126, p = 0.057). Assessing the impact of sex on diagnostic accuracy indicated higher accuracy in females (ROC AUC 0.957, 95% CI 0.939–0.974) compared to males (ROC AUC 0.939, 95% CI 0.922–0.955) at the 95% specificity cutoff (female: 51 pg/ml, sensitivity 91%; male: 57 pg/ml, sensitivity 79%; ROC curve in Fig S4).
Age-Dependent Diagnostic Cutoffs
Given the significant difference in age-related NfL increase between ALS and controls, age-specific diagnostic cutoffs were implemented for each age group (Fig 3C). The introduction of age-adjusted control Z-scores further improved the diagnostic performance of NfL (ROC AUC 0.954, 95% CI 0.944–0.965). At an age-adjusted Control Z-score of +1.24, specificity reached 90% (sensitivity 89%), rising to 95% at +1.62 (sensitivity 87%).
Incorporating Clinical Parameters and Renal Function into Diagnostic Evaluation
Patients with restricted phenotypes exhibited lower NfL levels compared to those with classical ALS, with the exception of progressive bulbar palsy (Fig 4A). Irrespective of the phenotype, disease progression at baseline positively correlated with NfL levels in ALS (Fig 4B). These disease-related factors influenced the diagnostic capability to distinguish between ALS and controls (Fig 4C), particularly evident in patients with a PLS phenotype or a disease progression rate <0.25 pt lost/month. Given ALS's clinical nature, biomarkers are crucial, especially in early disease stages and for distinguishing ALS from mimicking diseases. Our study reveals sustained high diagnostic performance in early disease stages and notably lower NfL levels in disease mimics compared to ALS (see Supplementary Results).
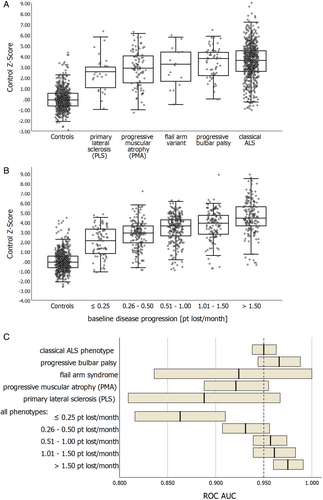
In a subset of ALS patients with available cystatin C levels (n = 239), we assessed the impact of renal function on NfL baseline levels. Although the number of ALS patients with impaired renal function was relatively small (chronic kidney disease [CKD] Stage 3: n = 23 (9.6%), CKD Stage 4: n = 4 (1.7%)), NfL baseline levels were significantly elevated in patients with impaired renal function compared to those without not explained by age or disease progression (CKD Stage 1 + 2: median ALS Z-score + 0.02 (IQR −0.63 to +0.59); CKD Stage 3: median ALS Z-score + 0.56 (IQR −0.03 to +1.35); CKD Stage 4: median ALS Z-score + 1.40 (IQR +0.72 to +2.01)).
In subsets with available transaminases (GOT and GPT; n = 436) or creatine kinase (CK; n = 497), no correlation was found between these laboratory parameters and baseline NfL levels.
NfL and pNfH as Surrogate Markers
There are 2 main quality criteria to evaluate the performance of a surrogate marker used in clinical trials: (i) the ability to predict the clinical endpoint of interest and (ii) the longitudinal stability over trial-relevant timeframes in individual patients.
Prognostic Ability of Neurofilaments
Nine prognostic subgroups were created by equally binning the ALS Z-scores at 0.5 SD intervals. Assigning numbers, starting with the lowest Z-scores, formed the NF-ASSESS score, ranging from 1 to 9 (Fig 5A,B). Additional binning approaches with 0.66 SD (7 subgroups) and 1.0 SD (5 subgroups) have been explored and are provided in Figs S11–S13. The NF-ASSESS score reflects the location of a patient's neurofilament level relative to all other patients with ALS in the same population.
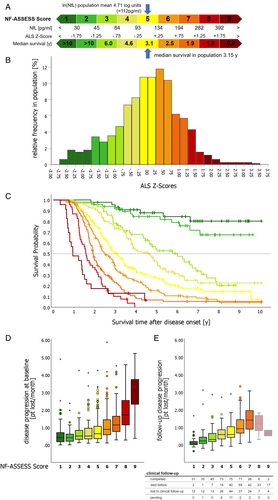
Using the NF-ASSESS score as a baseline, we evaluated the prognostic significance of neurofilaments for survival and disease progression. Survival after disease onset differed significantly between patients with different NF-ASSESS scores (log-rank p < 0.001 for NfL and pNfH; Fig 5C, Fig S10). Comparison of the prognostic value of NfL and pNfH demonstrated the superiority of NfL (Figs S11–S13), and an additional Cox-regression analysis showed that using a combination of both biomarkers did not increase the prognostic value, with pNfH adding no additional prognostic information to the use of NfL alone. Subsequently, we focused on NfL, and the term NF-ASSESS score now refers to the NfL-derived score.
Furthermore, the NF-ASSESS score correlated significantly with baseline disease progression rates (Fig 5D; p < 0.001) and follow-up disease progression rates (Fig 5E; n = 370; p < 0.001), although disease progression rates did not always significantly differ between adjacent NF-ASSESS score groups. Importantly, the survival probability was a notable confounding factor when evaluating follow-up disease progression rates, especially in patients with a high NF-ASSESS score.
Sex and Prognosis
Comparing survival time in female and male patients with ALS showed a significantly longer median survival time in male patients (3.38 years vs 2.91 years, log-rank p = 0.003). However, no significant difference existed after adjusting for the NF-ASSESS score (log-rank p = 0.098), which indicates that the biomarker-based approach might be less influenced by patients' sex. Interestingly, in patients with a high NF-ASSESS score (≥7), we even observed longer median survival in females (2.08 vs 1.75 years; log-rank p = 0.005; Fig S14).
Longitudinal Stability of Neurofilaments in Individual Patients
The mean relative individual change of neurofilament levels at the 1-year follow-up in patients with longitudinal biomarker sampling (n = 291) was +1.94% (SD ±8.33%; 95% CI 0.98% to 2.91%) for Ln(NfL) and −0.04% (SD ±7.05%; 95% CI -0.78% to +0.85%) for Ln(pNfH). The changes were normally distributed, and for 81.5% of the patients, the relative difference between baseline and 1-year follow-up values did not exceed 10%; about half of the patients (52.9%) even showed less than 5% difference (Fig 6A). Some caution is warranted concerning generalizability to fast-progressing patients due to a more favorable prognosis in this subcohort (Table S7).
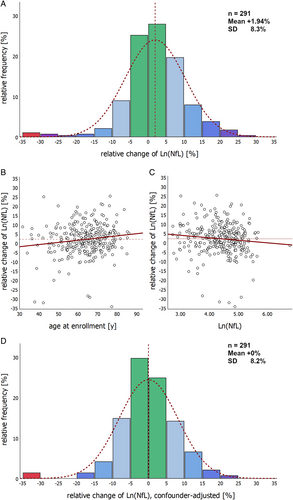
Multiple linear regression with backward elimination identified age (stand. ß = 0.151; p = 0.009; Fig 6B) and Ln(NfL) baseline values (stand. ß = −0.137; p = 0.018; Fig 6C) as significant contributors to individual longitudinal 1-year biomarker changes. The progressive bulbar palsy phenotype (n = 20) also showed a significant increase in NfL (median + 6.3%, IQR +3.3% to +12.8%), while other factors, including phenotype, sex, site of onset, disease duration, ALSFRS-R baseline score, disease progression and BMI, did not influence stability. Controlling for age and Ln(NfL) baseline values shifts the distribution to a mean change of 0 (Fig 6D), which might be helpful when using the longitudinal NfL course for treatment monitoring.
Long-term follow-up of neurofilament levels in individual patients showed a mean relative change in Ln(NfL) of +2.1% (SD ±10.1%; n = 104) at 2 years and + 0.5% (95% CI -2.6% to +3.5%; n = 45) at 3 years. As long-term follow-up is inherently biased toward patients with a more favorable prognosis, we additionally performed a mixed model analysis including all NfL follow-up data that confirmed the longitudinal stability of NfL levels (p = 0.283 for the effect of follow-up visit on NfL). Importantly, the longitudinal rate of change was not a useful parameter for predicting outcome in ALS patients.
Discussion
Epidemiological registers provide an accurate picture of the real-world target population and are therefore essential to assess the generalizability of biomarker findings from controlled cohorts: particularly relevant in ALS, given the pioneering role of blood NfL in drug approval.19 At the ALS population level, the present study shows how the implementation of an ALS Z-score could enhance the prognostic power of the biomarker and establishes the relationship between neurofilaments in ALS and the general population, helping to understand which disease-related factors and general confounders are relevant when interpreting neurofilament levels. It also allows head-to-head comparison of NfL and pNfH in serum and generates reliable reference data.
Serum and plasma NfL provide prognostic information that complements clinical parameters.5, 6, 9, 11, 12, 14, 15, 17 The predictive ability and longitudinal stability of neurofilaments have led to their widespread use as pharmacodynamic markers in clinical trials, although raw neurofilament levels only allow rough classification into 2 to 3 prognostic subgroups.5, 6, 9, 12 Our study shows that transforming raw neurofilament values into an ALS Z-score, which relates an individual's NfL level to the distribution observed in the ALS population, significantly improves prognostic accuracy. The ENCALS prediction model already provides a reliable survival prognosis based on 8 clinical parameters,32 but is limited by its reliance on ALSFRS-R-based disease progression and diagnostic delay as variables with a risk of bias33-36 and forced vital capacity, which declines in most patients at later stages of the disease. In contrast, the ALS Z-score approach is advantageous due to its simplicity, objectivity, and reliance on a single blood value, providing reliable prognostic information from the point of diagnosis, offering potential for drug development and optimization of patient care.
The NF-ASSESS score, developed by applying binning to a population-based biomarker Z-score, simplifies application by eliminating the need for additional statistical processing, making it a user-friendly tool. This method can distinguish up to 9 prognostic subgroups, with the optimal number depending on the application. Smaller bin widths provide more detailed prognostic information, useful for early individual prognosis, while larger bin widths increase group contrast, which may be useful to improve homogeneity and comparability in clinical trials when implemented in stratified randomization.
In addition to optimizing homogeneity, reducing diagnostic delay and enrolling patients as early as possible in interventional trials has become a key challenge.37 Although neurofilaments are not disease-specific and therefore cannot be used as stand-alone diagnostic markers, blood-derived NfL and pNfH levels can assist the diagnostic work-up.6-8, 10, 12-16 Our study is the first to show how neurofilament levels are distributed at the ALS population level and how they compare to the general population. We show that serum NfL levels, in particular, can discriminate between ALS and controls and that this ability is preserved in patients with early-stage disease.15 However, the primary diagnostic challenge in clinical practice is distinguishing ALS from ALS-mimicking diseases. Nevertheless, comparing biomarker levels between an ALS population and the general population has important implications: First, it shows the maximum diagnostic value that can be expected from neurofilaments in ALS. Second, it facilitates to investigate the diagnostic utility across the full diagnostic spectrum of ALS. And third, it allows for a thorough study of the factors impacting neurofilament levels, differentiating between general and ALS-specific influences; in this context, multivariate regression models were used to account for complex interactions and to quantify the effect of individual factors.
At a population level, our study now confirms that disease progression rate5, 6, 9, 11, 12, 17 is the disease-related factor that most influences neurofilament levels in ALS patients. In addition, PMA or PLS phenotype and onset site are phenotypic features with an impact on neurofilament levels,5, 6, 11, 38 which however becomes very small when the slower disease progression in these phenotypic subtypes is taken into account and controlled. We show a resulting reduction in the diagnostic utility of serum neurofilaments in ALS patients with slow disease progression and restricted phenotypes, consistent with findings for CSF measurements.38
Regarding general confounders, our study reproduces a strong increase in neurofilament levels after 60 years of age in the general population, which has been linked to brain atrophy and accelerated neuronal injury at higher age, possibly driven by subclinical comorbid pathologies.25, 39 In ALS patients, the relative increase in NfL with age is 3-fold lower, which is a significant difference from multiple sclerosis, with a similar increase in patients and controls.25 Accounting for this difference, we show that age-adjusted diagnostic cutoffs can increase the diagnostic ability of NfL in ALS, but also reveal the limited diagnostic utility after 80 years of age. An attenuated decrease in neurofilaments with higher BMI25, 40 was observed to the same extent in controls and ALS patients, indicative of an ALS-independent mechanism. A possible explanation may be biomarker dilution in blood and distribution in adipose tissue, as suggested by correlations of BMI-based estimates of blood volume40 and body fat with NfL levels in an explorative analysis; a hypothesis that warrants further study using more direct measures. Severe renal impairment emerged as a confounding factor, consistent with observations in healthy controls and individuals with diabetes.41 Consequently, significantly impaired renal function should be excluded when interpreting neurofilament levels and additional studies are warranted to establish a GFR cutoff. Noteworthy, cystatin C is expressed in neurons and has been discussed as a biomarker for ALS, but study results are so far inconsistent.42 A confounding of cystatin C cannot be completely excluded, but given the significant bias of serum creatinine due to muscle wasting and cachexia, it remains the more reliable marker for assessing renal function in this population.43 Additionally, we noted slightly higher NfL levels in female ALS patients compared to males, aligning with previous ALS cohort studies.9, 12 While this sex difference improved NfL's diagnostic performance in women, it did not significantly affect NfL-adjusted prognosis. In summary, our study highlights the importance of considering ALS-related and disease-independent confounding factors in diagnostic interpretation. Nevertheless, studying the distribution and dynamics of neurofilament levels in different ALS-mimicking diseases will be crucial to further elucidate the diagnostic sensitivity and specificity of serum NfL in different clinical constellations.
Simultaneously measured NfL levels in ALS patients using the Simoa™ and Ella™ were found equally useful for diagnostic and prognostic purposes,16 suggesting that our findings are not assay- or platform-specific. Our head-to-head comparison of NfL and pNfH indicates a diagnostic superiority and, to a lesser extent, also a prognostic superiority of serum NfL over serum pNfH, expanding on existing evidence collected in hospital-based cohorts.8, 44 The observed superiority has direct implications for application and may be explained by higher correlations between NfL CSF and blood levels compared to pNfH,5, 7 but further research is needed. In addition, our study provides natural history data for individual longitudinal NfL levels at the population level, confirming stability in individual patients over trial-relevant timeframes,5, 6, 11, 12 although a slight longitudinal increase in NfL levels associated with age and a small effect of baseline NfL levels need to be considered. Given the more favorable prognosis of patients in the follow-up subcohort, some caution is warranted in terms of generalizability to rapidly progressive ALS patients. Our data are valuable as serum neurofilament reference data for the ELLA™ platform (data available in Table S4), complementing existing neurofilament reference data for the Simoa™ platform, such as the benchmarking neuroinflammatory control cohort by Benkert and colleagues.25
Limitations of our study are a relatively long follow-up interval of 1 year compared to shorter follow-up intervals usually applied in clinical trials and the relatively low number of patients with clinical follow-up (n = 370) and longitudinal biomarker sampling (n = 291) compared to a large baseline number (n = 790), which limits the assessment of longitudinal NfL levels and the correlation with follow-up disease progression rates. A further limitation is the low representation of ALS mimics, which only permits a descriptive comparison of NfL levels for specific differential diagnostic constellations. Considering the lack of standardization of neurofilament measurement and the reliance on a reference population, a key challenge will be the generalizability of the NF-ASSESS score concept. As a first step, round-robin studies could be used to develop and establish mathematical models to control for inter-laboratory differences in neurofilament measurement, which could extend the use of the NF-ASSESS score with our reference population. Given the existing differences in ALS epidemiology between different ethnic groups,45, 46 additional reference data from large, diverse patient cohorts around the world will be crucial for the transferability of our approach to other populations. Ultimately, a collaborative effort between researchers, clinicians, regulators, and industry stakeholders is needed to establish internationally standardized measurement protocols and reference data to improve the comparability of neurofilament results in general.
Conclusion
Our study fills the gap of epidemiological biomarker research and demonstrates that population-level data significantly enhances the prognostic and diagnostic utility of neurofilaments. By contributing to the full establishment of neurofilaments as biomarkers in ALS, our study may help to address critical challenges in early diagnosis, prognostic assessment, and therapeutic development.
Acknowledgments
We thank Ilonka Kraft-Oberbeck, Ines Dobias, and Nicola Lämmle for their excellent fieldwork and Gertrud Feike, Sarah Enderle, and Birgit Och for their excellent data management and technical support. The ALS registry Swabia and this study have been supported by the German Research Council (DFG, main number 577631). Open Access funding enabled and organized by Projekt DEAL.
Author Contributions
S.W., A.C.L., H.T., G.N., and D.R. contributed to the conception and design of the study; S.W., A.H., G.N., A.R., D.R., R.S.P., H.B., A.B., S.D., M.S., M.H., A.K., C.O., A.N., N.S., A.L., C.A., F.B., S.H., D.B., W.R., U.W., B.M., J.S., J.D., H.T., and A.C.L. contributed to the acquisition and analysis of data; S.W., J.D., and A.C.L. contributed to drafting the text or preparing the figures.
We thank all members of the ALS Registry Swabia study group for their contributions; the members of the study group are listed in the Supplement to the manuscript.
Potential Conflicts of Interest
All authors declare that they have no financial or non-financial competing interests directly related to the content of the manuscript.
Appendix A
A.1 Members of the ALS Registry Study Group in Alphabetical Order
Alber, B., Klinikum Guenzburg, Department of Neurology.
Andres F., Kreiskliniken Reutlingen, Department of Neurology.
Arnold G., Klinikum Sindelfingen-Boeblingen, Department of Neurology.
Asshauer I., Klinikum Friedrichshafen, Department of Psychiatry and Psychotherapy.
Baezner H., Katharinenhospital Stuttgart, Department of Neurology.
Baier H., ZFP Südwürttemberg Weissenau, Department of Epileptology.
Baumgärtner J., BKH Augsburg, Department of Psychiatry.
Beattie J., Ostalb-Klinikum Aalen, Department of Neurology.
Becker T., University of Ulm, Klinikum Günzburg, Department of Psychiatry and Psychotherapy II.
Behne F., ZFP Südwürttemberg Weissenau, Department of Epileptology.
Bengel D., Oberschwabenklinik Ravensburg, Department of Neurology.
Bergmeier C., Kliniken Landkreis Heidenheim, Department of Neurology.
Boertlein A., Katharinenhospital Stuttgart, Department of Neurology.
Born Ch., Psychiatrie Schwäbisch Hall & PMU Nürnberg, Department of Psychiatry.
Bracknies, V., Department of Neurology, Dietenbronn.
Broer R., Klinikum am Weissenhof, Weinsberg, Department of Psychiatry and Psychotherapy.
Bürgy M., Klinikum Stuttgart, Department of Psychiatry.
Buttmann M., Caritas Krankenhaus, Bad Mergentheim, Department of Neurology.
Clauer-Bredt M., Christophsbad Goeppingen, Department of Neurology.
Connemann B., University of Ulm, Department of Psychiatry and Psychotherapy III.
Dempewolf S., Klinikum Ludwigsburg, Department of Neurology.
Demuth K., Vinzenz von Paul Hospital Rottweil, Department of Neurology.
Dettmers C., Schmieder Kliniken Konstanz, Department of Neurology.
Dieterich M., LMU München, Department of Neurology.
Etzersdorfer E., Furtbachkrankenhaus Stuttgart, Department of Psychiatry and Psychotherapy.
Förch Ch., Klinikum Ludwigsburg, Department of Neurology.
Freund W., Neurologische Praxis Biberach.
Friederich H., ZfP Zwiefalten, Departmement of Geriatric Psychiatry.
Gahr M., Uniklinik Ulm, Department of Psychiatry III.
Gasser T., Universitaetsklinikum Tuebingen, Department of Neurology.
Gebhardt J., ZfP Wiesloch, Department of Geriatric Psychiatry.
Gecui I., BKH Memmingen, Department of Psychiatry.
Gersner T., ZfP Zwiefalten, Department of Psychiatry and Psychotherapy.
Geser F., Christophsbad Göppingen, Department of Psychiatry.
Gogolkiewicz A., ZfP Zwiefalten, Departement of Psychiatry.
Gold H.-J., Klinikum am Gesundbrunnen Heilbronn, Department of Neurology.
Greber R., Vinzenz v. Paul Hospital Rottweil, Department of Geriatric Psychiatry.
Grunze H., Psychiatrie Schwäbisch Hall & PMU Nürnberg, Department of Psychiatry.
Hacke W., University of Heidelberg, Department of Neurology.
Hamann G., Klinikum Günzburg, Department of Neurology.
Hecht M., Bezirkskrankenhaus Kaufbeuren, Department of Neurology.
Heimbach B., University of Freiburg, Department of Neurology.
Hemmer B., TU Muenchen, Department of Neurology.
Hendrich C., Klinikum Friedrichshafen, Department of Neurology.
Henkel K., Christophsbad-Göppingen, Departement of Geriatric-Psychiatry.
Herting B., Diakonie-Klinikum Schwäbisch Hall, Department of Neurology.
Hewer W., Christophsbad Göppingen, Department of Geriatric-Psychiatry.
Höglinger G., TU Muenchen, Department of Neurology.
Huber R., Klinikum Friedrichshafen, Department of Neurology.
Huber-Hartmann K., Kliniken Landkreis Heidenheim, Department of Neurology.
Huelser P.-J., Fachklinik Wangen, Department of Neurology.
Jöbges M., Schmieder Kliniken Konstanz, Department of Neurology.
Jonuz A., Klinikum Schloss Winnenden, Department of Geriatric Psychiatry.
Joos A., Kliniken Schmieder Gailingen, Department of Psychotherapeutic Neurology.
Jüttler E., Ostalb-Klinikum Aalen, Department of Neurology.
Kammerer-Ciernioch J., Klinikum am Weissenhof, Weinsberg, Department of Psychiatry and Psychotherapy.
Kaspar A., Oberschwabenklinik Ravensburg, Department of Neurology.
Kern R., Klinikum Kempten, Department of Neurology.
Kimmig H., Kliniken Schwenningen, Department of Neurology.
Klebe, S., University of Würzburg, Department of Neurology.
Kloetzsch C., Schmieder Kliniken Allensbach, Department of Neurology and Hegau-Bodensee-Klinikum Singen, Department of Neurology.
Klopstock T., LMU München, Department of Neurology.
Köhler M., ZfP Zwiefalten, Departement of Geriatric Psychiatry.
Kohler A., Klinikum am Gesundbrunnen Heilbronn, Department of Neurology.
Kozian R., Vinzenz v. Paul Hospital Rottweil, Department of Geriatric Psychiatry.
Kuethmann A., Bezirkskrankenhaus Memmingen, Department of Psychiatry and Psychotherapy.
Laske Ch., Uniklinik Tübingen, Departement of Geriatric Psychiatry.
Lewis D., Marienhospital Stuttgart, Department of Neurology.
Lichy C., Klinikum Memmingen, Department of Neurology.
Lindner A., Marienhospital Stuttgart, Department of Neurology.
Lingor P., TU München, Department of Neurology.
Lulé D., Ulm University, Department of Neurology.
Maier-Janson W., private practice, Ravensburg.
Mäurer M., Caritas Krankenhaus Bad Mergentheim, Department of Neurology.
Metrikat J., Bundeswehrkrankenhaus Ulm, Department of Neurology.
Meudt O., Klinikum Memmingen, Department of Neurology.
Meyer A., Weissenau, Department of Neurology.
Michaelides A., Furtenbachkrankenhaus Stuttgart, Department of Psychiatry.
Müller vom Hagen J., University of Tuebingen, Department of Neurology.
Munk M., Uniklinik Tübingen, Department of Geriatric Psychiatry.
Naegele A., Christophsbad Goeppingen, Department of Neurology.
Naumann M., Universitätsklinikum Augsburg, Department of Neurology and Neurophysiology.
Neher K.-D., Vinzenz von Paul Hospital, Rottweil, Department of Neurology.
Neuhaus O., Kliniken Landkreis Sigmaringen, Department of Neurology.
Neusch C., Praxis EMSA Singen.
Niehaus L., Klinikum Winnenden, Department of Neurology.
Niestroj A., ZfP Wiesloch, Departement of Geriatric Psychiatry.
Opherk C., Klinikum am Gesundbrunnen Heilbronn, Department of Neurology.
Pinkhardt E., Klinikum Kempten, Department of Neurology.
Raape J., ZFP Südwürttemberg Weissenau, Department of Neurology.
Ratzka P., Universitätsklinikum Augsburg, Department of Neurology and Neurophysiology.
Reinhard M., Kliniken Esslingen, Department of Neurology.
Rettenmayr C., Klinikum Esslingen, Department of Neurology.
Riepe MW., Klinikum Günzburg, Department of Gerontopsychiatry.
Rothmeier J., ZFP Südwürttemberg Weissenau, Department of Neurology.
Ruchsow M., Christophsbad Göppingen, Department of Psychiatry.
Sabolek M., Klinik Biberach, Department of Neurology.
Schabet M., Klinikum Ludwigsburg, Department of Neurology.
Schaeff-Vogelsang M., Diakonie-Klinikum Schwaebisch Hall, Department of Neurology.
Schell C., Kreiskliniken Reutlingen, Department of Neurologie.
Schläger A., Kliniken Esslingen, Department of Neurology.
Schlipf T., Klinikum Winnenden, Department of Psychiatry and Psychotherapy.
Schmauss M., Bezirkskrankenhaus Augsburg, Department of Psychiatry and Psychotherapy.
Schoels L., University of Tübingen, Department of Neurology.
Schöneberger-Stroick K., BKH Memmingen, Department of Psychiatry.
Schörner K., Kliniken Schmieder Gailingen, Department of Psychotherapeutic Neurology.
Schuetz K., Kliniken Schwenningen, Department of Neurology.
Schweigert B., Caritas Krankenhaus Bad Mergentheim, Department of Neurology.
Sheka C., Klinikum Schloss Winnenden, Department of Geriatric Psychiatry.
Sommer N., Christophsbad Goeppingen, Department of Neurology.
Spannhorst S., Klinikum Stuttgart, Department of Mental Health and Geriatry.
Sperber W., Kliniken Esslingen, Department of Neurology.
Steber C., Bezirkskrankenhaus Augsburg, Department of Psychiatry and Psychotherapy.
Steber R., Bezirkskrankenhaus Memmingen, Department of Psychiatry and Psychotherapy.
Stroick M., Klinikum Memmingen, Department of Neurology.
Synofzik, M., Universitaetsklinikum Tuebingen, Department of Neurology.
Thomas Ch., Klinikum Stuttgart, Department of Mental Health and Geriatry.
Trottenberg T., Klinikum Winnenden, Department of Neurology.
Tumani H., Fachklinik Dietenbronn, Department of Neurology.
Vasic N., Christiophsbad Göppingen, Department of Psychiatry.
Volkmann J., University of Wuerzburg, Department of Neurology.
Wahl C., Klinikum Kempten, Department of Neurology.
Weber F., Bundeswehrkrankenhaus Ulm, Department of Neurology.
Weiler M., University of Heidelberg, Department of Neurology.
Weiller C., University of Freiburg, Department of Neurology.
Wessig C., University of Würzburg, Department of Neurology.
Wick, W., University of Heidelberg, Department of Neurology.
Winkler A., TU München, Department of Neurology.
Zeller D., University of Wuerzburg, Department of Neurology.
Open Research
Data Availability
The data that support the findings of this study are stored at Ulm University, Institute for Epidemiology and Medical Biometry. Due to ethical restrictions regarding data protection issues and the study-specific consent text and procedure, the data cannot be made publicly available, but data are available from the authors upon reasonable request and with permission from the ALS registry Swabia study board.


