Examining Food Purchase Behavior and Food Values During the COVID-19 Pandemic
Abstract
The COVID-19 pandemic has altered conceptions of “normal” globally, including food purchasing and acquisition decisions. In this paper, we surveyed a panel of 1,370 U.S. households four times during the COVID-19 pandemic from mid-March to late April 2020. With this unique panel, we observe changes in food expenditures, shopping behaviors, and food values as the pandemic evolved. Our results reveal reductions in food-away-from-home expenditures and increases in online grocery shopping. Food values appear to be fairly stable in the early stages of the pandemic; however, decreases in the importance of price and nutrition reveal tradeoffs households make during the pandemic.
Introduction
The COVID-19 pandemic has created enormous societal disruptions in the United States and elsewhere with serious implications for employment, travel, education, and business owners. Media sources have reported widely on the negative effects of the pandemic on retail markets (e.g., see Leatherby and Gelles 2020). Overall, we have seen substantial decreases in the sales of many goods, particularly durable goods, in the second quarter of 2020. During this time, discussions in the popular press about the effects of COVID-19 on food and agricultural markets include the effects for farmers, processors, retailers, and consumers. For food markets, economists have written about the largely altered patterns of household expenditures on food (Goddard 2020), with an emphasis on the major shift from food service sales to food retail sales during the pandemic. Additionally, an outward shift in online purchasing has also impacted food and beverage markets (Albrecht 2020).
Early evidence from US food retail markets, between March and July 2020, shows that sales for most food categories have increased, and increased substantially in some cases. The magnitude of such changes dampened in May and June 2020, relative to changes observed in late-March and April 2020 (Statista 2020). To date, academics have had limited access to detailed household food purchase data, so it is difficult to assess the tradeoffs that consumers have made between brands, price, and quality points, and across retailers. However, based on aggregate changes in sales within and across food categories, economists and other pundits expect that food consumers have shifted purchasing patterns towards lower-priced foods with a greater shelf life. Consumers may be less interested in certain credence attributes (Cranfield 2020); these general shifts imply that consumers have shifted their “food values” (Lusk and Briggeman 2009) during the pandemic. The primary objective of this research is to understand the changes in food purchases that households made during the opening weeks of the COVID-19 pandemic in the US and to assess if consumers altered the set of specific values or characteristics embedded in their bundle of food and beverage products.
Our research uses data from a longitudinal survey with a panel of consumers collected during the pandemic. Beginning March 13, 2020, and then biweekly over six weeks, we asked panelists questions about their purchases in specific food categories, in specific types of food retailers, and for specific purchase attributes or characteristics across all food purchases. The first round of our survey coincided with early school closures and stockpiling behavior among consumers. The second round began at the same time that many states began to issue shelter-in-place orders. The third round began as eligible households were expecting (and possibly receiving) the Coronavirus Aid, Relief, and Economic Security (CARES) Act payments from the federal government. Our fourth round began as some states began to unveil their phased reopening plans. Overall, the data from our rapid panel design survey allow us the unique opportunity to comment on how food purchase behavior initially responded to COVID-19 and how consumers' shopping habits and purchasing behavior evolved during the first phase of the quarantine in the United States.
Background
The Food Expenditure Series, published by the U.S. Department of Agriculture, is widely used to examine household food purchasing behavior. This series measures expenditures for both food at home (FAH) and food away from home (FAFH) purchases (Saksena et al. 2018). Between 1988 and 2018, the share of FAFH expenditures has steadily increased relative to FAH expenditures (Saksena et al. 2018). In 2019, FAFH expenditures accounted for 54.8% of total food expenditures (USDA ERS 2020). While many factors likely contribute to this growth, Saksena et al. (2018) point to changes in income (FAFH expenditures increase with income, as it is considered a luxury good); household time allocation (more dual-income households, resulting in less time for meal preparation and more demand for FAFH); household structure; and FAFH advertising as important factors that influence FAFH expenditures.
The COVID-19 pandemic has directly impacted FAH and FAFH expenditures. In many jurisdictions, government policies at the state or city level, mandated closures of restaurants and other FAFH venues (e.g., bars, theaters, sporting events) to “flatten the curve.” In contrast, local authorities listed grocery stores as essential businesses. As a result, FAFH expenditures necessarily declined while FAH expenditures increased. Many FAFH establishments have now reopened in some capacity. However, the speed that FAFH expenditures will rebound is unknown, given the longevity of the pandemic and public health recommendations for sustained social distancing.
Further, many of the factors related to FAFH growth may no longer hold in the era of COVID-19. The pandemic has led to a surge in US unemployment. The rates are on par with the Great Depression (Kochhar 2020). Such negative income shocks mean households are cutting back, and FAFH is more likely to be cut than FAH, as FAFH operates like a luxury good. The rise in unemployment also means that household members may have more time to devote to meal planning and preparation, resulting in reduced FAFH expenditures (Saksena et al. 2018). Such factors contributed to reduced FAFH expenditures in the US during the Great Recession of 2007–2009 (Saksena et al. 2018).1 The combination of operational constraints for many restaurants and the dramatic and sudden increases in unemployment may lead to larger reductions in FAFH.
In addition to changes in food expenditures, the COVID-19 pandemic may impact individual food shopping behaviors. One of the most notable changes in behavior thus far has been households' stockpiling behavior. Stockpiling is likely the result of perceived and actual scarcity (Ellison et al. 2020). The implementation of shelter-in-place orders likely resulted in early stocking-up behavior, as households looked to fill their pantries and freezers because they were uncertain when they could return to the store. The unfamiliarity of empty store shelves (a product of the early stockpiling behavior) increased fear and uncertainty about future food prices and availability, which further exacerbated stockpiling and stock-outs in grocery stores (Ehlen, Bernard, and Scholand 2009; Lusk and McCluskey 2020). COVID-19 has also changed how people are shopping; households are taking fewer in-person trips to the grocery store, and more households are engaging with online grocery shopping (IFIC 2020; Redman 2020). Households are changing where they shop. For example, households that experience negative income shocks may adjust where they shop by going to low-cost retailers or acquiring food through food pantries or food shelves.
As households adjust where they spend their food dollars and how they shop for food during the pandemic, the effect on the types and nutritional quality of foods purchased is less clear. Research using detailed scanner data in the United States (see Kuchler 2011; Cha, Chintagunta, and Dhar 2015) and the United Kingdom (see Griffith, O'Connell, and Smith 2016) examined the effect of the Great Recession on the composition of food retail sales. Overall, this research finds that the Recession had a limited effect on the caloric quantity or the nutritional quality of the foods purchased; evidence suggests that the Great Recession affected other attributes, including convenience. Other research shows that the Great Recession led to an improvement in nutritional intake, given the increase in the share of FAH (Todd and Morrison 2014). Economists predict that the negative economic effects from COVID-19 will be substantially larger than those in 2008–09, at least in the short run. However, the economic decline of the pandemic has different origins and appears different than the Great Recession (Kochhar 2020; Sheiner 2020). Thus, the predicted changes in consumer purchasing in 2020 may not look like the changes in 2008–2009. In particular, the economic stress, social circumstances, and the various constraints facing consumers shopping in grocery stores due to COVID-19 may have much greater implications on convenience and nutrition. Currently, evidence suggests that households are purchasing more “comfort” foods (e.g., pizza, pasta, ice cream) during the pandemic (Creswell 2020). These foods are typically more processed and calorie-dense. Thus, predicting whether any nutrition or health gains will occur from increased FAH expenditures is difficult.
Household food purchases are, in part, driven by the underlying food values of the primary shopper(s) in the household. The Centers for Disease Control and Prevention (CDC) in the National Health and Nutrition Examination Survey (NHANES) conducted a consumer food module soliciting the factors that drive consumer choices at grocery stores. In the last use of the module (2009–2010), the relative importance of the five factors (or values) from high to low was taste, nutrition, storability, price, and ease of preparation (CDC 2013). More recently, food industry surveys also indicate that taste is the main driver of food choices, followed by price, healthfulness, convenience, and environmental sustainability (IFIC 2020). Lusk and Briggeman (2009) proposed a broader set of food values that may influence choice (taste, price, nutrition, environmental impact, appearance, convenience, safety, origin, fairness, tradition, naturalness). They found that, on average, consumers overwhelmingly value safety, followed by nutrition, taste, and price. Preferences for the top values have been fairly stable through time (Lusk 2018;2. IFIC 2020). However, the literature has scant evidence of how significant economic shocks like COVID-19 impact food values. The sharp increase in unemployment, coupled with rising food prices, could lead some households to place more importance on price relative to other factors. Further, households may place greater emphasis on storability, given the observed increases in stockpiling behavior during the COVID-19 pandemic.
Our research offers new evidence on how US households' food expenditures, purchasing behaviors, and values respond to the COVID-19 pandemic. Previous studies have attempted to look at changes in food behaviors from other economic shocks, like the Great Recession. These studies rely on large national datasets that lack the flexibility to survey households rapidly (and repeatedly) as economic conditions change, and often experience significant lags between survey fielding and data release. Further, the “sudden” nature of this pandemic means changes in behavior are occurring more quickly; therefore, our rapid panel design study allows us to observe and describe these changes across a large number of US households.
Survey and Methods
The questions in our survey measure the effects of COVID-19 on stated food spending behavior for both FAH and FAFH, changes in purchases of certain types of food, changes in online grocery shopping behavior, and the relative importance of food values. The Tufts University Institutional Review Board and COVID-19 Research Oversight Committee approved all questions and procedures before data collection. This study uses a unique panel dataset with 1,370 respondents who completed four rounds of data collection. The start of each data collection round was approximately two weeks apart. The first round of collection began on March 13 (Stocking Up), the second round on March 27 (Shelter-in-Place Orders), the third round on April 10 (CARES Payment Distribution), and the final round on April 24 (Reopening Plans Released). The characteristics of respondents that participated in all four rounds of data collection are in table 1.3
| Characteristics | Proportion of the Sample |
|---|---|
| Age | |
| 18–24 years | 0.80 |
| 25–34 years | 7.74 |
| 35–44 years | 14.16 |
| 45–54 years | 15.69 |
| 55–64 years | 28.76 |
| 65 or more years | 32.77 |
| Prefer not to answer | 0.07 |
| Education | |
| Some High School | 1.09 |
| High School Diploma / GED | 13.28 |
| Associates or Technical Degree | 9.12 |
| Some College | 18.03 |
| Bachelor's Degree | 34.74 |
| Advanced Degree | 23.58 |
| Prefer not to answer | 0.15 |
| Household Income | |
| Under $25,000 per year | 16.13 |
| $25,000–$49,999 per year | 20.00 |
| $50,000–$74,999 per year | 17.23 |
| $75,000–$99,999 per year | 12.92 |
| $100,000 or more per year | 33.72 |
| Prefer not to answer | 0.00 |
| Race | |
| White/Caucasian | 66.50 |
| Black/African American | 9.85 |
| Hispanic or Latino/a or Latinx | 11.53 |
| American Indian or Alaska Native | 1.46 |
| Asian/Pacific Islander | 8.25 |
| Other | 2.41 |
| Prefer not to answer | 0.00 |
| Geographic Region | |
| Northeast | 18.76 |
| South | 36.93 |
| Midwest | 18.61 |
| West | 25.69 |
| Sex | |
| Male | 58.69 |
| Female | 41.24 |
| Other | 0.07 |
We developed the food acquisition question from the Flexible Consumer Behavior Survey (FCBS) Module of the 2017–2018 round of NHANES (CDC 2017).4 We measured stated food spending behavior for FAH and FAFH during COVID-19 by asking respondents:
- During the past (X) days, how much money did your family or did you spend at supermarkets or grocery stores?
- During the past (X) days, how much money did your family or did you spend on food at stores other than grocery stores (gas stations, corner stores, convenience stores, bodegas, etc., but not restaurants)?
- During the past (X) days, how much money did your family or did you spend on eating out?
- During the past (X) days, how much money did your family or did you spend on food carried out or delivered?
The response options were in a drop-down menu in $50 increments ranging from $0, $1–49, $50–99, $100–149, to $1,000 or more. For the estimated expenditure, we took the midpoint of the ranges and converted $1,000 or more to $1,050. Respondents could answer the question on a weekly (X = 7 days) or monthly (X = 30 days) basis. We standardized all responses to a weekly basis by dividing the monthly midpoints by 4.3.
To determine the effect of COVID-19 on purchasing patterns for certain types of food, we asked respondents the following question: Because of the Coronavirus (COVID-19), how have you changed food purchases this week compared to a typical week? We asked this question for the following products (i) washed and packaged salad greens; (ii) frozen vegetables; (iii) shelf-stable, not refrigerated milk; (iv) canned fish or meats; (v) eggs; and (vi) dry staples (e.g., rice, pasta, etc.). We chose several storable products and a few more perishable products relevant to other parts of the larger survey. With these questions, we intended to document potential household stockpiling behavior. The response options were on a five-point Likert scale (1 = Bought a lot less, 2 = Bought a little less, 3 = Bought the same as before, 4 = Bought a little more, and 5 = Bought a lot more). The response option “never purchase” was also available for respondents. We also asked respondents: “During the past 30 days, did you acquire food from any other source? (check all that apply).” We asked respondents about purchases at other stores that were not grocery stores (convenience stores, corner stores, bodegas, and others). For the two retailer categories, we also asked individuals to estimate their nonfood purchases. Thus, we know food and nonfood purchases at the two broad retail categories. In our analysis, we focus on the frequency of responses to online groceries to determine changes in shopping format preferences during the pandemic.
We adapted questions from the 2009–2010 Flexible Consumer Food Behavior Survey (CDC 2009) to assess food values. We asked, “When you buy food from a grocery store or supermarket, how important is…?”: (i) How easy the food is to prepare, (ii) Nutrition, (iii) Price, (iv) How well the food keeps after it is bought, and (v) Taste. The potential response options were given using a five-point Likert scale (1 = Not at all important, 2 = Slightly important, 3 = Moderately important, 4 = Very important, and 5 = Extremely important). Respondents could also choose “I don't know” or “I prefer not to answer.”
Statistical Analysis
To illustrate the relationship of the changes in the pandemic on food acquisition behaviors, we use one-way analysis of variance (ANOVA) to test hypotheses for several of the questions. First, ANOVA was used to test the overall hypotheses and determine if mean spending was equal between FAH and FAFH outlets across the four rounds of data collection. We then assessed if mean changes in purchasing were equal for all types of foods across the four rounds. Finally, we tested whether mean levels of importance for food values were equal across the four rounds. If the test rejected the null hypothesis, we conducted comparisons using a Tukey's Honest Significant Difference test. Additionally, if tests rejected the overall hypothesis, we used an ANOVA to determine differences within each round of data.
Results
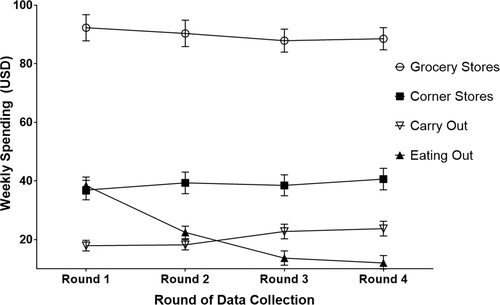
Stated spending on FAH and FAFH is in figure 1. Mean spending was not equal across FAH and FAFH outlets (F statistic = 1,564.18; p-value <0.001), and, as expected, most spending occurred at grocery stores. The second most spending occurred at corner stores, and no difference occurred between spending on eating out or carryout. A substantial shift occurred in spending on eating out. As shown in Appendix S1 table 1, respondents spent similar amounts on eating out and at corner stores in round 1. Spending on eating out decreased in round 2 and was similar to carryout. Then, expenditures on eating out decreased even more and were lower than all other outlets in rounds 3 and 4. Changes in spending on FAH and FAFH are in table 2. While slight changes occurred in spending on FAH over the data collection rounds, the major changes in spending occurred on FAFH. Both FAFH models were significant, though with heterogeneous changes in spending. Spending on eating out decreased while spending on carryout foods increased.
| Spending at Grocery Stores | Spending at Corner Stores | Spending on Eating Out | Spending on Carry Out | |
|---|---|---|---|---|
| Intercept | 92.313*** | 36.864*** | 38.382*** | 17.923*** |
| (2.285) | (1.699) | (1.488) | (0.921) | |
| Round 2 | −1.941 | 2.455 | −15.939*** | 0.287 |
| (2.442) | (1.911) | (1.380) | (0.950) | |
| Round 3 | −4.398** | 1.610 | −24.696*** | 4.816*** |
| (2.227) | (1.822) | (1.652) | (1.169) | |
| Round 4 | −3.751* | 3.754** | −26.358*** | 5.791*** |
| (2.115) | (1.869) | (1.595) | (1.187) | |
| N | 5,475 | 5,473 | 5,475 | 5,474 |
| # of Clusters | 1,370 | 1,370 | 1,370 | 1,370 |
| Model F Statistic | 1.57 | 1.43 | 98.51*** | 11.77*** |
- Note: Stated spending is in USD per week. Clustered standard errors are in parentheses. *, **, and *** denote significance levels at 0.10, 0.05, and 0.01, respectively.
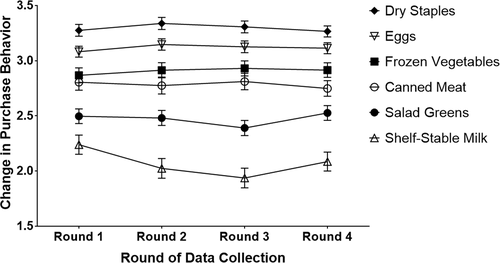
As shown in figure 2, purchasing behavior varied by food type (F statistic = 662.54; p-value <0.001). Consumers reported increasing purchases of dry staples the most, and the differences in means were significant across all food types. The largest change in purchasing behavior across the rounds occurred for shelf-stable milk (see table 3), which significantly decreased in all subsequent rounds. Purchases of eggs and dry staples in the second round and salad greens in the third round declined; however, the decreases were small. Appendix S1 table 2 shows that there were small changes in the groupings of food types within rounds.
| Salad Greens | Frozen Vegetables | Shelf-Stable Milk | Eggs | Dry Staples | Canned Meat | |
|---|---|---|---|---|---|---|
| Intercept | 2.496*** | 2.867*** | 2.238*** | 3.081*** | 3.275*** | 2.804*** |
| (0.034) | (0.034) | (0.044) | (0.025) | (0.027) | (0.037) | |
| Round 2 | −0.015 | 0.046 | −0.215*** | 0.065** | 0.063** | −0.030 |
| (0.035) | (0.034) | (0.049) | (0.026) | (0.029) | (0.037) | |
| Round 3 | −0.107*** | 0.063* | −0.302*** | 0.045 | 0.031 | 0.007 |
| (0.035) | (0.034) | (0.049) | (0.029) | (0.029) | (0.037) | |
| Round 4 | 0.030 | 0.047 | −0.153*** | 0.032 | −0.009 | −0.060 |
| (0.035) | (0.032) | (0.049) | (0.028) | (0.028) | (0.037) | |
| N | 5,478 | 5,477 | 5,479 | 5,475 | 5,478 | 5,479 |
| # of Clusters | 1,370 | 1,370 | 1,370 | 1,370 | 1,370 | 1,370 |
| Model F Stat | 7.03*** | 1.26 | 13.29*** | 2.10* | 2.92** | 1.56 |
- Note: Purchasing intentions were coded as: 0 = never purchase, 1 = bought a lot less, 2 = bought a little less, 3 = bought the same as before, 4 = bought a little more, 5 = bought a lot more. Clustered standard errors are in parentheses. *, **, and *** denote significance levels at 0.10, 0.05, and 0.01, respectively.
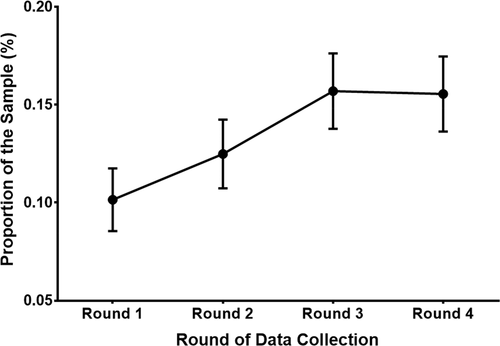
Approximately 10% of the sample shopped for groceries online in the first round of data collection. As shown in figure 3, this proportion climbed in the second round. The proportion plateaued at around 15% in Rounds 2 and 3 (see table 4). This change represents a 50% increase in participants who stated that they used online grocers relative to the first round.
| Online Grocery Shopping | |
|---|---|
| Intercept | 0.101*** |
| (0.008) | |
| Round 2 | 0.023*** |
| (0.008) | |
| Round 3 | 0.055*** |
| (0.010) | |
| Round 4 | 0.054*** |
| (0.010) | |
| N | 5,480 |
| # of Clusters | 1,370 |
| Model F Stat | 13.85*** |
- Note: Online grocery shopping was coded as 1 if a respondent indicated purchasing groceries online, and 0 otherwise. Clustered standard errors are in parentheses. *, **, and *** denote significance levels at 0.10, 0.05, and 0.01, respectively.
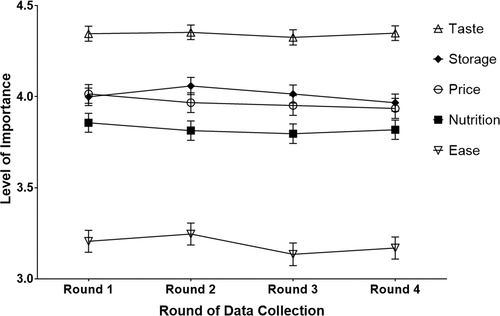
The level of importance varied by food value (taste, price, nutrition, ease of preparation, and storage) (F statistic = 966.44; p-value <0.001); as shown in figure 4, taste was the most important food value, and ease of preparation was the least important. The mean importance of nutrition was less than the means for both price and storage. Appendix S1 table 3 shows that there were no changes in the groupings of food values within each round. The importance of taste did not change over the rounds of data collection (see table 5). Ease of preparation, nutrition, and price had significant decreases in importance over the rounds. Storage had a significant increase; however, the magnitudes of these changes, while statistically significant, are small.
| Ease | Nutrition | Price | Storage | Taste | |
|---|---|---|---|---|---|
| Intercept | 3.206*** | 3.857*** | 4.015*** | 3.999*** | 4.346*** |
| (0.031) | (0.0264) | (0.026) | (0.025) | (0.021) | |
| Round 2 | 0.040 | −0.0433* | −0.048** | 0.059** | 0.0078 |
| (0.028) | (0.022) | (0.023) | (0.025) | (0.020) | |
| Round 3 | −0.071** | −0.060*** | −0.064*** | 0.015 | −0.020 |
| (0.028) | (0.023) | (0.023) | (0.026) | (0.021) | |
| Round 4 | −0.037 | −0.038* | −0.080*** | −0.032 | 0.003 |
| (0.027) | (0.022) | (0.0230) | (0.026) | (0.020) | |
| N | 5,449 | 5,454 | 5,463 | 5,451 | 5,470 |
| # of Clusters | 1,370 | 1,370 | 1,370 | 1,369 | 1,370 |
| Model F Stat | 5.86*** | 2.57* | 4.45*** | 4.79*** | 0.74 |
- Note: Importance of food values were coded as: 1 = Not at all important, 2 = Slightly important, 3 = Moderately important, 4 = Very important, and 5 = Extremely important. The “I don't know” and “I prefer not to answer” responses were removed for estimation. Clustered standard errors are in parentheses. *, **, and *** denote significance level at 0.10, 0.05, and 0.01, respectively.
Discussion and Conclusion
The COVID-19 pandemic has fundamentally altered what is “normal” globally, touching all aspects of life, including food purchasing and acquisition decisions. We surveyed a panel of 1,370 US households at four different points during the COVID-19 pandemic from mid-March to late April 2020. Results from our research reveal three important insights about households' response to COVID-19 as it relates to food purchasing behavior.
First, as expected, food expenditures changed. Expenditures on FAFH significantly declined over the period studied in our survey. Within FAFH, we saw that reduced expenditures on eating out drove the decrease; however, increases in carryout orders offset some of this reduction. This result aligns with many states issuing shelter-in-place orders and restricting foodservice operations to allow only carryout sales. Many states began relaxing restrictions on restaurants in May and June (after our study was complete), so expenditures on eating out may have rebounded somewhat in June and July 2020. However, as cases continue to surge in the United States, many states have been reinstating restrictions, particularly on bars and restaurants, which is likely to drive eating out expenditures down again.
Second, we observed a significant increase in the proportion of households who use online grocery shopping. We expect this trend to continue as states slow down reopening efforts and encourage individuals to shelter in place and social distance as much as possible. The online SNAP pilot was in effect and also expanded during the pandemic (USDA 2020). Online shopping could fundamentally reshape access and food choice for the immediate future and the long term.
Third, the food values that we studied appear to be stable over the pandemic and align with findings from other studies showing that taste is a driving factor of food purchases. However, the reductions in importance for nutrition and price, in particular, reveal the tradeoffs households are willing to make in times of scarcity (perceived or actual). This result is important: It shows that these tradeoffs observed during COVID-19 are larger than the effects in studies that focused on the Great Recession (e.g., Ng, Slining, and Popkin 2014).
While this study focused on food expenditures and shopping behavior of the average US household, future research should explore potential heterogeneity across households. Responses to the pandemic likely vary by income and geographical region, for example. As the data on changes in employment differ by race and ethnicity as well as income level (Kochhar 2020), the changes in food consumption patterns may have changed differentially for these groups. As a result, the pandemic could exacerbate inequalities and disparities in food access and nutrition. Low-income households or households that experienced negative income shocks due to COVID-19 may not have the financial resources to engage in any stockpiling behavior relative to higher-income households. Future research should consider how the pandemic affects long-term disparities in food and nutrition for disadvantaged populations. Further, households that live in regions that adopted more aggressive quarantine measures (e.g., Illinois, Massachusetts, and New York) may see greater changes in FAH and FAFH expenditures than households that live in regions where FAFH establishments remained open. Future research should also consider how the dietary quality of food purchases may change in response to COVID-19 across subgroups in the United States.
Acknowledgments
Funding for this project came from the Agricultural and Food Research Initiative Competitive Grant no. 2016-67023-24817 from the USDA National Institute of Food and Agriculture (NIFA), and through USDA Hatch project NYC-121837. Any opinions, findings, conclusions, or recommendations expressed in this publication are those of the authors. They do not necessarily reflect the view of NIFA or the United States Department of Agriculture (USDA). Norbert Wilson contributed to the research while on faculty at the Friedman School of Nutrition Science and Policy at Tufts University.
REFERENCES
- 1 The reduction in FAFH expenditures was driven by decreases in spending at full-service restaurants, specifically. Fast food restaurants did not experience a decline during the Great Recession (Saksena et al. 2018).
- 2 Jayson Lusk, “Food Demand Survey (FooDS) Finale—at Least for Now.” Jayson Lusk (blog), May 21, 2018. http://jaysonlusk.com/blog/2018/5/21/food-demand-survey-foods-finale-at-least-for-now
- 3 Our goal was to produce a nationally representative survey, and we recruited in a way that would achieve that in Wave 1. However, given the panel design of the study, we had less control on who continued to participate in the study and who dropped out. As such, our final sample of respondents that completed all four rounds of the study is older, more educated, less racially diverse, and has a higher proportion of males relative to the US population.
- 4 We pretested the survey with approximately 10 respondents along with a focus group discussion of the survey to identify potential sources of confusion among respondents. We made no changes to the survey components that are in this paper. As some of our questions are from NHANES, the CDC reports that they extensively pretest their surveys before implementation in the field (CDC 2020).


