Rapid and Sensitive Quantum Dots Immunochromatographic Strip for H10 Subtype Avian Influenza Virus Detection
Abstract
The H10 subtype avian influenza virus (AIV), an important zoonotic pathogen, is widely prevalent in host species (wild fowl) and continues to infect humans, imposing a huge threat to public health. Thus, the H10 subtype AIV is considered a potential pandemic strain and has drawn the attention of scholars worldwide. Therefore, a fast, sensitive, and economical detection method for H10 subtype AIV needs to be developed for the surveillance and prevention of this infection. Quantum dot fluorescent microsphere-based immunochromatographic strip (QDFM-ICS) has a great application prospect in the rapid detection of the virus. In this study, two monoclonal antibodies (1E8 and 2G9) were generated by immunizing mice with the purified hemagglutinin (HA) protein, and QDFM-ICS was designed to detect the H10 subtype influenza antigen. We illustrated that the limit of detection (LOD) of QDFM-ICS for the HA titer and purified HA protein of the H10 subtype AIV was 0.125 per 80 μL of the sample and 4 ng/mL, respectively. The specificity of QDFM-ICS was 100%, which indicated that mAb 2G9 specifically bound to the H10 subtype influenza antigen without cross-reacting with other subtype AIVs. The method has good reproducibility. Additionally, the results of preliminary tests on clinical samples showed high consistency between QDFM-ICS and real-time reverse transcription-polymerase chain reaction. The QDFM-ICS has simple analysis steps and can produce objective results within 15 min. Hence, it can be suggested that QDFM-ICS can be used to monitor and prevent the infection caused by H10 subtype AIVs.
1. Introduction
So far, 18 hemagglutinin (HA) and 11 neuraminidase (NA) subtypes of the influenza A virus have been identified based on the antigenicity of surface proteins. Most of these subtypes have been identified in the waterfowl. These subtypes are prevalent as low-pathogenic avian influenza viruses (AIVs) in wild waterfowl worldwide [1]. The H10 subtype AIV was first isolated in 1949 [2] in wild waterfowl [3, 4]. Since then, the H10 subtype has been identified in other wild aquatic birds as well. H10 viruses are known for their ability to continuously adapt to different mammalian species [2, 5]. As a result, they are capable of causing infections in humans. In 2010, Australia reported an H10N7-associated infection and influenza-like symptoms among its abattoir workers [6]. The first case of avian-origin H10N8 infection in humans, which also resulted in one death, was reported in 2013. In Jiangxi Province, China, at least three cases of H10N8 infections in humans were confirmed, two of which resulted in deaths [7, 8]. In 2021, a new H10N3 subtype influenza A virus was isolated from humans in Jiangsu Province, China. This was also the first documented case of H10N3 infection in humans [9, 10]. The second case of H10N3 infection in humans was reported from Zhejiang Province, China, in 2023 [11]. A death resulting from the H10N5 infection was reported from Zhejiang Province, China [12, 13]. The emergence of AIV H10 subtype infection in humans emphasizes the persistent and evolving threat posed by AIVs to human health. As AIVs are capable of becoming the next epidemic virus type, they are attracting increasing attention from researchers worldwide [14].
At present, the diagnostic methods available for detecting AIVs include virus isolation[15], nucleic acid-based detection [16–18], and immunoassays, such as enzyme-linked immunosorbent assay (ELISA) [19]. ELISA and reverse transcription–polymerase chain reaction (RT–PCR) are the two most recommended techniques for diagnosing avian influenza [20]. Notably, virus isolation is a highly time-consuming process, while ELISA and PCR require a perfect experimental platform and professional laboratory technicians. Consequently, these methods have limited applications. Moreover, the processing of these methods is cumbersome, and they cannot be used for point-of-care testing [21, 22]. The colloidal gold-based immunochromatographic assay is a popular detection method because it allows rapid, low-cost visualization, without any special equipment. This assay has been used for the detection of influenza virus, infectious bronchitis virus, Mycoplasma suis, and other pathogens [23]. However, colloidal gold has some limitations as well, including low sensitivity, an inability to quantify, and a subjective bias [24, 25]. Therefore, it is essential to develop sensitive, efficient, and economic detection methods to prevent and control the outbreaks of AIV [26].
Quantum dots (QDs) have been employed as a new colorimetric label in various immunochromatographic assay systems [27, 28]. QDs have excellent optical properties, including high fluorescence efficiency, broad excitation wave lengths, narrow and symmetric emission spectra, and excellent stability against photobleaching [20, 29, 30]. They have been successfully employed for food safety, biological labeling, and virus detection, such as SARS-CoV-2, influenza A virus, Zika virus, and African swine fever virus [20, 31, 32 ]
This study aims to produce two specific monoclonal antibodies (mAbs) against the HA of the H10 influenza virus and develop a QD fluorescent microsphere-based immunochromatographic strip (QDFM-ICS) to detect H10-based immunochromatographic strip (QDFM-ICS) to detect H10 subtype AIVs. The specificity of QDFM-ICS was 100%, which indicates that mAb 2G9 did not cross-react with the pathogens of other subtype AIVs. The line of detection (LOD) of QDFM-ICS was 0.125 HA units titer for the H10 subtype AIV per 80 μL of the sample. The detection limit of the purified HA protein of H10 AIV was determined to be 4 ng/mL. In addition, we performed preliminary tests using the clinical samples. The results showed high consistency between QDFM-ICS and real-time RT-PCR. The test is easy to perform and can be completed in just 15 min. Hence, QDFM-ICS can be used for point-of-care testing.
2. Materials and Methods
2.1. Cells and Virus
The Madin–Darby canine kidney (MDCK) cells were obtained from Pricella Biotechnology (Wuhan, China). These cells were cultured and placed in Dulbecco’s modified eagle medium (DMEM, Gibco, Grand Island, New York, United States) supplemented with 10% fetal bovine serum (FBS, Gibco, Auckland, New Zeland). H10 viruses isolated from chickens in eastern China were used. All the cells and AIVs were stored at -80°C. We used 9-day-old embryonated chicken eggs to propagate the H10 virus at 37°C and collected the allantoic fluid. We used the collected allantoic fluid and 1% chicken red cells to detect the H10 virus titer. In addition, we performed a tissue culture infectious dose 50 (TCID50) assay [33]. The purified HA protein of A/chicken/Zhejiang/2CP8/2014 (H10N7) was generated according to the standard procedure and stored at −80°C [34], and the GenBank accession number of HA is KP412448. All the viruses used are described in Table 1. All viruses used in the study were stored in our laboratory.
| Virus strains | QDFM- ICS | Reference real-time RT-PCR |
|---|---|---|
| A/duck/Zhejiang/D1/2013(H1N2) | — | + |
| A/duck/Zhejiang/6D10/2013(H2N8) | — | + |
| A/duck/Zhejiang/4613/2013(H3N2) | — | + |
| A/duck/Zhejiang/409/2013(H4N6) | — | + |
| A/duck/Zhejiang/6D2/2013 (H5N6) | — | + |
| A/chicken/Zhejiang/1664/2017(H6N1) | — | + |
| A/chicken/Zhejiang/DTID-ZJU01/2013(H7N9) | — | + |
| A/chicken/Zhejiang/329/2011(H9N2) | — | + |
| A/duck/Zhejiang/6D20/2013(H10N2) | + | + |
| A/chicken/Zhejiang/8615/2016(H10N3) | + | + |
| A/Zhejiang/CNIC-ZJU01/2023(H10N5) | + | + |
| A/chicken/Zhejiang/2CP8/2014(H10N7) | + | + |
| A/chicken/Zhejiang/102615/2016(H10N8) | + | + |
| A/duck/Zhejiang/71750/2013(H11N9) | — | + |
| Infectious bronchitis virus (IBV, H120) | — | ND |
| Newcastle disease virus (NDV, La Sota) | — | ND |
| Infectious bursal disease virus (IBDV, NF8) | — | ND |
| Avian paramyxovirus-4 (APMV-4, ZJ-1) | — | ND |
- Abbreviations: ND, not detected; QDFM-ICS, quantum dot fluorescent microsphere-based immunochromatographic strip; RT-PCR, reverse transcription-polymerase chain reaction.
2.2. Generation and Purification of Murine Monoclonal Antibodies
All BALB/c mice (6-week-old females) were sourced from SLAC Laboratory Animal Co. Ltd. (Shanghai, China). These mice were housed in a specific pathogen-free environment, where they were kept in a carefully controlled environment at a constant temperature and 60% humidity. The animal experiments conducted using these mice were approved by the Animal Care and Use Committee of the First Affiliated Hospital, Zhejiang University School of Medicine (No. 2022-16).
The purified HA protein extracted from the H10 subtype AIV was mixed with the Quick Antibody-Mouse 5W adjuvant (Biodragon, Suzhou, China) and used to immunize 6-week-old BALB/c mice through intramuscular injection every 2 weeks. After 4 weeks, the antibody titer was measured using the blood samples collected from the tail veins of the mice. Next, HA protein without the adjuvant was injected into the mouse exhibiting the highest antibody titer to further immunize it. 3 days later, lymphocytes were collected from the spleen of this mouse and fused with SP2/0 cells. Additionally, we collected supernatants from the hybridoma cell culture to detect their reactivity with the purified HA protein by conducting ELISA using H10-coated HA protein. This process helped identify and obtain monoclonal hybridoma cell lines exhibiting the desired reactivity. The mice were then inoculated with these monoclonal hybridoma cell lines. Finally, we obtained purified mAbs from the ascites of these mice by using a Protein G column (GE Healthcare, Chicago, IL, USA).
2.3. Isotypes and Affinity of mAbs
A moderate amount of purified mAbs was added to the monoclonal antibody isotyping kit (Bio-Rad, USA) to identify the isotypes. Pipetting the mAbs sample into the development tube where it forms a complex with the antibody coated micro particles and inserting the strip. This complex flows through the strip until it is bound by the immobilized goat antimouse antibody specific for the monoclonal’s isotype and its light chain. In ~5–10 min, the micro particle complex will aggregate as blue bands in the two sections corresponding to the monoclonal antibody’s isotype and its light chain. The affinities of all mAbs were investigated using the methodology outlined was described previously [35]. Briefly, the purified mAbs (Section 2.1) were first diluted to 20 ng per well using an ELISA coating buffer (KPL, Milford, MA, USA) and then added to the ELISA plate overnight at 4°C. The next day, the plate was washed five times with PBS and then blocked with a blocking buffer (KPL) for 2 h. The plate was again washed five times with PBS, and mAbs (Section 2.2) was added to it by conducting multiple dilutions for 1 h at 37°C. The plate was again washed three times with PBS and incubated with PBS-diluted secondary antibodies at 37°C for 30 min. Finally, the absorbance of all samples on the ELISA plate was measured using an ELISA reader.
2.4. Immunofluorescence
An immunofluorescence assay was conducted to assess the specific binding between different subtypes of AIV (H10N2, H10N3, H10N5, H10N7, H10N8, H1N2, H3N2, H6N1, H7N9, and H9N2) and mAbs 2G9 and 1E8 [36]. MDCK cells were first treated with different subtypes of AIV and then washed with PBS and fixed with pro-cooled methanol. Next, the MDCK cells were permeabilized with 0.3% Triton X-100 and washed three times with PBS. Additionally, the cells were blocked with a blocking buffer for 1 h and then incubated overnight with mAb 2G9 and 1E8. Following the initial washing of the cells with PBS, the cells were incubated with goat antimouse IgG heavy plus light chain (H + L)-Alexa Fluor 488 (Abcam, England) for 90 min. After this incubation, the cells were again washed with PBS three times. The images were captured using a Leica sp8 confocal laser scanning microscope (Leica, Germany).
2.5. Hemagglutination Inhibition (HI) and Virus Neutralization (VN) Tests
The experimental steps of hemagglutination inhibition (HI) were carried out according to the methodology outlined in a previous study [33]. The H10N7 virus was prepared by diluting it to a concentration of 8 HA units (HAU) in PBS and was set aside for use. Twofold serial dilutions of H10 mAbs were prepared, with concentrations ranging from 10 to 0.01 μg/mL. These dilutions were then introduced into a microtiter plate; 25 μL of each dilution was added to every well. Then, an equal amount of H10 was added to each well. A negative control with PBS was prepared. The mixture was incubated for 40 min at room temperature. Finally, 50 μL of 1% chicken red blood cells was added to each well and reacted with the unbinding HA to determine the HI titer. The results were observed after 20 min. The virtual neutralization (VN) test was performed as follows [37]. Twofold serial dilutions of H10 mAbs, which ranged from 100 to 0.2 μg/mL, were added into a microtiter plate. An equal amount of 100 TCID50 of the H10N7 virus was added to each well for 2 h. The MDCK cells were washed with phosphate-buffered saline (PBS) and supplemented with the mixture described above for 72 h. The supernatant was collected, and the presence of virus was detected through a HA assay. The Reed–Muench method was used to calculated the neutralization titers [38].
2.6. Generation of Antibody Escape Mutants
Equal volumes of H10 mAb and 100TCID50 of H10 virus (10 μg/mL each) were mixed and incubated for 1 h at room temperature. Following this incubation period, 200 μL of the mixture of mAb and H10 virus was administered into 9-day-old embryonated chicken eggs. These eggs were incubated for 72 h at 35°C. After the incubation, the allantoic fluid was harvested and subsequently tested to determine the HA titer. The positive allantoic fluid was collected and mixed with increasing mAbs concentrations, ranging from 10 to 160 μg/mL. The above steps were carried out five times. RNA was extracted using the Trizol LS reagent (Life Technologies, Waltham, MA, USA). The HA segment was amplified by RT–PCR, and the amino acid changes were detected by sequencing as described in a previous study [39]).
2.7. Establishment of QDFM-ICS
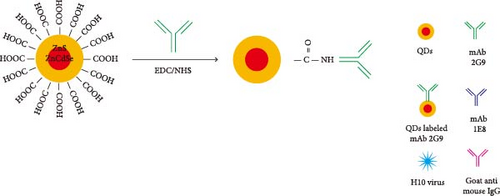
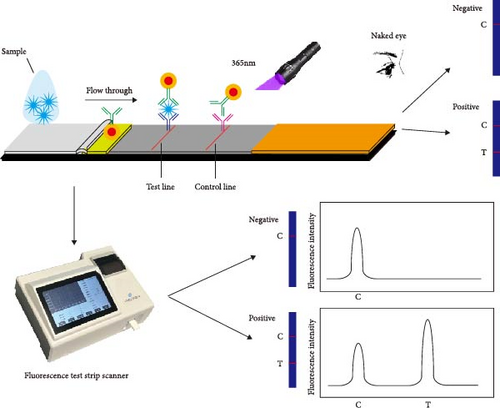
First, 30 μL of QDs was dissolved in 400 μL of 25 mM 4-morpholineethanesulfonic acid (MES, Sigma–Aldrich, Saint Louis, MO, USA) adjusted to pH 6.0. The resulting mixture was supplemented with 15 μL of 1-ethyl-3- (3-dimethylaminopropyl) carbodiimide hydrochloride (EDC, Thermo Fisher Scientific, Rochford, USA) at 10 mg/mL and 15 μL of N-hydroxysuccinimide (NHS, Sigma–Aldrich) at 10 mg/mL [30]. The mixture was gently shaken horizontally for 30 min at room temperature to fully activate the carboxyl. The redundant EDC and NHS were removed by performing centrifugation (15000 rpm) for 30 min at 4°C [32]. The QDs were resuspended in 400 μL of MES with 0.2 mg of mAb 2G9. The mixture was incubated to allow the binding of mAb with QDs for 1 hr at room temperature, as shown in Figure 1A. Additionally, 400 μL of the blocking buffer supplemented with 2% bovine serum albumin (BSA, Sangon Biotechnology, Shanghai, China) was employed to block the unbound sites and incubated for another hour. The washing buffer was used to remove the unbound antibodies or chemicals [20]. The activated QDs were resuspended in 150 μL of MES (containing 2% BSA) and were sprayed evenly onto glass cellulose membranes (Jiening Biotechnology, Shanghai, China). The goat antimouse IgG (Solarbio, Beijing, China) at a concentration of 1 mg/mL and mAb 1E8 at a concentration of 4 mg/mL were dispensed onto the NC membrane by using a BioDot XYZ distribution platform (Jinbiao Biotechnology, Shanghai, China) with a dispensing parameter of 1 μL/cm to generate the C, T lines. The QDFM–ICS, comprising a sample pad, glass cellulose membranes, nitrocellulose (NC) membranes (Sartorius, Göttingen, Germany), and an absorbent pad (Jiening Biotechnology), was assembled on a polyvinyl chloride (PVC) backplate (Jiening Biotechnology), as shown in Figure 1B. The assembled PVC backplate was cut into 3.5-mm-wide strips using an automatic cutting machine (Jinbiao Biotechnology). The strips were observed under 365-nm UV light with the naked eye. The fluorescence intensity was measured using a fluorescence test strip scanner (Hemai Technology, Suzhou, China).

2.8. Specificity, Sensitivity, and Reproducibility of the H10 QDFM-ICS
The specificity of the QDFM–ICS was evaluated as follows. Different subtypes of AIVs (H10N2, H10N3, H10N5, H10N7, H10N8, H1N2, H2N8, H3N2, H4N6, H5N6, H6N1, H7N9, H9N2, and H11N9) and other avian viruses, avian paramyxovirus-4 (APMV-4, ZJ-1), infectious bronchitis virus (IBV, H120), infectious bursal disease virus (IBDV, NF8), and Newcastle disease virus (NDV, La Sota) were added to the aforementioned strips to detect the specificity of the QDFM–ICS through naked eye observation. The absorbance was also detected. The allantoic fluid containing 26–2−6 HAU of the H10 AIV and 2000–0.5 ng/mL of purified H10 HA proteins, which were twofold serial diluted, was added to the strips to detect the sensitivity of QDFM–ICS. To evaluate the reproducibility, the H10 AIV allantoic fluid, which was diluted to 24, 21, and 2−2 HAU, was used 20 times, and the relative standard deviation (RSD) value was calculated using the absorbance value.
2.9. Poultry Sample Test
To evaluate the effectiveness of the QDFM–ICS established, 160 samples, including 25 H10 positive samples (5 avian cloacal swabs, 2 avian throat swabs, and 18 fecal samples) [55], were investigated using real-time RT–PCR and QDFM–ICS methods. An influenza A virus real-time RT-PCR kit (Liferiver, Shanghai, China) was performed according to the manufacturer’s instructions and used as the reference method [40]. The data so obtained were analyzed using the CFX96 System (Bio-Rad, CA, USA).
3. Results
3.1. Generation and Characterization of mAbs
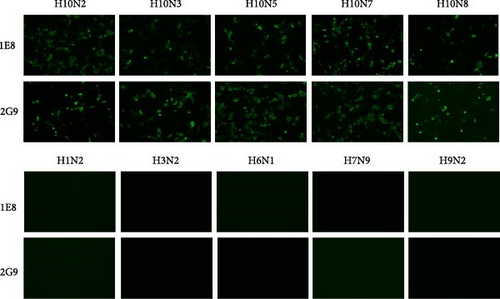
First, we immunized the mice with the purified HA of the H10N7 virus and fused their spleen cells with myeloma cells to create hybridomas. We conducted an ELISA assay to identify the hybridoma cell lines that could stably secrete HA-specific mAbs. For this assay, we used the immunizing antigen as the coating to screen and select the appropriate hybridoma line [41]. Two cell lines, 1E8 and 2G9, were chosen for further investigations. The isotypes of these mAbs, IgG2b for 1E8 and IgG2a for 2G9, and the sequence characterization of their heavy and light chains are listed in Table 2. Both mAbs demonstrated a strong binding affinity for the HA of the H10N7 virus. The immunofluorescence results confirmed their binding specificity (Figure 2). None of the two mAbs demonstrated any nonspecific binding when tested on MDCK cells infected with H1N2, H3N2, H6N2, H7N9, and H9N2 subtype AIVs. Conversely, both 1E8 and 2G9 displayed robust reactivity toward MDCK cells infected with H10 viruses. This obvious reactivity underscores the high specificity of these mAbs for the H10 viruses.
| Name | HI titera | MN titera | Affinity (µg/mL)b | Isotypec | Heavy chain | Light chain | |||
|---|---|---|---|---|---|---|---|---|---|
| — | — | — | Subclass | Type | V-GENE and allele | CDR3d | V-GENE and allele | CDR3 | |
| 1E8 | 8 | 2 | 4 × 10⁻⁴ | IgG2b | k | Musmus IGHV8-12 ∗02 F | ARSPPTDYGSSWGVMDY | Musmus IGKV4-59 ∗01 F | QQWSSNPLT |
| 2G9 | 8 | 8 | 2 × 10⁻⁴ | IgG2a | k | Musmus IGHV9-3–1 ∗01 F | ARGYDYAEGYFAMDY | Musmus IGKV8-30 ∗01 F | QQYYSNYT |
- Abbreviation: ELISA, enzyme-linked immunosorbent assay.
- aHI and MN titers of these mAbs were measured against A/chicken/Zhejiang/2CP8/2014(H10N7). The initial concentration of these Abs was 20 μg/mL for HI and 100 μg/mL for MN.
- bThe ELISA was performed using the HA protein of A/chicken/Zhejiang/2CP8/2014(H10N7).
- cIsotyping of the mAbs was performed using a Mouse MonoclonalAntibody Isotyping Test Kit.
- dComplementarity-determining region.
3.2. Amino Acid Substitutions Selected by mAbs
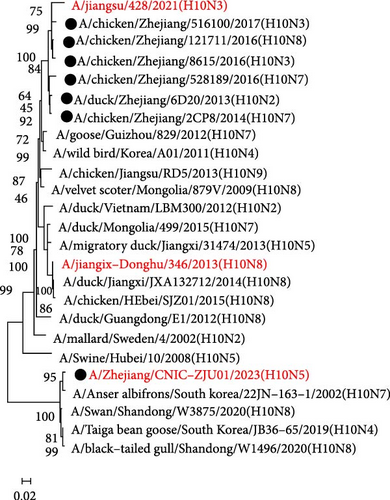
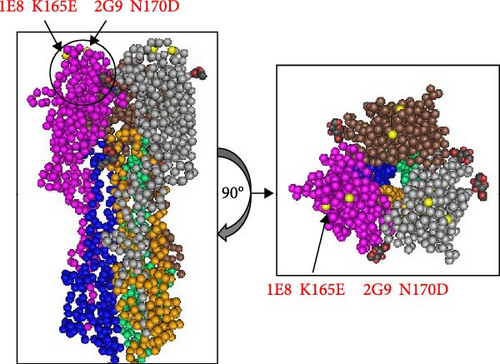
We initiated a series of assessments to investigate the amino acid substitutions. We cultured H10N7 viruses (A/chicken/Zhejiang/2CP8/2014) in the presence of mAbs at concentrations of 10, 20, and 40 µg/mL to generate escape mutants and pinpoint the specific mAb epitopes. After four passages, the escape viruses were gathered and the nucleotide sequences of their HA genes were analyzed through sequencing. These sequences were then compared to those of the parent strains to assess any genetic changes. Our results indicated that in the H10N7 virus, mutants escaping from 1E8 exhibited the K165E mutation, while those from 2G9 showed the N170D mutation, both located in the 150-loop region (H3 numbering) of the HA protein (Figure 3). A total of 1833 HA genes in H10 were obtained from the GISAID and aligned using the MEGA11 software. The results show that K165 and N170 are highly conserved. In circulating H10 strains, the probability of K165E and N170D mutations occurring is very low, at 0.22% and 0.11%, respectively.


3.3. LOD of QDFM-ICS
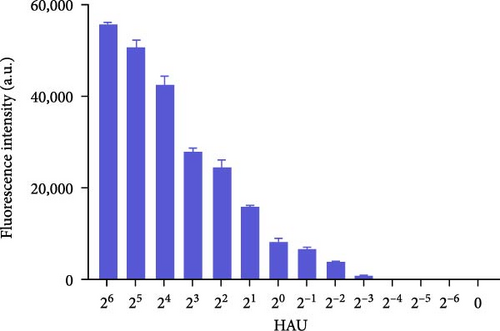
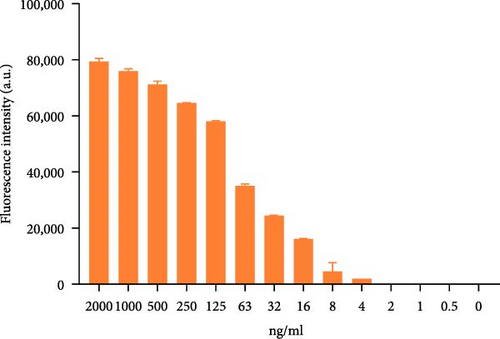
To explore the performance of the QDFM–ICS in detecting the A/chicken/Zhejiang/2CP8/2014 (H10N7) influenza virus, we conducted tests using three replicate samples containing 2−6–26 HAU of H10N7. As shown in Figure 4, the fluorescence intensity observed on the test line is directly related to the virus concentration. Notably, the fluorescence from the H10N7 test line at 2−2 HAU can be observed by the naked eye (Figure 4A). However, the fluorescence test strip scanner was allowed to detect only a low titer of H10N7 (2−3 HAU) (Figure 4B). Additionally, the fluorescence from the test line containing 4 ng/mL of the purified H10N7 HA protein can be observed unaided (Figure 4C). The fluorescence test strip scanner could detect the purified H10N7 HA protein at a concentration of 4 ng/mL (Figure 4D). The fluorescence intensity of this protein is ~800.


3.4. Specificity of QDFM-ICS
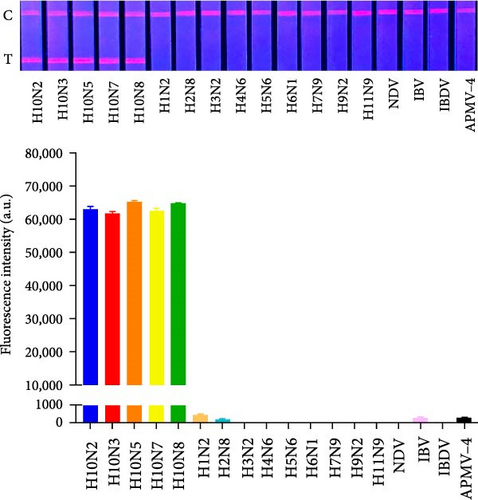
We examined non-H10 subtypes of influenza viruses (including H1N2, H2N8, H3N2, H4N6, H5N6, H6N1, H7N9, H9N2, and H11N9) as well as other avian respiratory tract virus strains, including common NDV, IBV, IBDV, and APMV-4. The results showed that QDFM–ICS only reacts with the H10 subtypes of AIV (including H10N2, H10N3, H10N5, H10N7, and H10N8), without showing any cross-reactivity with other influenza A virus subtypes or other viruses tested (Figure 5). This lack of interference ensures that accurate and reliable results are obtained for diagnosing the intended target virus. Hence, it is evident that the QDFM–ICS exhibits high specificity for detecting H10 AIVs.
3.5. Reproducibility of QDFM-ICS
The reproducibility of the QDFM-ICS was evaluated by detecting absorbance from 20 replicates across different titers of the H10 virus (24, 21, and 2−2 HAU). As illustrated in Table 3, the RSD values were consistently below 10%, which demonstrates the robust reproducibility of the QDFM-ICS method. The signals produced by 20 replicates of different concentrations of the H10 virus (24, 21, and 2−2 HAU) were detected to test the reproducibility of this QDFM-ICS. As demonstrated in Table 3, all the RSD values are below 10%, which indicates that the QDFM-ICS exhibits a high degree of reproducibility. Low RSD values are indicative of the consistent performance and reliability of the assay.
Virus concentrations (HAU) |
Fluorescence intensity average (a.u.) | Std. dev | RSD/% (n = 20) |
|---|---|---|---|
| 24 | 53,115 | 5142.0 | 9.68 |
| 21 | 9343 | 857.2 | 9.17 |
| 2−2 | 3767 | 279.2 | 7.41 |
- Abbreviations: HA, HA units; QDFM-ICS, quantum dot fluorescent microsphere-based immunochromatographic strip; RSD, relative standard deviation.
3.6. Actual Application of QDFM-ICS Sample Tests
We analyzed 160 avian samples using QDFM-ICS, among which 25 were confirmed as H10 positive (comprising 5 cloacal swabs, 2 throat swabs, and 18 fecal samples). The accuracy of the QDFM-ICS method was thoroughly assessed by comparing its results to those obtained from a real-time RT-PCR assay—the reference method for evaluation. This comparison helped in determining how well the QDFM-ICS method performed in relation to the established real-time RT-PCR technique. As detailed in Table 4, both methods yielded identical results, demonstrating 100% concordance. Hence, it can be suggested that QDFM-ICS performs reliably well across diverse sample types without interference, with high sensitivity and specificity.
| Samples | Number | QDFM-ICS result (P/N) |
Real-time PCR result (P/N) |
|---|---|---|---|
| Cloacal swab | 20 | 5/20 | 5/20 |
| Throat swab | 30 | 2/30 | 2/30 |
| Fecal samples | 110 | 18/110 | 18/110 |
- Abbreviations: PCR, polymerase chain reaction; QDFM-ICS, quantum dot fluorescent microsphere-based immunochromatographic strip.
4. Discussion
H10 subtype AIVs have been reported in a wide variety of species worldwide, including poultry [6], harbor seals [42], and humans [9, 43]. In Eastern and Southern China especially, multiple novel reassortant H10 subtype AIVs have been identified, such as H10N3 [44], H10N7 [45], H10N8 [46], and H10N9 [47]. Continuous mutations and recombination have enabled these H10 subtype AIVs to breach the species barrier, enabling their transmission to humans. Human cases of H10 subtype AIV infection continue to emerge, which have also resulted in deaths. For example, in China, H10N8 [7] and H10N5 [12] infections have resulted in one death each. Hence, it is crucial to rapidly and accurately detect these viruses for effective disease surveillance and prevention. It is essential to remain vigilant and develop rapid response measures to mitigate risks to public health owing to any potential outbreaks [48, 49]. Ensuring timely and precise detection is crucial for monitoring the spread of these viruses and implementing appropriate measures to control and prevent their outbreaks.
At present, ELISA and colloidal gold immunochromatographic test (ICT) strip are the chief antibody-based virus detection methods. These detection methods allow swift identification of influenza viruses. For instance, an ELISA and a colloidal gold ICT strip, both of which utilize mAbs, have been specifically developed for detecting the H9N2 subtype AIV. The ELISA has a detection limit of 4 HAU and 31.5 ng/mL of the HA protein, which indicates its sensitive and precise detection capabilities [35]. We developed an H7N9 mAb-based colloidal gold ICT strip to detect the H7N9 AIV. The LOD of this method for the H7N9 virus was 2 HAU [41]. He et al. developed an innovative dual-function-ELISA for the universal diagnosis of H7 subtype AIVs. This versatile ELISA can detect either the antigen or the antibody associated with the virus. Notably, the assay is highly sensitive, with an antigen detection limit of less than 1 HAU for H7 subtype AIVs, making it a highly suitable method for accurately identifying H7 infections [50]. Notably, the LODs of these methods are subject to further improvement.
The QD-based detection method is another rapid, sensitive, and economical antibody-detection method. This method exhibits significant application potential for the rapid detection of viruses. A QD-based lateral flow immunoassay system for simultaneous detection of the H5 and H9 subtypes of AIV has been reported. This advanced system demonstrated impressive sensitivity, with the detection limits of 0.016 HAU for the H5 AIV and 0.25 HAU for the H9 AIV. The use of QDs in this lateral flow immunoassay enhances its ability to accurately identify both the H5 and H9 subtypes at remarkably low concentrations [22]. A QD-based fluorescent immunochromatographic assay specifically for detecting SARS-CoV-2 has also been reported. This advanced method can identify the virus within just 15 min, with an impressive detection limit (5 pg/mL) for the virus antigen. A QD-microsphere-based test strip for detecting the African swine fever virus, with a detection limit of 1 copy, has also been reported [20, 51]. Adegoke et al. [31] developed a plasmonic nanoparticle-QD-molecular beacon biosensor probe for detecting the RNA of the Zika virus, with a detection limit of less than 3 copies/mL [31]. Our findings reveal that the LOD of QDFM-ICS for H10 subtype AIV could reach 0.125 HAU. This detection capability was notably superior to that of the colloidal gold-based immunochromatographic assay. Consequently, the QDFM-ICS method demonstrates a significantly higher sensitivity and can have a broader and more effective application in practical settings.
This study also analyzed 1E8 K165E and 2G9 N170D, the escape mutation sites. Both of these sites are located in the receptor-binding region and are the molecular basis of H10 AIV infection in humans. Notably, virus evolution and mutation put these sites under great immune pressure, which may further increase the frequency of mutation [52, 53]. Analysis of these escape mutation sites can not only clarify the antigenicity of the virus but can also help in the study of the influenza vaccine. If these mAbs are capable of neutralizing the virus, they can be employed in antiviral drug development studies. In addition, the analysis of virus antigen sites can enable timely monitoring of the applicability of the method to epidemic strains. The risk of missed detection increases if a mutation occurs in the interaction sites between the antigen and the antibody. It is necessary to reduce the time required for antibody detection, in order to improve the applicability of the detection method. Therefore, the analysis of virus antigen sites is of great significance for virus detection.
5. Conclusions
A sensitive QDFM-ICS was designed to detect the H10 subtype influenza virus. The QDFM-ICS uses a simple 365-nm fluorescence device. It can rapidly analyze the samples and afford reliable results within 15 min. The LOD of QDFM-ICS in detecting H10 subtype AIV was 0.125 HAU per 80 μL of the sample, with a corresponding LOD of 4 ng/mL for the HA protein of H10 AIV. Furthermore, the QDFM-ICS method demonstrated both high specificity and excellent reproducibility, ensuring reliable and accurate results. The tests on clinical samples showed high consistency between the QDFM-ICS and real-time RT-PCR results. The QDFM-ICS allows fast and accurate point-of-care testing along with an acceptable performance. Hence, QDFM-ICS is a promising method for virus detection and affords new options for point-of-care testing.
Ethics Statement
The Animal Ethics Committee of First Affiliated Hospital, School of Medicine, Zhejiang University approved all animal experiment in this study (No. 2022-16).
Conflicts of Interest
The authors declare no conflicts of interest.
Author Contributions
Jiamin Fu and Ping Wang have contributed equally to the work.
Funding
This work was supported by Grants from the National Science Foundation of the People’s Republic of China (32273092), Zhejiang Provincial Natural Science Foundation of China (LY24H190001), and National Key R&D Program of China (2024YFC2309903).
Open Research
Data Availability Statement
All data of this study are available from the corresponding author upon request.


