A Base Pair Outside the Catalytic Core of the I-R3 DNA Enzyme Has a Significant Effect on Its Cleavage Activity: An Improved Catalytic Core Model and an Automated Design Program
Abstract
The I-R3 DNA enzyme, in its trans-acting form, is capable of cleaving single-stranded DNA (ssDNA) molecules. We have collected all published information on the activity levels of the original I-R3 DNA enzyme and its known variants and embedded that information into a program (we called IR3). The program was applied to the sequences of a set of ssDNA viruses and identified all potential catalytic core substrates (targets) and output optimal I-R3 DNA enzyme sequences for all the targets, along with expected activity levels of the enzymes at those targets. Upon experimentally measuring the in vitro cleavage activities of the I-R3 variants, we found marked differences between the program-predicted and experimentally measured values. This demonstrated the incompleteness of the I-R3 model: The sequence of the nucleotides of the catalytic core is not sufficient to fully determine its activity level. A set of experiments was carried out in which the effect of all possible combinations of Watson–Crick base pairs at two positions near the catalytic core, termed SI and SII, was tested. To confirm a newly formed hypothesis, the nucleotide at the SII position of the enzyme strand was mutated to a G and a T, with the substrate strand mutated accordingly. In every case, this led to an increase in relative activity when changed to a G and a decrease, when changed to a T, of the variant I-R3 DNA enzyme. Clearly, the discovered base pair peripheral to the catalytic core has a substantial effect on cleavage activity. This improves the current model of essential nucleotides, and the IR3 software outputs I-R3 enzyme-sequence recommendations that make them more likely to cleave their targets. The software is available for download at https://github.com/XinxinTree/IR3.
1. Introduction
Since the discovery of catalytic RNAs in the 1980s [1, 2], advances in RNA therapeutics progressed with the discovery of several new nucleic acid–based technologies [3]. Such advances in the area of catalytic nucleic acids include small ribozymes [4, 5], DNAzymes [6, 7], and more recently DNA-cleaving DNA enzyme [8–11]. In 2013, two different structural classes of zinc-dependent DNA-cleaving DNA enzymes were artificially evolved [10]. One such structure was the I-R3. The I-R3 has a simple secondary structure consisting of a long, base-paired stem, which can be shortened, that is interrupted by an asymmetrical bulge, consisting of the catalytic core, where the cleavage occurs (Figure 1). After sequencing the systematic evolution of ligands by exponential enrichment (SELEX)–selected DNA pool and carrying out several site-directed mutagenesis experiments (including compensatory mutations), information on the essential nucleotides of the core was elucidated. Greater complexity of the essential core was determined by massive parallel sequencing of core-degenerated I-R3 cleavage assay [12]. Such complexity included percentage probability for previously invariable core nucleotides that provided a certain level of activity. Moreover, the randomness of the sequences generated by the experiment also provided simultaneous 2 and 3 base mutations within the core.
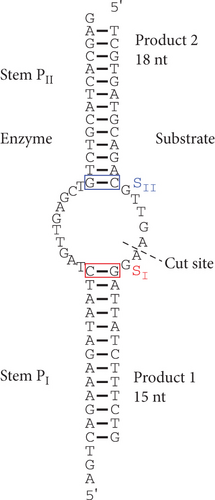
The catalytic core “bulge” can be designed as a trans-acting system where one DNA strand contains the top and bottom halves of the DNA stem, with an interrupting core of 10 deoxynucleotides. Since that strand is not cleaved, it is considered the enzyme strand (Figure 1). The other strand therefore consists of a substrate that is complementary to the top and bottom halves of the enzyme strand, interrupted by a seven-deoxynucleotide core that contains the cleavage site between two deoxyadenosines. Such a DNA enzyme can cut a DNA substrate requiring only seven conserved consecutive nucleotides. It provides a relatively small number of potential sequences: 47 = 16,384 different 7-nt sequences. As an example, a 4.6 million base pair Escherichia coli genome has a likelihood of having this exact sequence 280 times, and likelihood is even greater than 280 considering the number of tolerated substrate mutations. Moreover, the specificity of cleaving any of those seven-nucleotide long target sequences comes from the elongated base pair stems.
Finding and designing such an enzyme to target a substrate manually is time-consuming and error-prone compared to a bioinformatics-aided approach. In this article, we report on a bioinformatics tool that designs a DNA enzyme strand to target a single-stranded DNA (ssDNA) of interest, making use of the I-R3 DNA enzyme’s slightly variable core. To keep our hypothesis biologically relevant, we used synthetic segments from ssDNA viruses as targets. In several cases, while the software-predicted cleavage activity of some targets was high, we saw an absence of cleavage in our in vitro cleavage assay analyzed by polyacrylamide gel electrophoresis (PAGE) gel [13]. The mutagenesis of each core-adjacent base pair to any new canonical Watson–Crick base pair identified a previously unreported base pair requirement that expands the current model of the I-R3 catalytic core.
2. Materials and Methods
2.1. Materials
All oligonucleotides were purchased from Integrated DNA Technologies (Coralville, Iowa). Oligonucleotides used to study the effect of different bases on either end of the active site were obtained with a standard purity, while those used to study the viral sequences (wild type (WT) and variants) were obtained with a PAGE purity. A 10/60 ssDNA ladder was obtained from Integrated DNA Technologies (Coralville, Iowa). The 10x Tris/borate/EDTA (TBE) buffer was obtained from BioBasic (Markham, Ontario). Tetramethylethylenediamine (TEMED), 40% (19:1) acrylamide:bisacrylamide, ammonium persulfate, urea, 2-[4-(2-hydroxyethyl)piperazin-1-yl]ethanesulfonic acid (HEPES), sodium chloride, potassium chloride, and zinc chloride were obtained from BioShop Canada (Burlington, Ontario). The SyberGold DNA stain was obtained from ThermoFisher Scientific (Waltham, Massachusetts). A 2x RNA loading dye was obtained from New England Biolabs (Ipswich, Massachusetts).
2.2. Sample Preparation and Reaction Conditions for Cleavage Activity
The cleavage activity was performed in the same fashion (with small variations) as previously PAGE-based analysis of I-R3 cleavage activity [13]. A total of 2.5 μM DNA enzyme and 1 μM DNA substrate strands were annealed in 1x annealing buffer (50 mM HEPES pH 7.05, 500 mM NaCl, and 500 mM KCl) using a thermal cycler by heating at 95°C for 5 min then decreasing the temperature by 5°C every 3 min until it reached 20°C. Reaction buffer (40 mM ZnCl2, 50 mM HEPES, 500 mM NaCl, and 500 mM KCl, pH 7.05) was then added, and the mixture was kept at 30°C for 30 min in 20 mM ZnCl2. The reaction was stopped by the addition of 2x denaturing RNA loading dye and subsequently heated and kept at 95°C for 5 min, before being loaded onto a 20% denaturing polyacrylamide gel containing 8 M urea. Samples were run at 20 W for 2 h. The subsequent gel was stained with SyberGold diluted in 1x TBE buffer in the dark, while shaking it at 150 rpm for 30 min (SI4: control DNA enzyme digestion).
2.3. Data Analysis
Relative activity was calculated as the ratio of the given reaction activity to the WT I-R3 DNA enzyme/substrate reaction activity, measured under the same conditions and in the same laboratory.
3. Results and Discussion
3.1. Software
A software program named IR3 was custom-made to scan DNA sequences (presented 5′–3′) to locate potential substrate sequences for a trans-acting I-R3 DNA enzyme. For each substrate sequence, it presents all potential enzyme sequences and their respective relative I-R3 cleavage activity. The level of cleavage activity of an I-R3 DNA enzyme acting at a given substrate sequence was presumed to be identical to the reported level of activity for the same enzyme–substrate pair, as published [12]. Therefore, a relative activity was calculated with the ratio of the known extent of cleavage of a given variant over the extent of cleavage of the WT sequence (SI1: mutations and subsequent activity ratios from literature and SI6: mutation table). No attempt was made to extrapolate or make an intelligent prediction of what the relative activity could be for unpublished I-R3 sequences.
- Step 1.
Read the sequence of a ssDNA (presented 5′–3′) from a fasta text file.
- Step 2.
Identify potential seven nucleotide substrate sequences (i.e., sequences belonging to the substrate side of the catalytic core of a complete I-R3 DNA enzyme).
- Step 3.
For every substrate sequence, find the enzyme sequence that maximizes the relative activity at that site based on the activity ratios (SI1: mutations and subsequent activity ratios from literature and SI6: mutation table).
- Step 4.
Save the substrate sequence, the sequence of the chosen “optimal” I-R3 enzyme, the position of the substrate in the ssDNA, and the expected relative activity level.
- Step 5.
Upon reaching the end of the target substrate, generate the results in the following fashion:
- 5.1.
Extend the identified substrate sequence by 13 nucleotides so it now includes the full length of the substrate.
- 5.2.
Extend the I-R3 enzyme sequence, using Watson–Crick complementation, to generate complete PI and PII stems once annealed, while removing three nucleotides to the 5′ end and one nucleotide to the 3′ end of the substrate strand to provide greater separation on denaturing gels.
- Step 6.
Format all the results to output them in the form shown in Figure 2.

3.2. Testing of Software Results
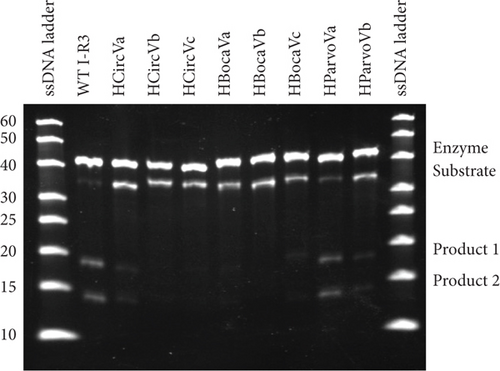
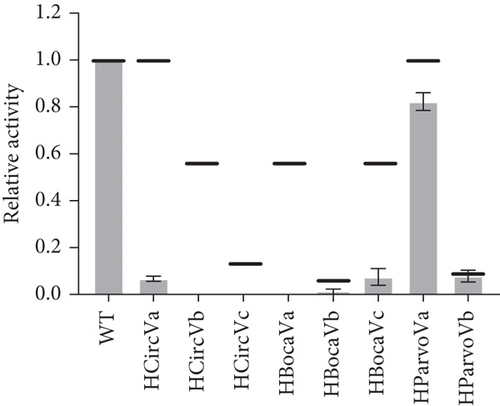
To test the IR3 program, the sequences of various single-stranded DNA viruses were used as test cases for the software. These included the complete genomes of human parvovirus 4 G1 (HParvoV) (GenBank: AY622943.1), human bocavirus 2c isolate PK-5510 (HBocaV) (GenBank: FJ170278.1), and human circovirus 1 (HCircV) (GenBank Accession ON677309.1) (Supporting Information 2). Oligonucleotides were generated reflecting the identified target sequences and the corresponding enzyme strands (SI2: IR3-scanned ssDNA viruses and SI5: sequences used in this work). Sequences selected for in vitro cleavage intentionally included ones with predicted high, medium, and low relative activities. These oligonucleotides were incubated together in the reaction buffer and the subsequent products were run on a denaturing polyacrylamide gel and analyzed [13]. The initial results suggest that the existing model is insufficient for describing the activity of mutations within the I-R3 DNA enzyme (Figures 3(a) and 3(b)).
3.3. Effect of Certain Nucleotides Peripheral to the Active Site
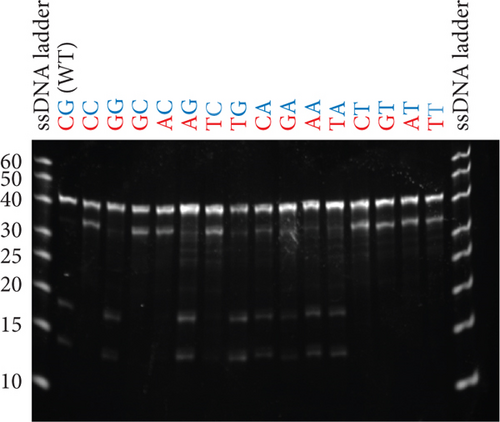
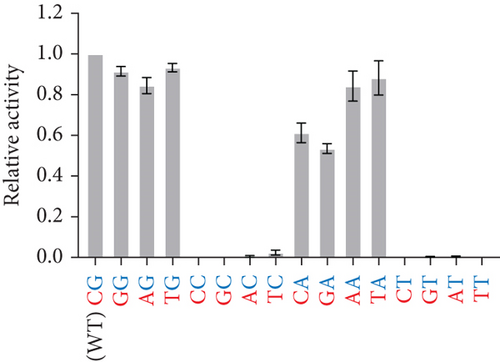
Given that the existing model of essential nucleotides is based solely on the catalytic core (bulge) residues, the results in Figures 3(a) and 3(b) strongly suggest that there are essential nucleotides that are not included in the existing model. To investigate this, base pairs SI and SII (red and blue boxes in Figure 1, respectively) were changed to every combination of canonical base pairs across both base pairs. This led to a total of 16 combinations for both base pairs, including that of the WT sequence (Figures 4(a) and 4(b)). At the SI base pair, it appears that the nucleotide position does not seem to have a major effect as A-T, T-A, G-C, and C-G enzyme substrate base pairs all showed high activity (Figure 4(b), Bars 1–4 and 9–12). However, at the SII base pair, G-C (WT) and A-T showed high activity (Bars 1–4 and 9–12) while the C-G and T-A base pairs had activities practically abolished (Figure 4(b), Bars 5–8 and 13–16). From this, it was found that the SII position plays a substantial role in its activity. On the enzyme strand of position SII, a base pair starting with a purine (with G preferable to A) results in a high level of cleavage activity. In contrast, a pyrimidine at the same position is highly detrimental to cleavage activity.
3.4. Modulating Activity of I-R3 With Mutations at the SII Position
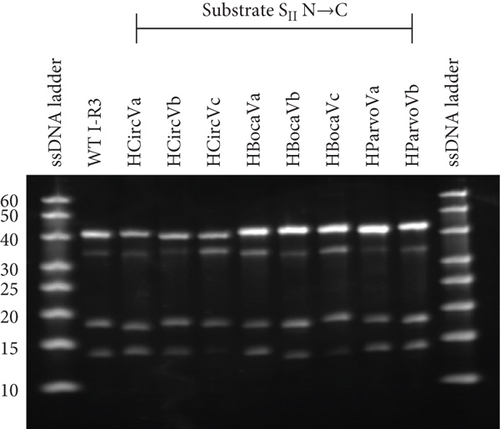
The emerging hypothesis was that having a purine on the enzyme side of the SII Watson–Crick base pair is essential for activity. The ssDNA virus sequences used in Figure 3 were mutated, changing the substrate SII nucleotide to a C and the corresponding enzyme SII nucleotide to a G. This results with a G-C base pair at the SII position (Figures 5(a) and 5(c)). In these cases, the activity level was substantially increased across all mutants. For example, HCircVa, b, and c; HBocaVa, b, and c; and HParvoVb showed little to no activity with their original purine nucleotide, while their relative activities now range between 0.59 and 1.06. Only HParvoVa showed a high activity before the mutation, which nevertheless was boosted from 0.82 to 1.06. This is likely because the original sequence has a T at the SII position of the substrate strand. The substantial gain of activity suggests that a C at the SII position of the substrate strand and a G in the enzyme strand are essential for significant cleavage activity.
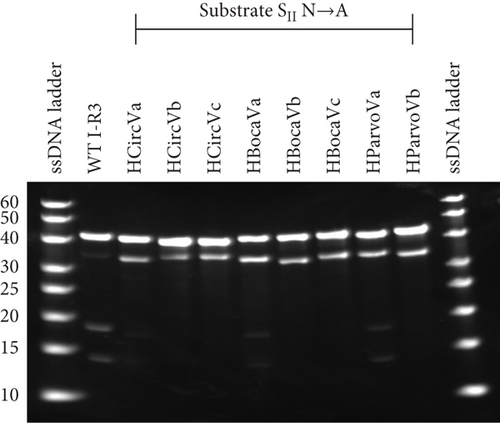
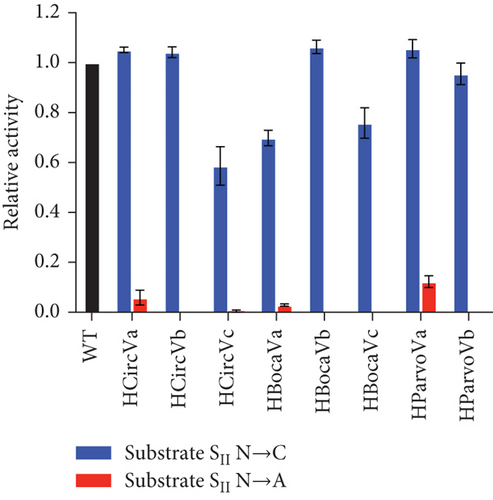
Similarly, loss of activity was explored using the same viral I-R3 substrates. Here, the critical nucleotide on the substrate strand was similarly replaced with an A (Figures 5(b) and 5(c)). A remarkable decrease in HParvoVa activity was observed when compared to Figure 3, supporting the hypothesis that a T-A enzyme–substrate base pair at the position SII is highly detrimental. The activities of the other sequences were also not improved, if not completely diminished, compared to those in Figure 3. However, it is worth noting that the activity levels of the WT sequences were low to begin with. In addition, the WT sequence for HCircVb already contained an A in the SII position of the substrate strand but was included with the other samples for consistency. The activities of WT virus sequences, along with C and A mutants, are summarized in Table 1.
| Sample | Estimated | WT | C | A |
|---|---|---|---|---|
| HCircVa | 1.00 | 0.07 ± 0.01 | 1.05 ± 0.01 | 0.06 ± 0.03 |
| HCircVb | 0.56 | 0.00 ± 0.00 | 1.04 ± 0.02 | 0.00 ± 0.00 |
| HCircVc | 0.13 | 0.00 ± 0.00 | 0.59 ± 0.08 | 0.00 ± 0.00 |
| HBocaVa | 0.56 | 0.00 ± 0.00 | 0.70 ± 0.03 | 0.03 ± 0.00 |
| HBocaVb | 0.06 | 0.01 ± 0.01 | 1.06 ± 0.03 | 0.00 ± 0.00 |
| HBocaVc | 0.56 | 0.07 ± 0.04 | 0.76 ± 0.06 | 0.00 ± 0.00 |
| HParvoVa | 1.00 | 0.82 ± 0.04 | 1.06 ± 0.04 | 0.12 ± 0.02 |
| HParvoVb | 0.09 | 0.08 ± 0.02 | 0.96 ± 0.04 | 0.00 ± 0.00 |
4. Conclusions
We developed a computer program, IR3, that scans the sequence of any given ssDNA strand, identifies all potential target sites, and outputs the most promising I-R3 DNA enzyme for every target site.
Using this program and comparing its predictions to the results of wet-lab experiments (that we carried out), we were able to show that the existing catalytic core model for I-R3 DNA enzyme activity is incomplete. Furthermore, our work demonstrates that the identity of a certain base pair, termed SII, at the immediate periphery of the catalytic core has a substantial effect on cleavage activity. A purineenzyme–pyrimidinesubstrate base pair at SII substantially increases cleavage activity, while the reversed base pair yields minimal activity.
Given these findings, it is recommended that one employs a purine (preferably a G) at the DNA enzyme side of the SII base pair, if one wishes to maximize cleavage activity of an I-R3 DNA enzyme. We believe that this aspect of the DNA enzyme’s activity is key in its use in future applications, as it expands the variety of available target sequences. Potential applications of I-R3-based systems include the targeting and cleavage of various single-stranded DNA viruses, such as parvoviruses, in therapeutic or biosensing contexts. They can also serve roles in dynamic DNA systems, such as recycling-based amplification systems in aptamer-based small-molecule biosensors. The latest version of the program includes this recommendation in its output. The IR3 program is free and publicly available for download at https://github.com/XinxinTree/IR3.
Conflicts of Interest
The authors declare no conflicts of interest.
Author Contributions
Shahidul Islam and Gabriel Aguiar-Tawil contributed equally.
Funding
This study was funded by Concordia University’s Applied AI Institute under grant number 300010761.
Acknowledgments
Thanks are due to Phylicia Ma, former student at High Technology High School, Middletown, New Jersey, who performed initial relative rate compilation during a summer internship sponsored by the Monmouth University Summer Research Program.
Open Research
Data Availability Statement
The data that supports the findings of this study are available in the supporting information of this article (supporting data).


