Volume 2025, Issue 1 8896885
Research Article
Open Access

Berberine Liposome Nanoparticles as a Potential Therapeutic Strategy for Managing Ischemic Stroke Through PTGS2 Inhibition

Peng Xie

Corresponding Author

Peng Xie

Department of Anatomy , School of Basic Medicine , Guizhou Medical University , Guian New District, Guiyang , China , gmc.edu.cn

Key Laboratory of Human Brain Bank for Functions and Diseases of Department of Education of Guizhou Province , Guizhou Medical University , Guiyang , China , gmc.edu.cn

Key Laboratory of Molecular Biology , Guizhou Medical University , Guiyang , China , gmc.edu.cn

Search for more papers by this author
Mingyan Xia

Mingyan Xia

Department of Anatomy , School of Basic Medicine , Guizhou Medical University , Guian New District, Guiyang , China , gmc.edu.cn

Key Laboratory of Human Brain Bank for Functions and Diseases of Department of Education of Guizhou Province , Guizhou Medical University , Guiyang , China , gmc.edu.cn

Key Laboratory of Molecular Biology , Guizhou Medical University , Guiyang , China , gmc.edu.cn

Search for more papers by this author
Wenpeng Cao

Wenpeng Cao

Department of Anatomy , School of Basic Medicine , Guizhou Medical University , Guian New District, Guiyang , China , gmc.edu.cn

Key Laboratory of Human Brain Bank for Functions and Diseases of Department of Education of Guizhou Province , Guizhou Medical University , Guiyang , China , gmc.edu.cn

Search for more papers by this author
Dongfen Guo

Dongfen Guo

Department of Anatomy , School of Basic Medicine , Guizhou Medical University , Guian New District, Guiyang , China , gmc.edu.cn

Key Laboratory of Human Brain Bank for Functions and Diseases of Department of Education of Guizhou Province , Guizhou Medical University , Guiyang , China , gmc.edu.cn

Key Laboratory of Molecular Biology , Guizhou Medical University , Guiyang , China , gmc.edu.cn

Search for more papers by this author
Zhenkui Ren

Corresponding Author

Zhenkui Ren

Department of Laboratory Medicine , The Second People’s Hospital of Guizhou Province , Guiyang , China

Search for more papers by this author
Wenfeng Yu

Corresponding Author

Wenfeng Yu

Department of Anatomy , School of Basic Medicine , Guizhou Medical University , Guian New District, Guiyang , China , gmc.edu.cn

Key Laboratory of Human Brain Bank for Functions and Diseases of Department of Education of Guizhou Province , Guizhou Medical University , Guiyang , China , gmc.edu.cn

Key Laboratory of Molecular Biology , Guizhou Medical University , Guiyang , China , gmc.edu.cn

Search for more papers by this author
First published: 16 July 2025
Academic Editor: Mario Ferreira Conceição Santos

Abstract

Pyroptosis following cerebral ischemia–reperfusion injury (CIRI) is a key driver of long-term neuronal damage and poor functional recovery. Microglia, the primary immune cells of the central nervous system (CNS), play a pivotal role in regulating pyroptosis and orchestrating neuroinflammation. In this study, we observed significant upregulation of prostaglandin endoperoxide synthase-2/cyclooxygenase-2 (PTGS2/COX-2) in ischemic stroke patients, as well as in both in vivo and in vitro CIRI models. Knockdown of PTGS2 attenuated pyroptosis in BV2 microglial cells exposed to oxygen-glucose deprivation/reoxygenation (OGD/R). Using network pharmacology and molecular docking, we identified berberine (BBR) as a specific PTGS2 inhibitor, capable of suppressing its expression. To overcome BBR’s poor aqueous solubility and low bioavailability, we developed a novel nanoliposomal formulation of BBR (BBR-LNPs). In a murine middle cerebral artery occlusion/reperfusion (MCAO/R) model, BBR-LNPs markedly alleviated neurological dysfunction and reduced CIRI by regulating PTGS2-mediated pyroptosis. Collectively, our findings demonstrate that BBR-LNPs mitigate CIRI by inhibiting PTGS2-dependent pyroptosis, highlighting their potential as a therapeutic strategy for ischemic stroke.

1. Introduction

Cerebral ischemia–reperfusion injury (CIRI) elicits a pronounced inflammatory response [1]. Microglia have been recognized as significant contributors to neuroinflammation [2, 3]. Recently, pyroptosis has been identified as a novel form of programmed inflammatory cell death with a strong connection to CIRI [4]. This caspase-1-dependent programmed cell death mechanism was involved in the GSDMD-mediated transmembrane pore assembly, osmotic imbalance-induced hydropic degeneration, and membrane permeabilization-dependent release of cytoplasmic IL-1β and IL-18 [5, 6]. Activation of the NLRP3 inflammasome is a key factor in the onset of pyroptosis [7, 8]. Various research efforts have indicated that cerebral ischemic injury prompts microglial pyroptosis [9], and it has been established that hindering this process can provide both anti-inflammatory benefits and neuroprotection [10, 11]. Nevertheless, the underlying molecular mechanisms that regulate ischemia–reperfusion-induced pyroptosis, as well as potential drug intervention targets, remain inadequately elucidated.

Prostaglandin endoperoxide synthase-2, also known as cyclooxygenase-2 (PTGS2/COX-2), is an enzyme responsible for facilitating the initial rate-limiting process in the production of prostaglandins (PGs) derived from arachidonic acid (AA). Under typical physiological conditions, PTGS2 is categorized as a cyclooxygenase that is induced by stress and generally expressed at low levels [12, 13]. Conversely, the expression and activation of PTGS2 are tightly regulated by inflammatory cytokines and growth factors, which activate intracellular signaling pathways associated with inflammation [14]. Recent studies have implicated PTGS2 in the regulation of ferroptosis and pyroptosis [15], specifically in modulating NLRP3 inflammasome-derived IL-1β production [16]. PTGS2-targeted therapies are commonly employed to manage inflammation. Nevertheless, the role of PTGS2 in regulating CIRI-induced pyroptosis remains unclear and requires further investigation.

Berberine (BBR), commonly referred to as Huanglian, is the active ingredient of the traditional Chinese medicine Huanglian. BBR is a stable quaternary ammonium isoquinoline alkaloid that is widely utilized clinically for the treatment of intestinal infections. Its potent strong anti-inflammatory and antioxidant effects have attracted considerable interest from researchers [17, 18]. Numerous studies have demonstrated that BBR possesses neuroprotective effects. For instance, research conducted by Zhu et al. has shown that BBR improves CIRI by suppressing the release of HMGB1 and NF-κB nuclear translocation [19]. Additionally, it has been demonstrated that BBR can suppress pyroptosis triggered by the activation of the NLRP3 inflammasome, which in turn reduces pulmonary inflammation in mouse models [20]. Our previous research also demonstrated that BBR modulates autophagy and endoplasmic reticulum stress, thereby regulating neuronal apoptosis caused by oxygen-glucose deprivation and reoxygenation [21]. Collectively, these studies suggest that BBR exerts significant neuroprotective effects, potentially through the modulation of inflammatory responses and oxidative stress pathways. Although it has significant neuroprotective benefits in neurodegenerative conditions such as Alzheimer’s disease [22] and Parkinson’s disease [23], the clinical application of BBR has been impeded by its poor water solubility, low bioavailability, and lack of specificity. Therefore, enhancing BBR delivery methods through advanced technologies, such as nanoliposomes, or developing specifically targeted formulations is crucial for improving its efficacy and achieving targeted delivery.

The presented study indicates that PTGS2 shows increased expression in blood samples taken from ischemic stroke patients, along with several in vivo and in vitro experimental models. Furthermore, the knockdown of PTGS2 was found to inhibit pyroptosis induced by ischemia–reperfusion. Additionally, analyses utilizing network pharmacology and molecular docking indicated that PTGS2 serves as a potential target for BBR. To address the poor aqueous solubility of BBR, we developed BBR-loaded nanoliposomes (BBR-LNPs). Characterization investigations performed in both in vitro and in vivo settings revealed that BBR-LNPs displayed minimal cytotoxic effects and successfully suppressed pyroptosis induced by cerebral ischemia–reperfusion. These results provided a theoretical basis for the clinical use of BBR in treating ischemic stroke.

2. Materials and Methods

2.1. Materials and Reagents

1,2-Dipalmitoyl-sn-glycero-3-phosphocholine (DPPC) and cholesterol were acquired from Xi’an Ruixi Biological Technology Co., Ltd. in China. Isopropyl alcohol (IPA) was sourced from Shanghai Macklin Biochemical Co., Ltd. located in China. Phosphate-buffered saline (PBS) at a concentration of 10 mM and a pH of 7.4 was procured from Codow Chemical Co., Ltd. in China. Additionally, lipopolysaccharides (HY-D1056) and BBR (HY-18258, purity = 99.92%) were obtained from MCE.

2.2. Synthesis and Fabrication of BBR-LNPs

A specific proportion of DPPC, cholesterol, DSPE-PEG-2K, and BBR was dissolved in 3 mL of chloroform and then placed into a nightshade flask. This mixture was rotated and evaporated to create a film at the flask’s base, followed by the addition of 2 mL of ionized water. The solution was subjected to ultrasound treatment and processed through a liposome extruder equipped with a 200-nm filter. The removal of unloaded BBR was achieved through dialysis using a nanodialysis device equipped with a polycarbonate membrane featuring a pore size of 50 nm. For the experiment, 10 μL of liposome solution was measured, followed by the addition of Triton X-100 to disrupt the membrane, allowing for the quantification of BBR within the liposome via an enzyme marker method, using BBR as the standard for the curve. For freeze-drying, a protective agent was incorporated prior to the freeze-drying process.

2.3. Characteristics of BBR-LNPs

The BBR-LNPs underwent evaluation for their size, polydispersity index (PDI), morphology, and zeta potential. Morphological analysis was performed using transmission electron microscopy (TEM). The particle size and the PDI of the BBR-LNPs were determined via dynamic light scattering (DLS) using a Zeta sizer Nano ZS90. Zeta potential was assessed at 25°C and a scattering angle of 173° by measuring electrophoretic mobility with laser Doppler velocimetry. The optimal formulation parameters were measured thrice for characterization purposes.

2.4. In Vitro Release Study of BBR-LNPs

A modified dialysis technique was employed to assess the in vitro release of BBR encapsulated in LNPs. In summary, 1 mL of BBR-LNPs at a concentration of 10 mg/mL was placed in a regenerated cellulose dialysis bag and exposed to 200 mL of a 0.5% Triton X-100 aqueous solution at 37°C with continuous magnetic stirring at 100 rpm. Samples were withdrawn at specified time points (0, 6, 12, 24, 30, 36, and 48 h) from the receiving phase for HPLC analysis of the released BBR. Each 1 mL sample was collected at designated time points and promptly substituted with an equal volume of fresh media to uphold a constant 200-mL total volume. The unbound BBR was solubilized due to the presence of 50% PEG in the solution. All experiments were conducted in sextuplicate.

2.5. Establishment of the CIRI Model and BBR-LNP Administration

The middle cerebral artery occlusion and reperfusion (MCAO/R) mouse model was established to replicate cerebral ischemia–reperfusion, as described in a previous study [24]. Male C57BL/6 mice, weighing around 25 g and aged 8–10 weeks, were employed in the study. All experimental procedures were conducted in accordance with the guidelines set by the Animal Ethics Committee of Guizhou Medical University (approval number: 2000792). The mice were anesthetized with 1%–1.5% isoflurane and placed in a supine position. The right common carotid artery (CCA), external carotid artery (ECA), and internal carotid artery (ICA) were sequentially exposed and carefully separated. Subsequently, the CCA and ECA were ligated, and the ICA was clamped with an arterial clamp. A silicone nylon monofilament was then inserted from the CCA into the middle cerebral artery and temporarily secured. After 1 h of ischemia, the monofilament was removed, and the blood vessels were ligated at the incision site. The neck wound was closed with surgical sutures. Experiments were conducted after 24 h of reperfusion. In the sham operation group, the same surgical procedures as the MCAO/R model group were performed, with the exception of the monofilament insertion. For BBR-LNP administration, the mice were given an intravenous injection BBR-LNPs (0.1 mg/kg) through the tail vein 1 week before MCAO/R-operation, once a day for seven consecutive days.

2.6. Cell Lines and Culture Conditions

BV2 and THP-1 cells were procured from ATCC. BV2 cells were maintained in a DMEM supplemented with 10% FBS under 5% CO2. THP-1 cells were cultured in RPMI 1640 medium with 10% FBS under 5% CO2. To establish the oxygen-glucose deprivation/reoxygenation (OGD/R) model, cells were thrice washed with PBS, the medium was replaced with glucose-free medium, and the cells were exposed to a three-gas environment (1% O2/5% CO2) in an incubator. After 4 h, the glucose-free medium was substituted with DMEM containing 10% FBS, and the cells were returned to the normal oxygen level in a humidified incubator with 5% CO2 and incubated at 37°C for an additional 24 h. For the LPS challenge, BV2 or THP-1 cells were cultured in complete medium supplemented with 1 μg/mL of LPS for 24 h.

2.7. Cytotoxicity Analysis

BV2 cells were cultured in DMEM supplemented with 10% fetal bovine serum until reaching 80% confluency. The cells were then detached with trypsin, resuspended, and seeded at the density of 1 × 105 cells per well in 96-well plates for 24-h incubation. Following this, the cells were treated with varying concentrations of BBR-LNPs for an additional 24 h. After treatment, the culture medium was replaced with a CCK8 working solution (prepared at a 10:1 ratio of medium to CCK-8) at 100 μL per well and incubated at 37°C in a CO2 incubator for 1.5 h. Subsequently, the OD value at 450 nm was measured by a universal microplate reader.

2.8. Reactive Oxygen Species (ROS) Content Analysis

BV2 cells were inoculated in 6-well culture plates at an appropriate density and cultured overnight. Subsequently, the cells were allocated into three groups: control, OGD/R, and OGD/R + BBR-LNPs. BBR-LNPs were introduced to BV2 cells during reoxygenation and incubated for 24 h. Following the removal of the old medium, the cells were rinsed twice with prechilled 1 × PBS, digested with EDTA-free trypsin, and collected. The cellular precipitate was centrifuged in PBS and then treated with DCFH-DA (Beyotime) in binding buffer at specified concentrations for 15 min at room temperature prior to flow cytometry analysis. Data analysis was performed using FlowJo-v10.8.1 software.

2.9. Western Blot Analysis

Protein was extracted from mouse brain tissue or BV2 cells and quantified using a bicinchoninic acid (BCA) assay. Subsequently, the protein samples underwent SDS–PAGE electrophoresis and were transferred onto a PVDF membrane. The membrane was blocked with 5% skimmed milk powder for 1 h to prevent nonspecific binding, followed by overnight incubation at 4°C with primary antibodies targeting PTGS2 (1:1000, #12282, CST), NLRP3 (1:1000, ET1610-93, HUABIO), GSDMD-N (1:1000, HA721144, HUABIO), Caspase-1 (1:1000, ET1609-69, HUABIO), IL-1β (1:100, #12242, CST), IL-18 (1:250, 10663-1-AP, Proteintech), α-tubulin (1:1000, #2125, CST), β-actin (1:1000, #4970, CST), and GAPDH (1:1000, #92310, CST). Subsequently, secondary antibodies (goat anti-mouse or goat anti-rabbit IgG conjugated with HRP) were applied. Chemiluminescence detection using ECL reagents was employed for band visualization, and images were captured with the Gene Gnome SYNGENE Imaging System. Quantitative analysis of signals was conducted using ImageJ software.

2.10. qRT-PCR Analysis

Cells were lysed with TRIzol reagent (Absin, Shanghai, China) for RNA extraction, followed by cDNA synthesis via reverse transcription kit (Vazyme, Nanjing, China). Quantitative PCR (qPCR) was conducted on an ABI Prism 7900HT system (Applied Biosystems, Foster City, CA, USA) using ChamQ SYBR qPCR Master Mix (Vazyme, Nanjing, China). Target gene expression levels were normalized to GAPDH and analyzed using the 2−ΔΔCt method. Primer sequences, synthesized by Sangon Biotech, are detailed in Table 1.

Table 1. Primer sequences for TNF-α, IL-1β, IL-6, IL-18, and GAPDH.
Gene Forward (5′—3′) Reverse (5′—3′)
TNF-α TGTTCCTCAGCCTCTTCT GGACCTGGGAGTAGATGA
IL-6 CCA​CCG​GGA​ACG​AAA​GAG​AA CCA​CCG​GGA​ACG​AAA​GAG​AA
IL-1β ATCTCCGACCACCACTAC CACCACTTGTTGCTCCAT
IL-18 TCT​TCA​TTG​ACC​AAG​GAA​ATC​GG TCC​GGG​GTG​CAT​TAT​CTC​TAC
GAPDH TAT​GAC​AAC​AGC​CTC​AAG​AT AGTCCTTCCACGATACCA

2.11. ELISA

Supernatants from cell cultures subjected to various treatments were collected. IL-1β and IL-18 levels were quantified using ELISA kits (MCE, USA) following the guidelines provided by the manufacturer.

2.12. TTC and Histopathological Analysis

Following MCAO/R operation, mice were anesthetized, and brain tissue samples were collected. The tissue was fixed in 4% paraformaldehyde, embedded in paraffin, and sectioned at 4 μm. These sections were dewaxed, hydrated, and then stained using 2% TTC, H&E, or Nissl staining. TTC and H&E staining sections were microscopically examined, and both infarcted and noninfarcted cerebral regions were analyzed with ImageJ software.

2.13. Bioinformatics Analysis and Molecular Docking

The microarray expression dataset GSE58294 was sourced from the Gene Expression Omnibus (GEO) database (https://www.ncbi.nlm.nih.gov/geo/), comprising 23 blood samples from healthy controls and 69 from individuals with acute ischemic stroke. PTGS2 protein structures were obtained from the PDB database, and BBR’s structural data were acquired from PubChem. Molecular docking analyses were conducted using AutoDock, with results visualized via PyMOL version 2.1.

2.14. Cellular Thermal Shift Assay (CETSA)

BV2 cells were frozen and thawed in liquid nitrogen three times, and the cell lysate was detected by the CETSA. The lysate was divided: one part served as a control, and the other was treated with 10 μM BBR for 3 h at room temperature. Both lysates were heated at specified temperatures (37°C–67°C) for 3 min and then cooled to room temperature. After centrifugation at 12,000 g for 15 min at 4°C, the supernatants were analyzed using SDS–PAGE and immunoblotting.

2.15. Drug Affinity Responsive Target Stability (DARTS)

After incubating various concentrations of BBR with BV2 cell lysates for 1 h, pronase (5 μg/mL) was added and left at room temperature for 30 min. The reaction was stopped by adding an SDS–PAGE loading buffer, and the samples were analyzed via immunoblotting.

2.16. Statistical Analysis

Statistical analyses were conducted using GraphPad Prism 9.0. Results are presented as mean ± SE. Significant differences were assessed using Student′s t-test and one-way ANOVA, with a significance level of p < 0.05.

3. Results

3.1. PTGS2 Is Upregulated and Involved in the Regulation of Pyroptosis in CIRI

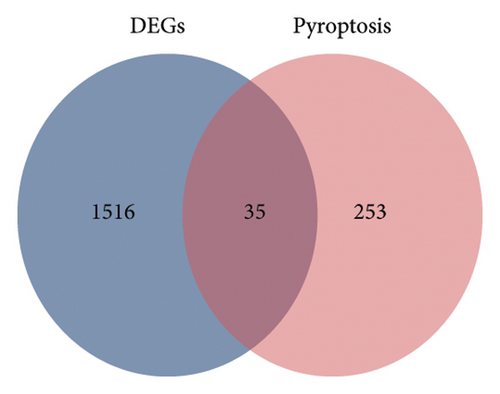
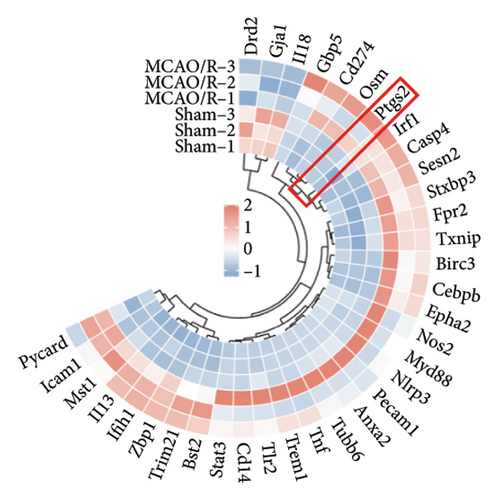
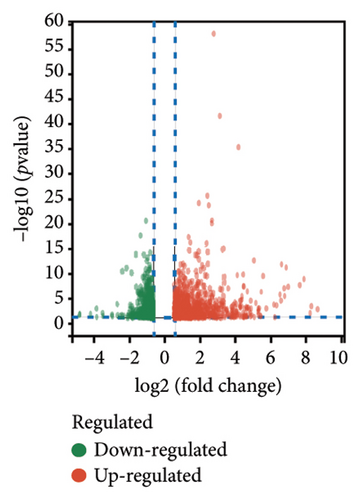
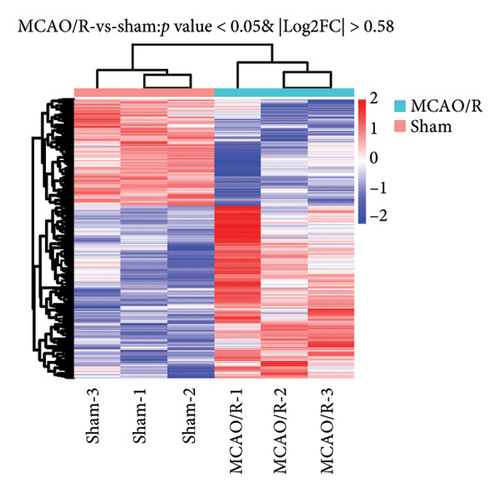
The main aim of this study is to assess how pyroptosis influences the pathological progress following ischemic stroke-related ischemia–reperfusion injury (IRI) [25]. To clarify the regulatory roles of genes associated with pyroptosis in relation to the pathology of cerebral ischemic IRI, we first established a model of MCAO/R using C57BL/6J mice and performed a detailed RNA-seq analysis. Employing stringent criteria (p < 0.05 and |log2FC| > 0.5), we identified 1516 differentially expressed genes (DEGs), which included 961 genes that were upregulated and 555 genes that were downregulated (Figures 1(a) and 1(b)). Following this, a Venn diagram analysis uncovered 35 shared genes that are involved in both the MCAO/R model and the modulation of cellular necroptosis. The expression data for these genes were examined in the Sham and MCAO/R groups, as shown in Figures 1(c) and 1(d), respectively.
Details are in the caption following the image
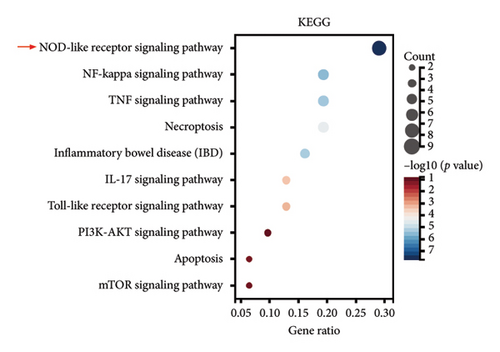
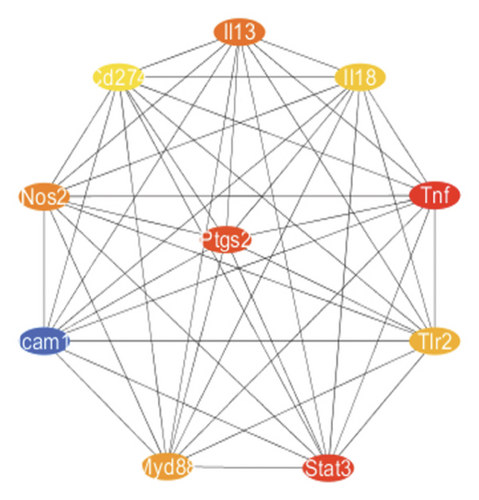
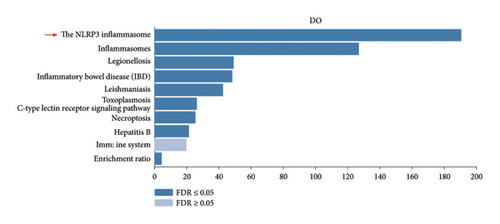
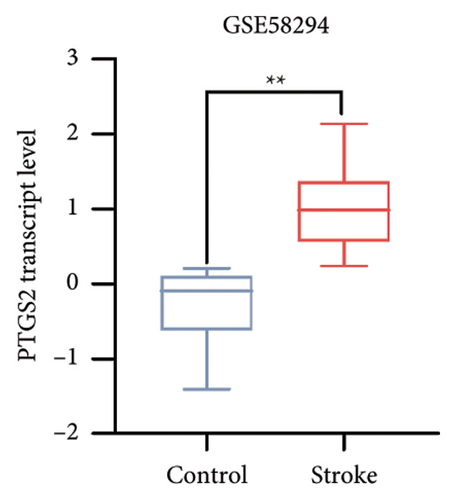
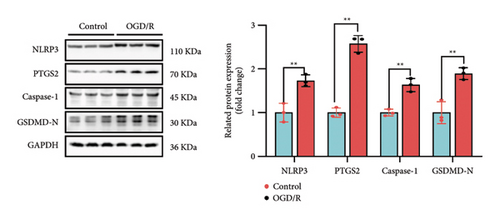
PTGS2 is upregulated and involved in the regulation of pyroptosis in CIRI. (a) Volcano plot of differential expression genes (DEGs). (b) Heatmap analysis of DEGs. (c) Venn diagram analysis of DEGs and pyroptosis-regulated genes. (d) mRNA level of the 35 intersecting genes in the MCAO/R model. (e) KEGG enrichment analysis of the 35 intersecting genes. (f) Protein–protein interaction (PPI) network analysis identified PTGS2 as a hub gene. (g) Disease ontology (DO) enrichment analysis of the 35 intersecting genes. (h) Increased expression of PTGS2 mRNA levels in samples from stroke patients. (i) Western blot analysis of the expression changes of NLRP3, PTGS2, Caspase-1, and GSDMD-N in OGD/R-induced BV2 cells (n ≥ 3, ∗∗, p < 0.01).

To further elucidate the biological processes governed by these 35 DEGs, we performed Kyoto Encyclopedia of Genes and Genomes (KEGG) enrichment analysis, which indicated significant enrichment primarily in pathways such as NOD-like receptor signaling, NF-κB signaling, and TNF signaling (Figure 1(e)). Additionally, disease ontology analysis suggested that these genes predominantly regulate pathways associated with NLRP3 inflammasome activation (Figure 1(f)). The analysis of the protein–protein interaction (PPI) network involved 35 genes that highlighted PTGS2 as a crucial hub gene (Figure 1(g)), known for its regulatory functions in various biological processes, including ferroptosis and necroptosis [15]. Additionally, we examined the expression patterns of PTGS2 at the transcript level in patients who had experienced a stroke, revealing significantly higher mRNA levels in peripheral blood samples (Figure 1(h)). In BV2 microglial cells exposed to OGD/R, there was a notable increase in the protein levels of PTGS2, as well as in classic pyroptosis markers such as NLRP3, Caspase-1, and GSDMD-N (Figure 1(i)). In summary, our results strongly indicate that PTGS2 may be involved in the regulation of pyroptosis processes resulting from cerebral IRI.

3.2. Inhibition of PTGS2 Alleviates Pyroptosis Induced by OGD/R in BV2

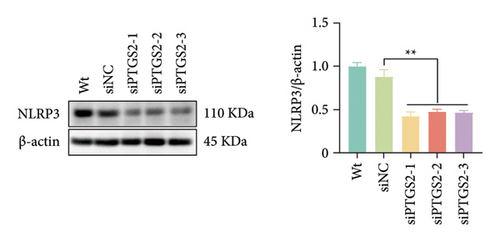
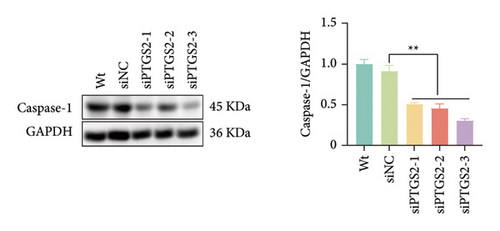
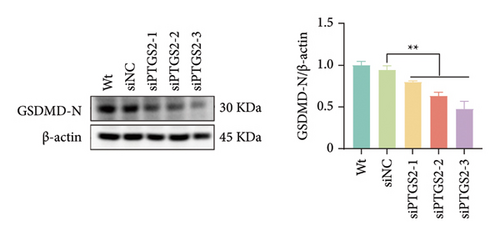
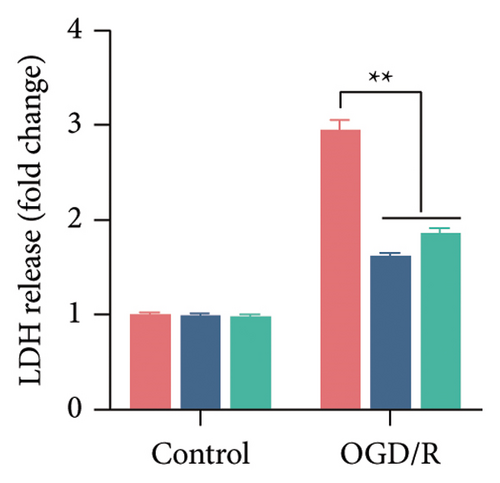
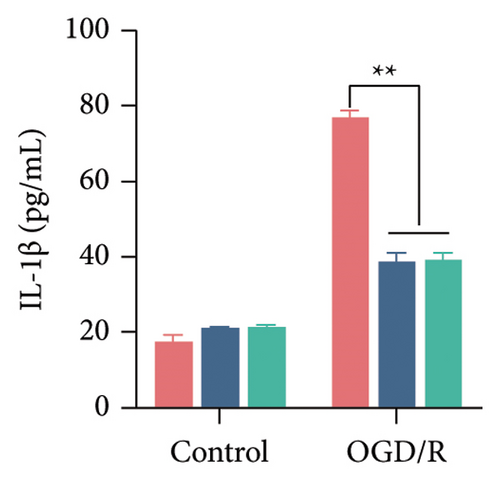
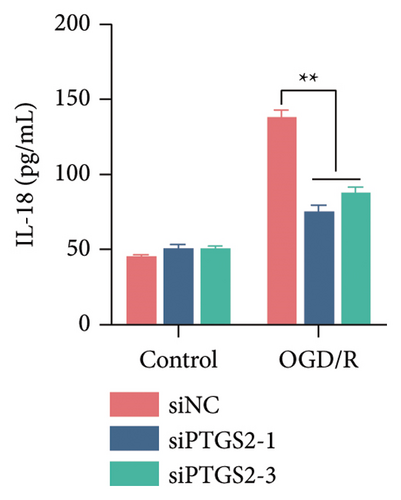
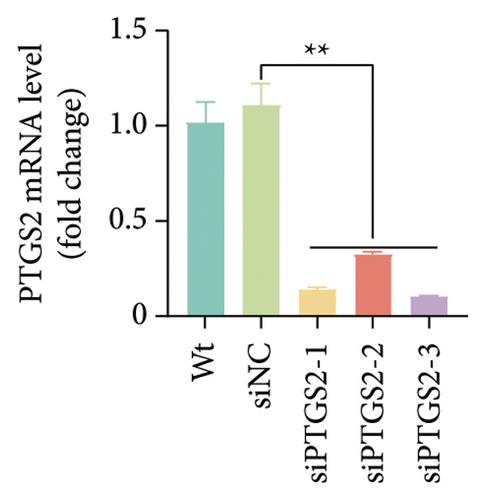
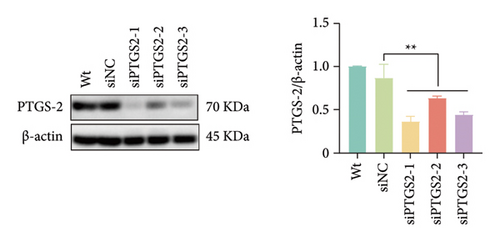
The findings of our research, supported by previous research, suggest that there is a significant increase in PTGS2 expression in both in vivo and in vitro ischemic stroke models [26, 27]. Additionally, it has been shown that PTGS2 plays a role in regulating neuronal iron death induced by ischemic stroke. Nevertheless, it is still uncertain how PTGS2 influences the pyroptosis process instigated by ischemic stroke. To explore PTGS2’s involvement in the regulation of iron death during the ischemia–reperfusion phase, we performed RNA interference experiments aimed at the PTGS2 gene. As shown in Figures 2(a) and 2(b), three distinct siRNA sequences effectively decreased PTGS2 expression at both the mRNA and protein levels. Notably, the interference sequences numbered 1 and 3 displayed the most significant knockdown effects when compared to the siNC control group. We then evaluated the expression of markers for pyroptosis, which included NLRP3, caspase-1, and GSDMD-N. The findings illustrated in Figures 2(c), 2(d), and 2(e) reveal that the reduction of PTGS2 considerably inhibited the expression of these molecules associated with pyroptosis. Furthermore, we examined the levels of lactate dehydrogenase (LDH), interleukin-1 beta (IL-1β), and interleukin-18 (IL-18). As shown in Figures 2(f), 2(g), and 2(h), the reduction of PTGS2 markedly decreased the release of LDH triggered by OGD/R and suppressed the expression levels of IL-1β and IL-18. In conclusion, our results indicate that inhibiting PTGS2 expression has a substantial suppressive impact on cell pyroptosis caused by ischemia–reperfusion.
Details are in the caption following the image
Inhibition of PTGS2 alleviates pyroptosis caused by OGD/R in BV2. (a) The mRNA of the PTGS2 expression level in the BV2 cell after transfection of the siRNA sequence and negative control. (b) The PTGS2 protein expression level in the BV2 cell after transfection of the siRNA sequence and negative control. (c) The NLRP3 protein expression in the BV2 cell after PTGS2 knockdown. (d) The caspase-1 protein expression in the BV2 cell after PTGS2 knockdown. (e) The GSDMD-N protein expression in BV2 after PTGS2 knockdown. (f) The LDH release content in each group. (g) Results from the ELISA quantifying IL-1β expression in each group. (h) Results from the ELISA measuring IL-18 expression in all experimental groups (n = 3, ∗∗, p < 0.01).

3.3. PTGS2 Was Identified as a Target for BBR

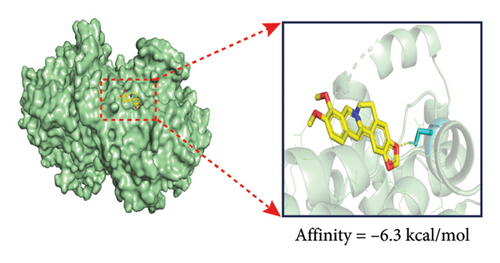
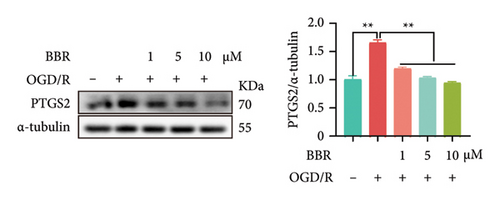
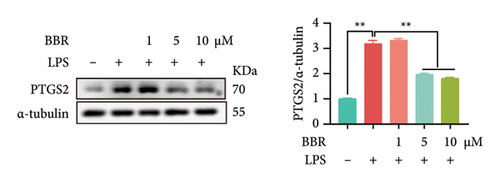
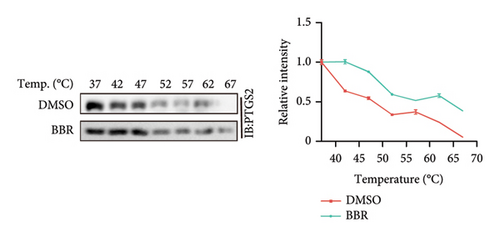
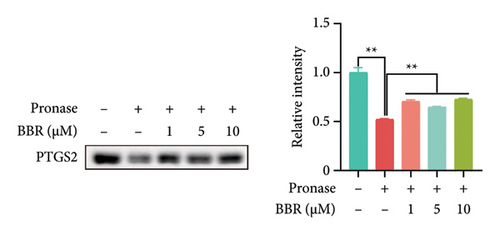
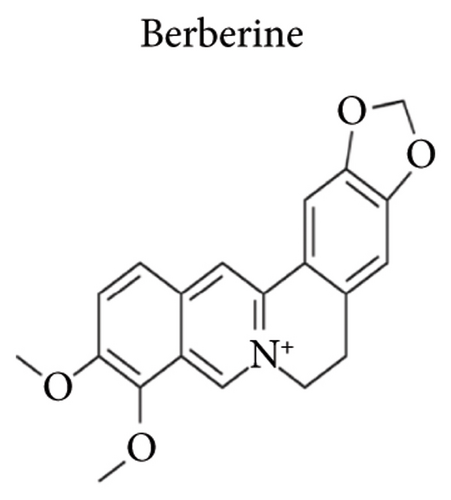
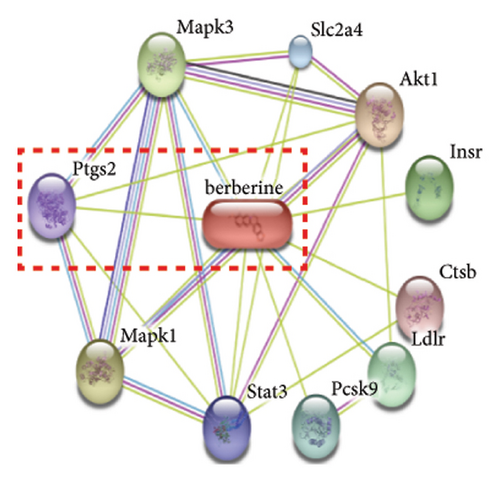
In our previous research, we demonstrated that BBR effectively inhibits apoptosis in PC12 neuronal cells induced by OGD/R [21]. Furthermore, existing studies have indicated that BBR enhances hepatic autophagic flux by modulating cholesterol metabolism and suppressing the expression of PTGS2 [28]. However, there is currently no empirical evidence to confirm whether PTGS2 is a direct target of BBR. Our results, derived from the chemical association networks database, as illustrated in Figures 3(a) and 3(b), indicate a direct interaction between BBR and PTGS2. Further molecular docking studies demonstrate that BBR binds to PTGS2, showing a binding energy measurement of −6.3 kcal/mol (Figure 3(c)). These results imply that PTGS2 could indeed be a direct target of BBR. In addition, we examined the impact of BBR on PTGS2 expression within an OGD/R-induced BV2 cell line model. As displayed in Figure 3(d), BBR notably suppressed the rise in PTGS2 expression caused by OGD/R. Consistent findings were reported in an LPS-stimulated BV2 cell model, illustrated in Figure 3(e). Furthermore, assays assessing protein thermal stability, such as the CETSA and DARTS analyses, further validated that PTGS2 is indeed a direct target of BBR, as BBR binding resulted in a decrease in PTGS2 protein levels (Figures 3(f) and 3(g)).
Details are in the caption following the image
PTGS2 was recognized as a target for berberine. (a) The structural formula of berberine (BBR). (b) The chemical interaction networks involving BBR and PTGS2. (c) Findings from molecular docking and molecular dynamics simulations. (d) The effect of BBR on PTGS2 expression in BV2 cells subjected to OGD/R. (e) The effect of BBR on PTGS2 expression in BV2 cells activated by LPS. (f) The influence of BBR on the thermal stability of PTGS2 assessed through the CETSA. (g) The influence of BBR on the proteolytic sensitivity of PTGS2 evaluated with the DARTS assay (n = 3, ∗∗, p < 0.01).

3.4. Synthesis, Characterization, and Cytotoxicity Analysis of BBR-LNPs

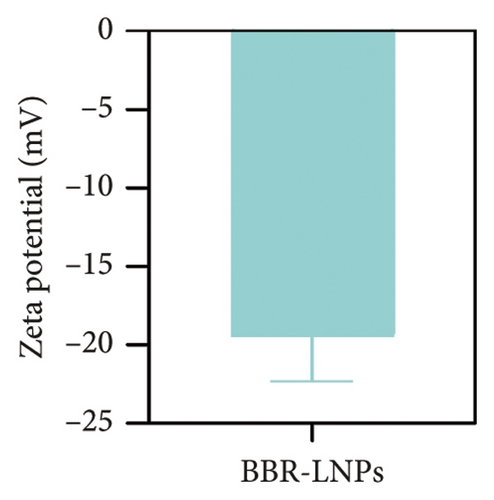
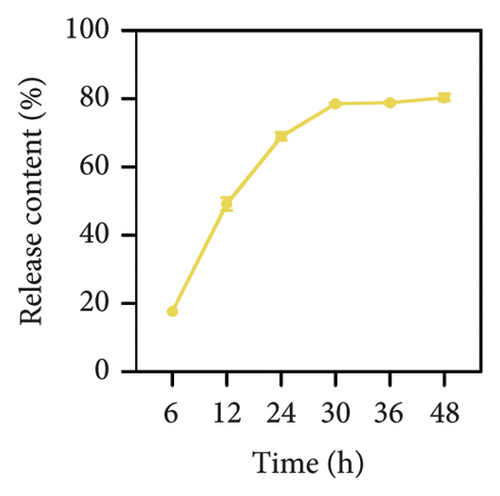
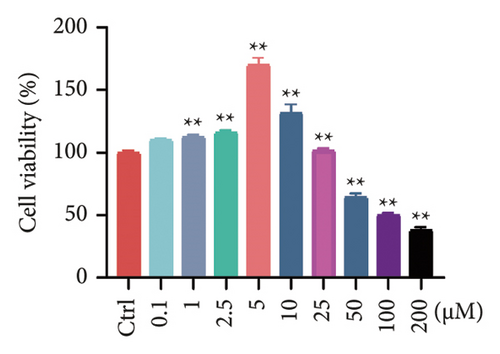
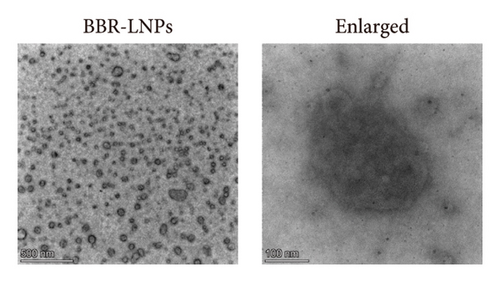
Considering the poor water solubility and low bioavailability of BBR, we designed and synthesized BBR-LNPs and subsequently characterized these nanoparticles. As illustrated in Figure 4(a), the synthesized BBR@LNPs exhibited uniform shape and size distribution, displaying a regular morphology. The results displayed in Figure 4(b) concerning the particle size distribution show that BBR-LNPs have an average particle size of 129.76 nm, in addition to a PDI of 0.13 and a zeta potential measuring −19.53 mV (Figure 4(c)). Moreover, data from the in vitro release experiments of BBR-LNPs, illustrated in Figure 4(d), demonstrate a rapid increase in the release rate during the first 30 h, which is followed by a slower increase thereafter. The release culminated in a peak of approximately 80%, after which the rate stabilized. Furthermore, these results will be useful as a reference for future animal studies involving in vivo administration. In addition, we used the CCK-8 assay to evaluate the cytotoxicity of BBR-LNPs on BV2 microglia cells. Our results indicated that cellular viability significantly increased at concentrations up to 10 μM of BBR-LNPs, as shown in Figure 4(e). However, with higher concentrations of BBR-LNPs, a marked decrease in the viability of BV2 cells was observed. Furthermore, previous studies have reported that BBR possesses mitochondrial targeting effects [29]. We therefore analyzed the mitochondrial targeting ability of the synthesized BBR-LNPs. As illustrated in Figure 4(f), BBR-LNPs demonstrated highly efficient accumulation within the mitochondrial structures, suggesting that BBR-LNPs exhibit exceptional mitochondrial targeting capability.
Details are in the caption following the image
Synthesis, characterization, and cytotoxicity analysis of BBR-LNPs. (a) Representative TEM images. (b) The particle sizes of BBR-LNPs and the distribution of particle size. (c) The zeta potential of BBR-LNPs, as detected by DLS. (d) The release profiles of BBR from BBR-LNPs at different times. (e) The analysis of cytotoxicity in BV2 cells exposed to different concentrations of BBR-LNPs. (f) Mitochondrial targeting capability analysis of BBR-LNPs (green: C6 and red: mito tracker). Scale bars, 20 μm (n ≥ 3, ∗∗, p < 0.01).

3.5. BBR-LNPs Alleviates Pyroptosis Induced by LPS or OGD/R

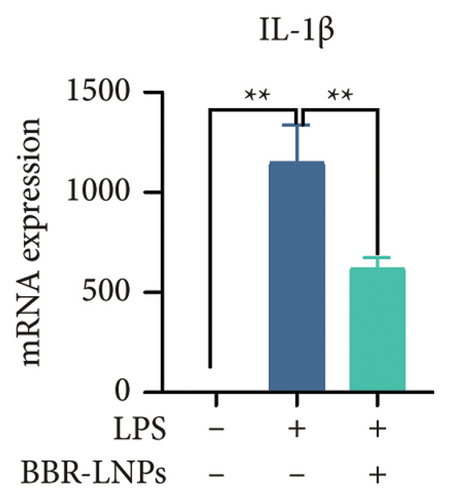
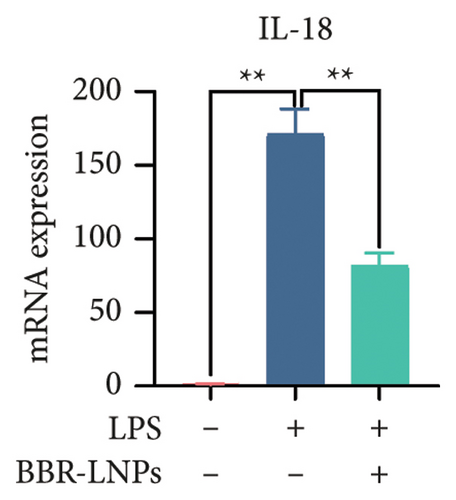
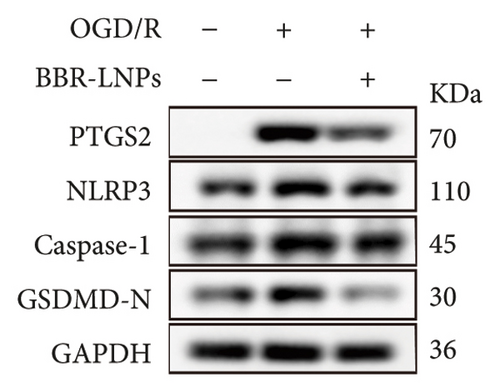
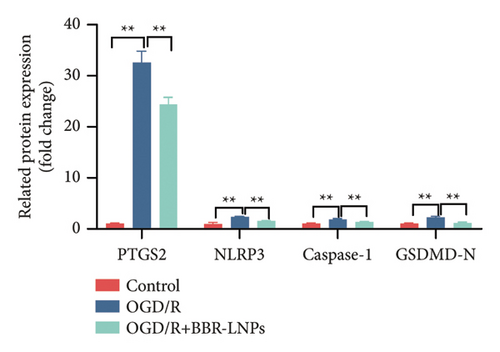
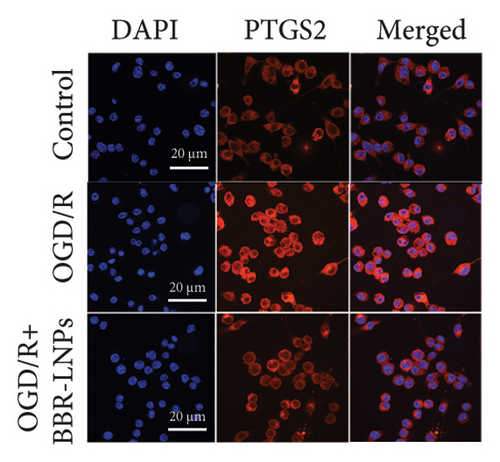
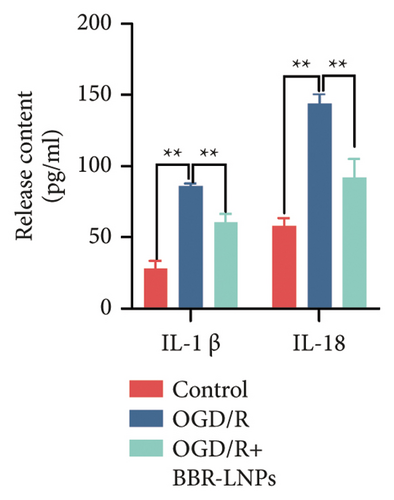
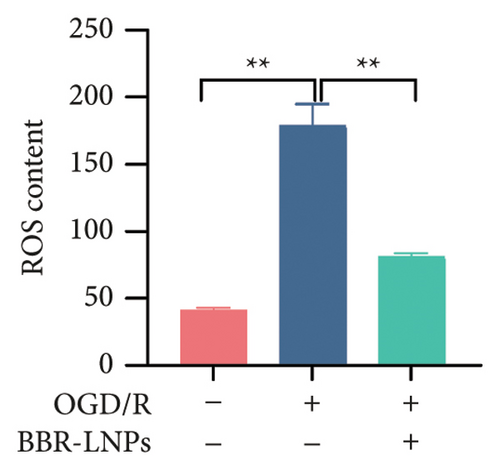
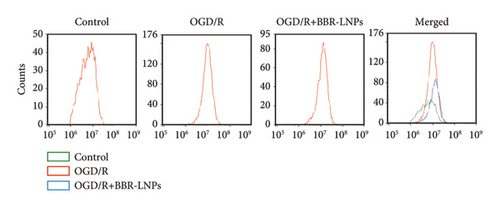
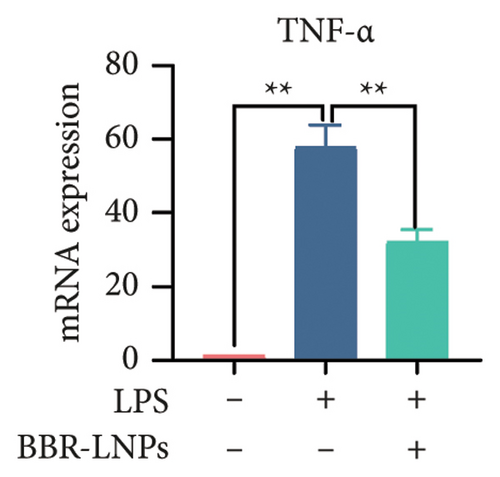
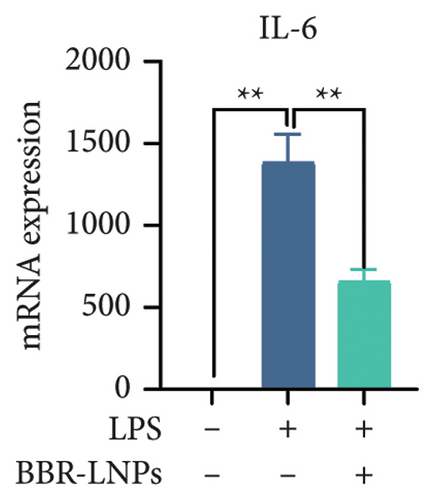
Our previous findings suggest that BBR may regulate pyroptosis by inhibiting the expression of PTGS2. Furthermore, we investigated whether BBR-LNPs possess the capacity to modulate pyroptosis in the LPS-stimulated model utilizing THP-1-like macrophages. As illustrated in Figures 5(a), 5(b), 5(c), and 5(d), exposure to LPS significantly elevated the mRNA expression levels of proinflammatory cytokines, including TNF-α, IL-6, IL-1β, and IL-18. However, treatment with BBR-LNPs markedly reduced the mRNA levels of these factors. We also examined how BBR-LNPs influence pyroptosis in the OGD/R model using BV2. The findings, shown in Figures 5(e) and 5(f), demonstrate that BBR-LNPs markedly reduced the OGD/R-induced upregulation of PTGS2, NLRP3, caspase-1, and GSDMD-N expression. In accordance with these results, immunofluorescence studies verified that BBR-LNPs significantly decreased the rise in PTGS2 expression caused by OGD/R (Figure 5(g)). In addition, results from the ELISA illustrated that BBR-LNPs effectively reduced the increased release of IL-1β and IL-18 triggered by OGD/R (Figure 5(h)). Within the OGD/R model involving HT-22 hippocampal neurons, we evaluated the effects of BBR-LNPs on the production of ROS in the cells. The findings, presented in Figures 5(i) and 5(j), reveal that BBR-LNPs notably decreased the release of ROS caused by OGD/R. Overall, our results imply that BBR-LNPs significantly mitigate pyroptotic damage resulting from ischemia–reperfusion and LPS stimulation, suggesting that BBR-LNPs exhibit exceptional neuroprotective attributes.
Details are in the caption following the image
BBR-LNPs reduce pyroptosis triggered by either LPS or OGD/R. The mRNA expression levels of TNF-α (a), IL-6 (b), IL-1β (c), and IL-18 (d) across all groups are presented. (e)-(f). Western blot analyses for PTGS2, NLRP3, caspase-1, and GSDMD-N in the respective groups. (g) Representative immunofluorescence staining showing PTGS2 expression, with red signals indicating positive PTGS2 staining and blue signals for DAPI. Scale bars, 20 μm. (h) The results of the ELISA for IL-1β and IL-18 levels in each group. (i)-(j). The assessment of ROS release levels in each group, as determined by flow cytometry (n = 3, ∗∗, p < 0.01).

3.6. BBR-LNPs Reduce CIRI by Inhibiting Pyroptosis in MCAO/R Mice

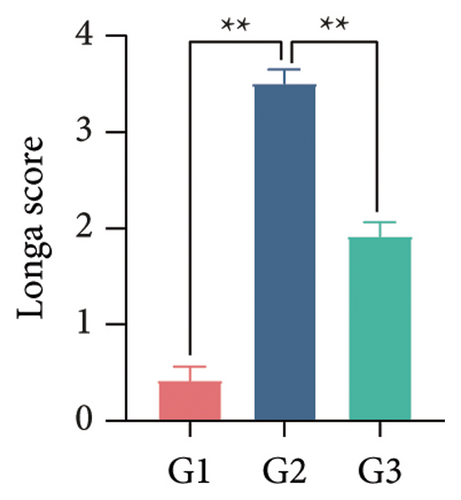
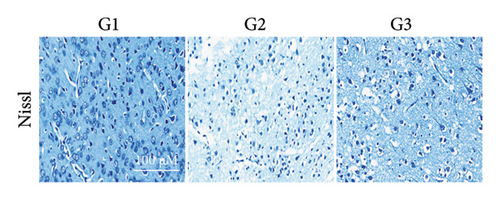
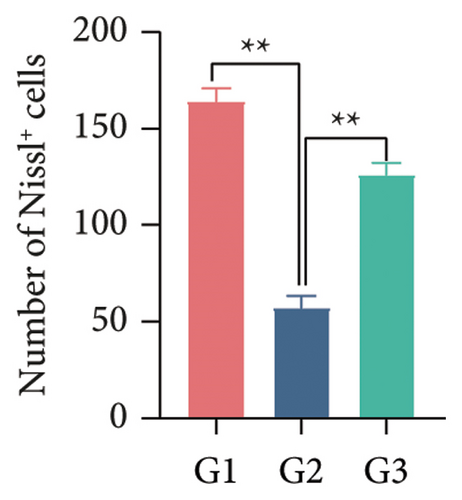
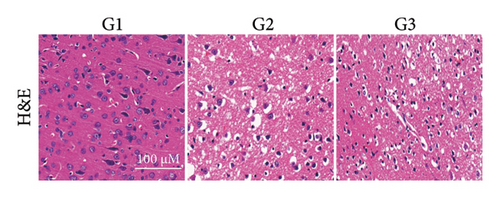
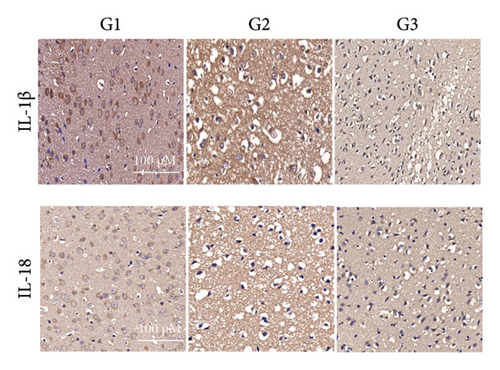
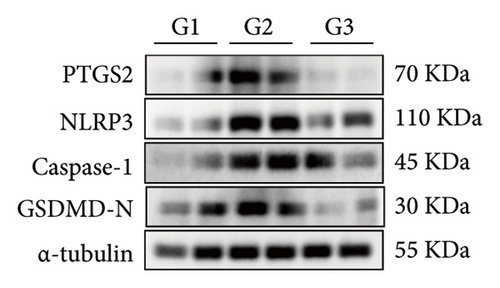
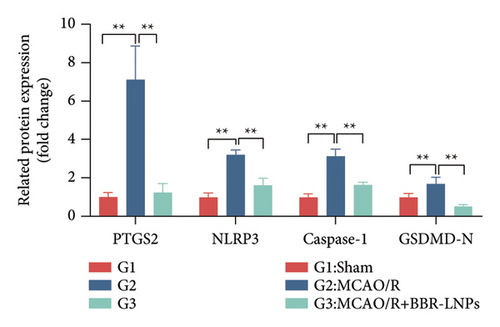
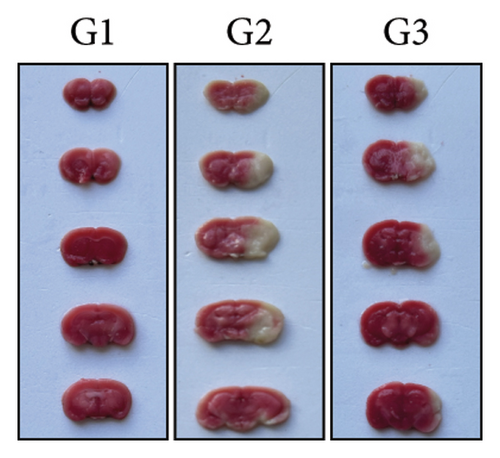
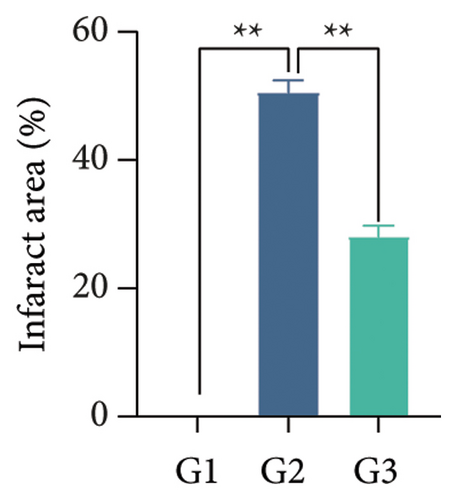
Our earlier findings indicated that BBR-LNPs considerably decrease cell pyroptosis and apoptosis caused by LPS and OGD/R in vitro. To further explore the protective benefits of BBR-LNPs in the MCAO/R mouse model, we conducted additional experiments. BBR-LNPs were given to the mice through intraperitoneal injection 1 week before the procedure. Following this, we evaluated the brain infarct size and neurological function scores with the use of TTC staining. As shown in Figures 6(a), 6(b), and 6(c), the administration of BBR-LNPs led to a significant decrease in brain infarct volume and a notable enhancement in neurological function scores in MCAO/R mice. Furthermore, the histopathological examination indicated that BBR-LNP treatment resulted in an increase in the quantity of Nissl-stained neurons in these mice (Figures 6(d) and 6(e)), as well as a reduction in brain damage (Figure 6(f)). Additionally, the analysis of immunohistochemical markers related to pyroptosis, specifically IL-1β and IL-18, revealed that BBR-LNP treatment considerably curtailed the upregulation of IL-1β and IL-18 expression triggered by MCAO/R (Figure 6(g)). Furthermore, the Western blot analysis indicated that BBR-LNPs significantly lowered the protein expression levels of PTGS2, NLRP3, caspase-1, and GSDMD-N in response to MCAO/R (Figures 6(h) and 6(i)). In conclusion, our results imply that BBR-LNPs have inhibitory effects on IRI, likely through direct interaction with PTGS2, thereby modulating the pyroptosis induced by the ischemia–reperfusion event.
Details are in the caption following the image
BBR-LNPs reduce CIRI by inhibiting pyroptosis in MCAO/R mice. (a) Sample images of TTC staining for each group. (b) The infarcted regions of mouse brain sections across the various groups. (c) Longa scores for mice categorized by the group. (d)-(e). Sample images of Nissl staining from the different groups. (f) Images of H&E staining representative of each group. (g) Sample images from immunohistochemical analysis of IL-1β and IL-18. Scale bars, 100 μm. (h)-(i) Western blot analysis indicating the levels of PTGS2, NLRP3, caspase-1, and GSDMD-N across all groups. Representative images of TTC staining in each group (n = 3, ∗∗, p < 0.01).

4. Discussion

A newly recognized form of programmed inflammatory cell death, pyroptosis is defined by the activation of the NLRP3 inflammasome, the involvement of caspase-1 in cell death, and the creation of pores in the GSMDD membrane. Recent research has demonstrated that pyroptosis plays a crucial regulatory role in both ischemic stroke and CIRI [9, 30]. Extensive inflammation and pyroptosis were observed in MCAO/R mice and patients. Blocking pyroptosis can significantly reduce IRI, suggesting that inhibiting pyroptosis may become a new treatment modality for ischemic stroke [11, 31].

PTGS2 encodes cyclooxygenase 2 (COX-2), which plays an important role in inflammatory responses and pyroptosis. Its inhibitors have been used in clinical anti-inflammatory treatments for decades [32, 33]. A recently study has revealed PTGS2 in the regulation of ferroptosis induced by cerebral ischemia–reperfusion [34]. Additionally, Zhou et al. reported that PTGS2 is identified as a hub gene in the regulation of ferroptosis and pyroptosis [15]. Therefore, PTGS2 plays an important role in the regulation of ferroptosis and pyroptosis, but there are few studies on its regulation of pyroptosis. Based on data from the GEO database, we found that PTGS2 has an important regulatory role in patients with ischemic stroke. Furthermore, we found that PTGS2 is a direct target of BBR. Inhibition of the expression PTGS2 reduced the activation of NLRP3 inflammasome and the release of IL-β and IL-18 and reduced the expression of caspase-1 and GSDMD-N. A phase II, randomized, double-blind, multiple-dose, active-controlled clinical trial reported that edaravone dexborneol was safe and efficient for acute ischemic stroke patients [35]. It indicated that edaravone dexborneol may be a good option for the treatment of ischemic stroke. Interestingly, an additional study confirmed that compound edaravone could alleviate LPS-induced acute lung injury by concentration-dependently decreased LPS-induced IL-6 production and COX-2 expression in mice [36]. These studies suggest that targeting PTGS2 is a potentially effective target for the treatment of inflammation or pyrosis. The development of drugs targeting PTGS2 has important clinical value and significance for the treatment of stroke, neuroinflammation, and other diseases.

Many Chinese herbal extracts such as Huanglian, Ginsenoside, Chengpi, and liquiritin have been reported to be able to resolve excessive inflammation in stroke [3740]. In our present study, we have discovered that BBR possesses therapeutic efficacy in colitis through repressing pyroptosis in BV2 induced by OGD/R or LPS. It displayed dose-dependent inhibition of the expression of PTGS2. Furthermore, the results of molecular docking, CETSA, and DARTS assay revealed that BBR interacted with PTGS2. However, BBR is a very low water solubility substance, which encouraged us to develop a novel BBR delivery method for clinical application. In response to the abovementioned problems, we developed BBR-LNPS through the technology of liposome nanomaterial encapsulation and verified its significant anti-inflammatory, inhibition of pyroptosis, improvement of cerebral IRI, and neurological function in vitro and in vivo. The drug delivery of lipid nanoparticles has been widely concerned for a long time because of its high encapsulation rate, good targeting, and low toxicity. In our study, we evaluated the effect of BBR-LNPS on brain IRI by inhibiting pyroptosis in an in vitro and in vivo model of ischemic stroke. However, there are some limitations to our study. First of all, our nanoliposome drug (BBR-LNPs) was injected into mice through intravenous administration, and we did not test whether BBR-LNPs penetrated the blood–brain barrier and its distribution in the brain through experimental methods, which is a problem that must be considered in our future research. Secondly, we lack a large number of animal experiments, and the results of animal experiments on primate models, small animals, and humans are very different. This is also something that will have to be considered in the future.

In summary, our study has identified BBR-LNPs as promising candidates for the treatment of ischemic stroke through the inhibition of pyroptosis in conjunction with PTGS2. Additionally, our findings suggest that PTGS2 plays a regulatory role in pyroptosis, potentially providing a novel target for the development of therapeutic agents for ischemic stroke.

Conflicts of Interest

The authors declare no conflicts of interest.

Author Contributions

Conceptualization: Peng Xie and Wenfeng Yu; methodology: Peng Xie, Mingyan Xia, and Wenpeng Cao; investigation and analysis: Peng Xie, Mingyan Xia, and Wenpeng Cao; writing: Peng Xie and Wenfeng Yu; supervision: Zhenkui Ren and Wenfeng Yu. All authors actively discussed and reviewed the manuscript. Peng Xie, Mingyan Xia, and Wenpeng Cao contributed equally to this work.

Funding

This study was funded by the National Natural Science Foundation of China, 82060232 and 82160225; the Basic Science Technology Project of Guizhou Province, China, ZK [2021] 412; the Department of Education of Guizhou Province, Guizhou Teaching and Technology [2023] 015; Key Projects of Science and Technology Fund of Guizhou Provincial Department of Science and Technology, Qiankeheji [2020] 1Z060; and “Thousand Levels” of Guizhou Province High level Innovative Talents, grant no. gzwjrs 2023-012.

Acknowledgments

The authors extend their appreciation for the assistance provided by the National Natural Science Foundation of China (nos. 82060232 and 82160225), the Basic Science Technology Project of Guizhou Province (grant no. ZK [2021] 412), the Guizhou Provincial Department of Education (Guizhou Teaching and Technology [2023] 015), and the Key Projects of the Science and Technology Fund from the Guizhou Provincial Department of Science and Technology (no. Qiankeheji [2020] 1Z060). Additionally, they acknowledge support from “Thousand Levels” of Guizhou Province High level Innovative Talents (grant no. gzwjrs 2023-012).

    Data Availability Statement

    Data will be made available on request.

      The full text of this article hosted at iucr.org is unavailable due to technical difficulties.