Caffeine Promotes Adipocyte Autophagy Through the AMPK/SIRT1 Signaling Pathway and Improves High-Fat Diet–Induced Obesity and Leptin Resistance
Abstract
Purpose: Caffeine has been widely studied for its lipid-lowering and blood-glucose–lowering effects. This study aimed to investigate whether caffeine can regulate adipocyte autophagy through the AMPK/SIRT1 signaling pathway, both in vivo and in vitro, thereby exerting a hypoglycemic effect.
Method: Western blot analysis was conducted to assess changes in the expression levels of FASN, ACC, pACC, SIRT1, LC3II/I, and pAMPKα in 3T3-L1 cells following caffeine treatment. The size of the lipid droplets was evaluated using Oil Red O staining. Mito Tracker Red and qRT-PCR were employed to quantify the number of mitochondria in the cells. Six-week-old C57BL/6J mice were divided into three groups: control, high-fat diet (HFD), and HFD + caffeine. After 11 weeks of feeding, insulin resistance was assessed using insulin tolerance and glucose tolerance tests. The expression levels of AMPKα, SIRT1, PPARγ, P62, and LC3II/I in the adipose tissue of each group were measured using Western Blotting. Serum levels of triglycerides (TG), total cholesterol (TC), and leptin were determined by Elisa. Finally, hematoxylin and eosin (HE) staining was performed to observe the size of adipocytes in visceral adipose tissue.
Results: Caffeine significantly inhibits the expression of proteins associated with fat synthesis and reduces lipid droplet size in 3T3-L1 cells. In addition, caffeine robustly activates the AMPK/SIRT1 signaling pathway in 3T3-L1 cells, promoting autophagy and enhancing mitochondrial biogenesis. In animal models, caffeine effectively attenuates weight gain and insulin resistance induced by a HFD while reducing serum TG and TC levels. Furthermore, caffeine suppresses leptin resistance and mitigates the increased food intake associated with a HFD. Notably, caffeine enhances AMPKα phosphorylation levels and SIRT1 expression in visceral fat, facilitating adipocyte autophagy and reducing lipid accumulation. At the cellular level, caffeine significantly promotes mitochondrial biogenesis.
Conclusion: Caffeine enhances autophagy in adipocytes by activating the AMPK/SIRT1 signaling pathway of adipocytes, contributing to antiobesity effects and improving insulin resistance.
1. Introduction
Obesity has emerged as a critical public health concern worldwide. According to the World Health Organization (WHO), it is projected that by 2025, approximately one-fifth of adults globally will be affected by obesity [1]. The primary cause of obesity is the excessive accumulation of lipids, which leads to adipocyte hypertrophy and reduced insulin sensitivity [2]. Furthermore, obesity significantly contributes to various metabolic disorders, including Type 2 diabetes [3], coronary heart disease [4], and nonalcoholic fatty liver disease [5]. Current therapeutic approaches for obesity primarily focus on dietary regulation to reduce energy intake and increase energy expenditure. In addition, there is a growing interest in adjunctive pharmacotherapy for managing obesity [6–8]. However, many obesity treatments have side effects, leading to increased attention on natural products with fewer adverse effects.
AMP-activated protein kinase (AMPK) has emerged as a key target for metabolic regulation and a potent inhibitor of obesity [9, 10]. Similarly, sirtuin 1 (SIRT1), a crucial protein involved in nutrient homeostasis and energy metabolism, is closely associated with AMPKα. Research has shown that SIRT1 activators can enhance lipid accumulation in adipocytes by activating the SIRT1–AMPK signaling pathway [11]. In addition, the activation of AMPK/SIRT1 in adipose tissue is an important signaling cascade for improving insulin resistance [12]. Both AMPK and SIRT1 play critical roles in regulating cellular autophagy [13, 14]. Mitochondria, central to energy metabolism, are significant contributors to insulin resistance and obesity due to mitochondrial dysfunction [15]. Studies have revealed strong links between phosphorylation-mediated activation of AMPK/SIRT1 and mitochondrial function, as well as adipose tissue energy metabolism [16, 17].
Caffeine, an abundantly available alkaloid found in coffee and tea, is widely integrated into both food and nonfood products because of its plentiful supply and unique mood-boosting properties [18]. Studies have demonstrated that caffeine possesses various biological activities, such as antitumor effects, protection against fatty liver disease, and promotion of lipid metabolism [19–22]. Recent research on caffeine has further uncovered its significant influence on enhancing lipid metabolism [23, 24]. In addition, as an inducer of autophagy pathways, caffeine can alleviate inflammation and oxidative stress by activating autophagy mechanisms [25, 26]. Studies have also shown that caffeine can improve a variety of diseases by activating autophagy via the AMPK signaling pathway [27, 28].
The aim of this study was to explore the potential role of caffeine in regulating adipocyte autophagy via the AMPK/SIRT1 pathway, thus ameliorating obesity, insulin resistance, and leptin resistance induced by a high-fat diet (HFD) in mice. The results of both in vivo and in vitro experiments offered insights into the underlying mechanism by which caffeine exerts its antiobesity effects.
2. Materials and Methods
2.1. Cell Culture
The 3T3-L1 cells were purchased from Kunming Cell Bank, Chinese Academy of Sciences, and 3T3-L1 cells were maintained in complete Dulbecco’s modified Eagle’s medium (DMEM) in a humidified 5% CO2 incubator at 37°C. The complete DMEM included DMEM (MEILUNBIO, Dalian, China), 10% (v/v) fetal bovine serum (FBS) (Biological Industries), 100 U/mL penicillin, and 0.1 mg/mL streptomycin (MEILUNBIO, Dalian, China). 3T3-L1 cells were cultured with differentiation DMEM 1 for 2 days, and then change the differentiation medium 2 continue to culture for 2 days. Finally, the complete DMEM was replaced every 2 days until the differentiation was completed. The differentiation DMEM 1 contained 10% FBS, 0.5 mmol/L 3-isobutyl-1-methylxanthine (IBMX) (Yuanye, Shanghai, China), 2.5 mmol/L dexamethasone (Dex) (Sigma-Aldrich), and 8.7 mmol/L insulin. The differentiation DMEM 2 contained 10% FBS and 10 mmol/L insulin [29].
2.2. Western Blot
The differentiated 3T3-L1 adipocytes were starved for 12 h using serum-free DMEM and then treated with different doses of caffeine without changing the medium. Cells and animal tissues were treated with RIPA lysate (Solarbio, Beijing, China) containing 1% PMSF and 1% protein phosphatase inhibitor (Solarbio, Beijing, China). The protein concentration was determined by the BCA method, and the protein was separated using SDS-PAGE gel of 8%, 10%, or 15% according to the molecular weight of the target band, and finally, transferred to a 0.45 μM PVDF membrane (Millipore, USA). The PVDF membrane was enclosed in 5% (w/v) skim milk powder for 1 h and then incubated with different primary antibodies at 4°C overnight. The antibodies included SIRT1 #2028 (1:1000), AMPKα #2532 (1:1000), pAMPKα #2535 (1:1000), PPARγ #2443 (1:1000), LC3II/I #4108 (1:1000), P62 #5114 (1:1000), FASN #3180 (1:1000), ACC #3676 (1:1000), and pACC #3661 (1:1000) from Cell Signaling Technology and then incubated with rabbit or mouse secondary antibodies bound with horseradish peroxidase at room temperature for 1 h. After three washes of TBST, immunoimprinting is visually detected with enhanced chemiluminescent substrates (MEILUNBIO, Dalian, China) and FluorChem E imaging systems. Western Blot analysis was performed using ImageJ software.
2.3. Cell Viability Assay
We used a cell counter to count cells and adjust cell density to ensure that there were 20,000–50,000 cells per well. After the plate was connected, it was cultured in an incubator for 24 h. The serum-free DMEM mixed with drugs was used for grouping treatment: control group; 0.125 mM, 0.25 mM, 0.5 mM, 1 mM, 2 mM, 4 mM, and 8 mM. After drug treatment for 24 h, methylthiazolyl tetrazolium (MTT) (20 μL/well) was added away from light and continued to be placed in the incubator for 4 h. After the treatment, the medium was carefully sucked away, DMSO (200 μL/well) was added, and the absorption value was dissolved by vibration in the shaper for 20 min. The light absorption value was detected with the wavelength of 492 nm using the enzymoleter to calculate the survival rate of the cells.
2.4. Animal Experiments
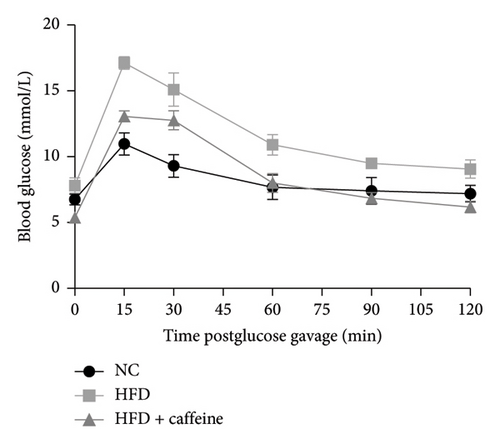
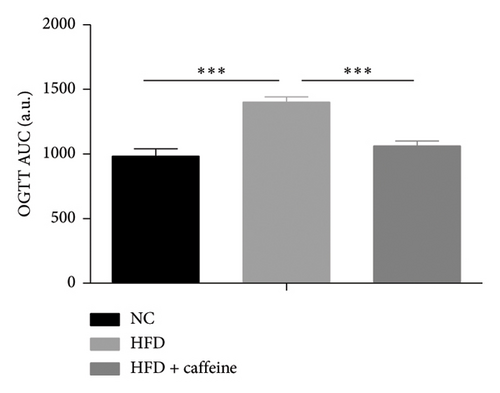
All animal experiments were approved by the Ethics Committee of Yunnan Agricultural University. The approval number is YUAN2022LLWYH005-8. Male mice of 6-week-old C57BL/6J were used in the study purchased from Changzhou Cavins Laboratory Animal Co., LTD, and 5 mg/mL caffeine solution in sterile water was prepared for animal experiments. At the beginning of the experiment, the mice were divided into 3 groups: the control group, fed maintenance feed (11.1% fat, 21.5% protein, and 67.4% carbohydrate, Xietong Shengwu, 1,010,001) and the model group (HFD group), fed HFD (60% fat, 20% protein, and 20% carbohydrate, Research Diets, D12492). In the drug treatment group (HFD + caffeine group), a dose of 40 mg/kg body weight per day caffeine [30] solution was given by gavage, while HFD was fed. The weight, food intake, and water intake of the three groups of mice were recorded once a week. In the last week of the study period, the mice in each group were subjected to an oral glucose tolerance test (OGTT) and an insulin tolerance test (ITT). Before the OGTT experiment, after fasting for 12 h, the oral glucose solution (2 g/kg) was taken, and then the blood glucose level of each group was measured at different time points. In the ITT experiment, after fasting for 4 h, insulin was injected subcutaneously (0.75 U/kg), and the blood glucose levels of each group of mice were measured at different time points. The area under the curve (AUC) of glucose levels over time was calculated to evaluate the glucose tolerance and insulin tolerance of the mice. After the experiment, the mice were euthanized after starvation for 12 h, after which, the whole blood was collected and serum was isolated. Serum was collected and the levels of total cholesterol (TC), triglyceride (TG), and leptin were detected according to different Elisa kit requirements.
2.5. Oil Red O Staining and Histology
After drug treatment, the 3T3-L1 cells were washed twice with 1 × PBS, fixed with 4% paraformaldehyde at room temperature for 20 min, washed twice with 1 × PBS, and then stained with ORO stain solution for 15 min. After discarding the solution, it was washed with water 5 times. The mouse adipose tissue was soaked with 4% paraformaldehyde, embedded in paraffin, sliced, and then stained with hematoxylin and eosin (HE) to complete the staining process. The photomicrograph was obtained through a microscope (Olympus CKX41).
2.6. Mitochondrial Staining
Cells were cultured in a petri dish using cell slides. When the cells reached the desired abundance, the culture medium was removed and a Mito Tracker Red CMXRos staining working medium preheated at 37°C was added. The used cells were incubated for 20 min under normal culture conditions. After staining, the nucleus is observed with a DAPI-containing tablet, which can be viewed under a confocal fluorescence microscope and photographed.
2.7. DNA Isolation and mtDNA Copy Number Assay
Quantitative real-time polymerase chain reaction (qRT-PCR) is the method of choice for mitochondrial DNA (mtDNA) copy number quantification. Using TB Green mixture (Vazyme Biotech, Nanjing) in real-time PCR instrument (Roche, Switzerland), first, total DNA was extracted from 3T3-L1 cells using DNA lift kits (DP304, TIANGEN, Beijing) and analyzed by qRT-PCR. The mitochondrially encoded cytochrome c oxidase subunit 2 (COX2) was employed to quantify mtDNA copy number and the data were normalized to the nuclear ribosomal protein s18 (rps18). The primer sequence is COX2: 5′-ATAACCGAGTCGTTCTGCCAAT-3′, 3′-TTTCAGAGCATTGGCCATAGAA-5′; Rsp18: 5′-TGTGTTAGGGGACTGGTGGACA-3′, and 3′-CATCACCCACTTACCCCCAAAA-5′.
2.8. Real-Time PCR Analysis
RNAiso Plus (9109, Takara, Japan) was used to extract total RNA from 3T3-L1 cells. Next, the mRNA is synthesized into cDNA according to the instructions of the PrimeScript FAST RT Reagent Kit with gDNA Eraser (RR092A, Takara, Japan). The RT-PCR assay was quantitatively analyzed using TB Green Premix Ex Taq II FAST qPCR (CN830A, Takara, Japan) and Roche 480 rapid real-time PCR systems. 2−ΔΔCT was used to calculate gene expression levels and normalized to β-Actin expression. The primer sequences are UCP-1: 5′-ACTGCCACACCTCCAGTCATT-3′, 3′-CTTTGCCTCACTCAGGATTGG-5′; Cidea: 5′-TGCTCTTCTGTATCGCCCAGT-3′, 3′-GCCGTGTTAAGGAATCTGCTG-5′; Prdm16: 5′-GATGGGAGATGCTGACGGAT-3′, 3′-TGATCTGACACATGGCGAGG-5′; β-Actin: 5′-CCTGAGGCTCTTTTCCAGCC-3′, and 3′-TAGAGGTCTTTACGGATGTCAACGT-5′.
2.9. Statistical Analysis
All results were analyzed and graphed using GraphPad Prism software, and all summary data were presented as the mean ± standard error of the mean (SEM). SPSS 22.0 software was used to conduct a one-way analysis of variance (ANOVA) and a t-test. A value of p < 0.05 was considered as statistically significant.
3. Results
3.1. Result 1: Structural Formula of Caffeine and Caffeine Toxicity to 3T3-L1 Cells
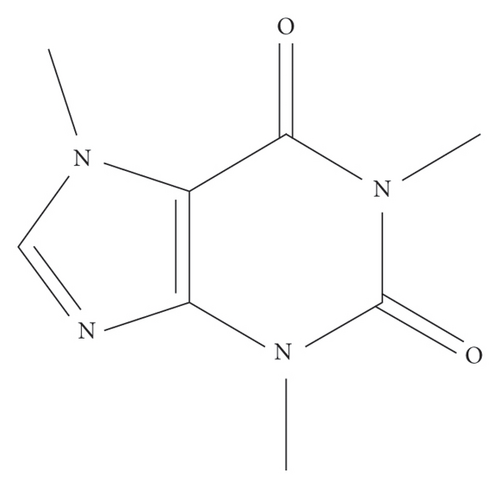
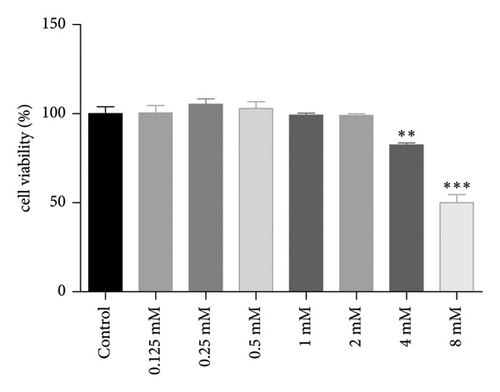
Caffeine is a xanthine alkaloid compound, and its structural formula is presented in Figure 1(a). To determine the effective concentration of caffeine, we initially evaluated its cytotoxicity on 3T3-L1 cells. Our results indicated that caffeine only exhibited cytotoxic effects solely when the concentration reached a high level of 8 mM, as shown in Figure 1(b). By integrating these results with Velickovic et al.’s research on caffeine-induced thermogenesis in adipose tissue [31], we established the optimal treatment concentration of caffeine.
3.2. Result 2: Caffeine Significantly Inhibited the Lipid Droplet Size in 3T3-L1 Cells
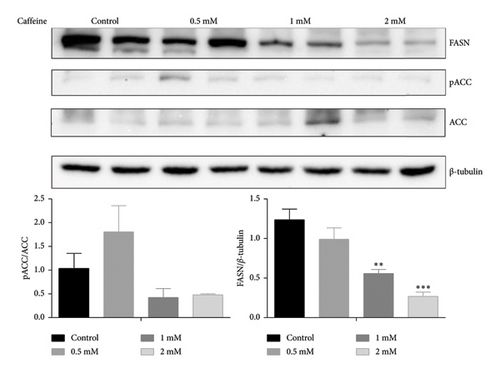
The 3T3-L1 cells can differentiate into mature adipocytes, making them suitable for studying obesity. FASN and ACC are regarded as protein markers indicating lipid synthesis [32]. As depicted in Figure 2(a), treatment with different concentrations of caffeine for 24 h significantly suppressed the expression levels of FASN and pACC. Moreover, Figure 2(b) shows that Oil Red O staining showed a substantial reduction in the size of lipid droplets in the treated 3T3-L1 cells after caffeine administration. These findings suggest that caffeine treatment effectively inhibits lipid synthesis in the 3T3-L1 cells.

3.3. Result 3: Caffeine Activates the AMPK/SIRT1 Signaling Pathway in 3T3-L1 Cells
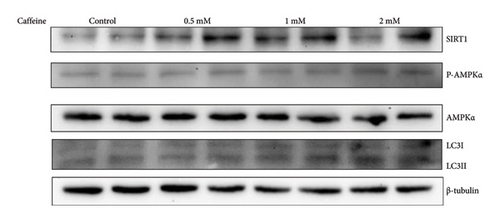
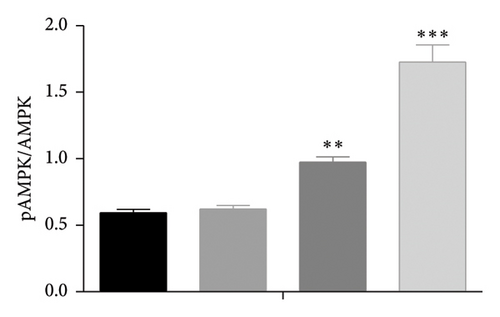
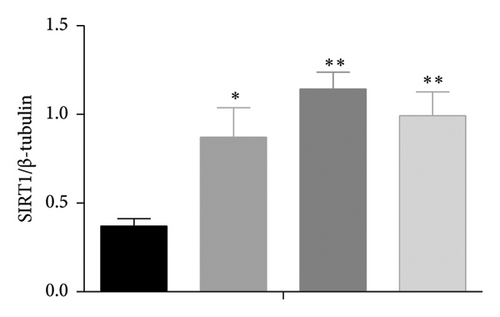
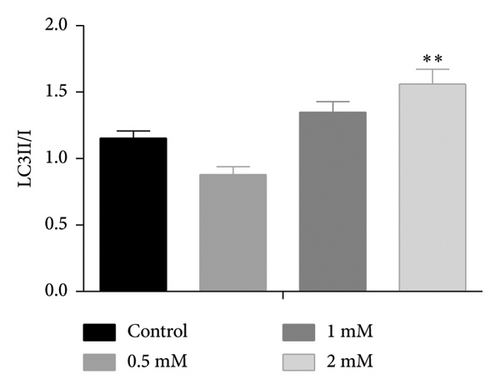
The AMPK/SIRT1 signaling pathway plays a crucial role in regulating energy metabolism [33, 34]. Previous studies have shown that caffeine treatment significantly suppresses the expression of fat synthesis genes such as FASN and pACC. In addition, autophagy has a substantial impact on the fat synthesis and accumulation [35], which is governed by the AMPK signaling pathway [36]. To investigate the effects of caffeine treatment on 3T3-L1 cells, we performed Western blot experiments to assess the expression levels of AMPKα and SIRT1. As shown in Figure 3, caffeine treatment significantly enhances the expression of pAMPKα and SIRT1 in 3T3-L1 cells and also markedly upregulates the autophagy marker protein LC3. These findings suggest that caffeine can activate autophagy in 3T3-L1 cells by modulating the AMPK/SIRT1 signaling pathway.
3.4. Result 4: Caffeine Significantly Improved Weight Gain and Insulin Resistance in HFD-Fed Mice
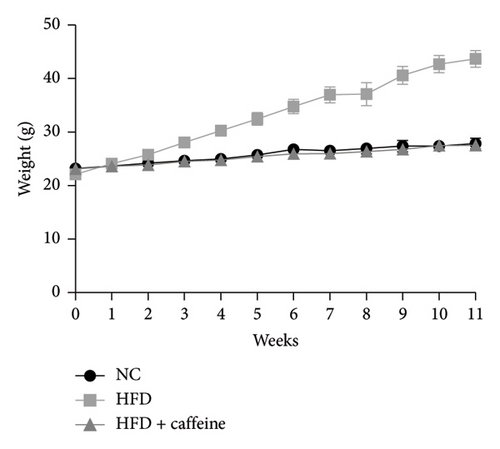
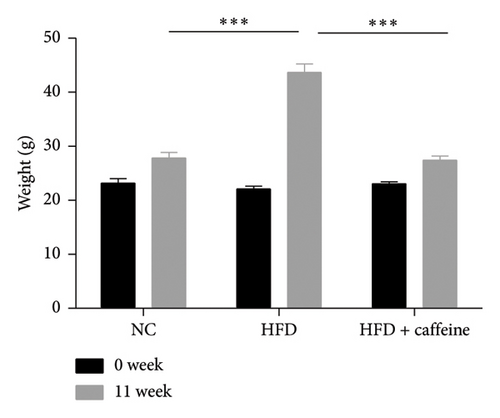
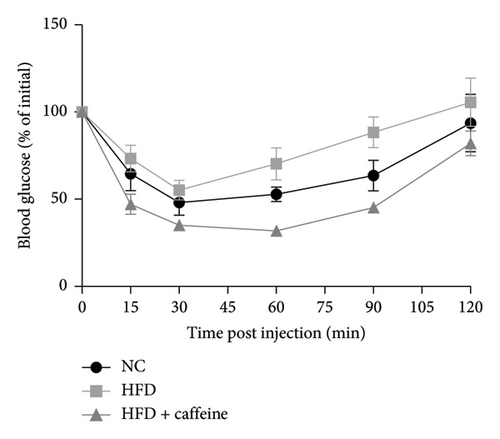
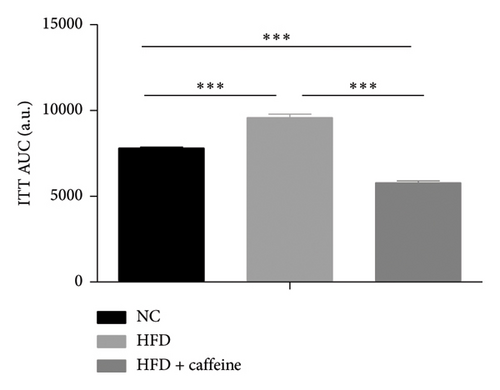
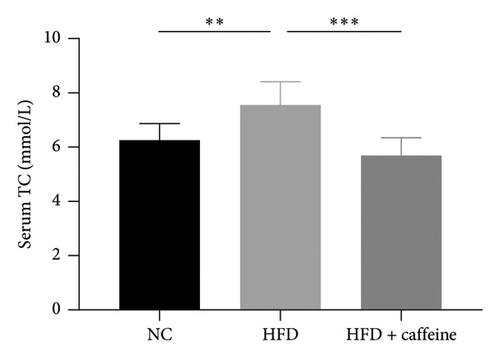
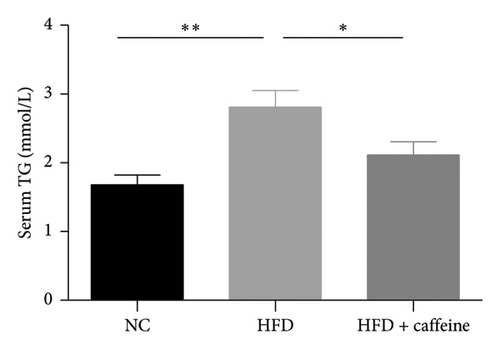
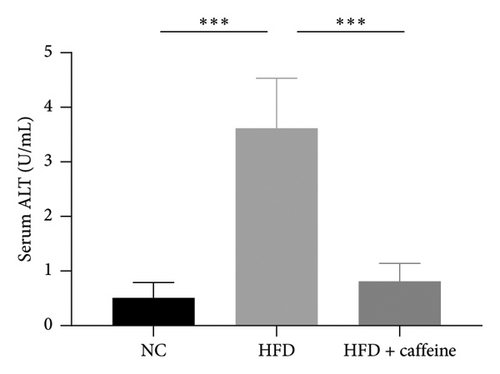
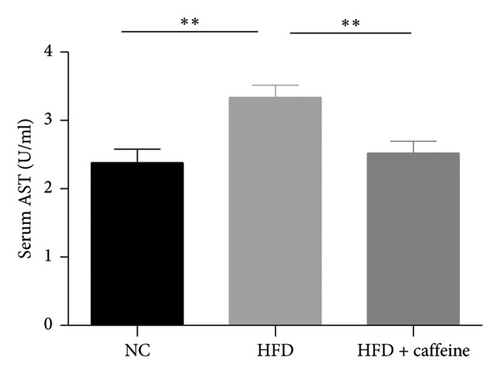
Weight gain and insulin resistance are crucial parameters for evaluating the establishment of the HFD mouse model [37]. As depicted in Figure 3(a), the caffeine-treated group had significantly lower body weight compared to the HFD group. At Week 11, OGTT and ITT were conducted on each group of mice, revealing that the caffeine group showed remarkable improvements in glucose tolerance and insulin sensitivity compared to the HFD group (Figures 4(c), 4(d), 4(e), and 4(f)). Furthermore, serum levels of obesity-related TG and TC were significantly reduced after caffeine treatment (Figures 4(g) and 4(h)). Meanwhile, the expression of liver damage markers AST and ALT was significantly inhibited, which is associated with improved insulin sensitivity (Figures 4(i) and 4(j)). These findings indicate that caffeine treatment effectively inhibits weight gain induced by HFD while improving insulin resistance.
3.5. Result 5: Caffeine Improved Leptin Resistance and Inhibited Food Intake
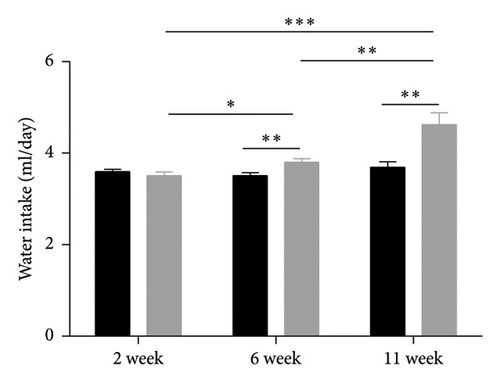
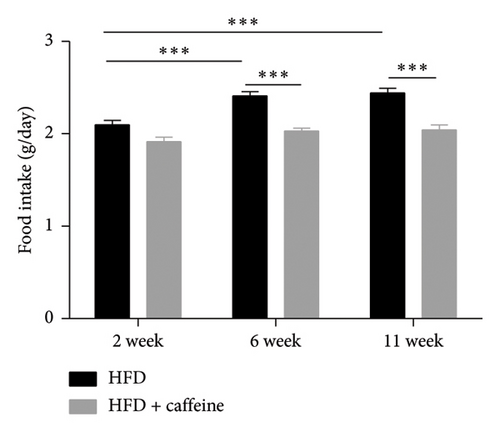
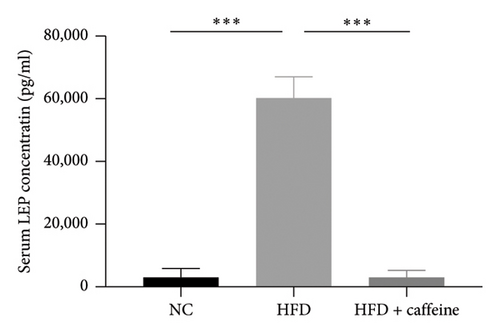
Leptin resistance is a contributing factor to the exacerbation of obesity, with elevated levels of leptin in conjunction with obesity providing direct evidence of this resistance [38]. During a high-fat feeding period, we monitored the food intake and water consumption of mice. It was observed that as the duration of feeding increased, there was a gradual rise in food intake among mice in the HFD group; however, no significant changes were noted in food intake among mice in the HFD + caffeine group (Figures 5(a) and 5(b)). Furthermore, when analyzing serum samples for leptin content, it was found that compared to the control group, there was a notable increase in serum leptin levels among mice from the HFD group. Conversely, no significant alterations were observed regarding serum leptin levels among mice from the HFD + caffeine group (Figure 5(c)). These results suggest that caffeine can effectively alleviate leptin resistance induced by a HFD.
3.6. Result 6: Caffeine Enhances Visceral Fat Cell Autophagy Through the AMPK/SIRT1 Signaling Pathway
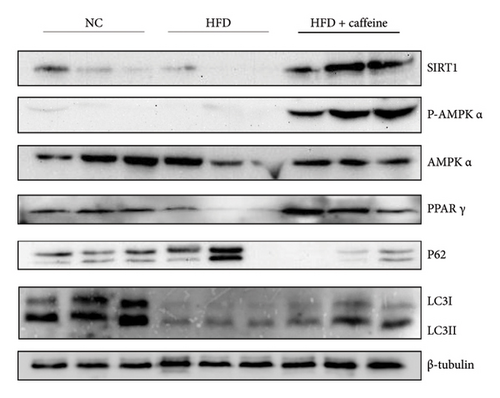
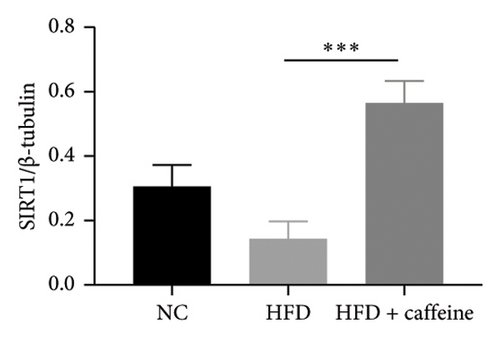
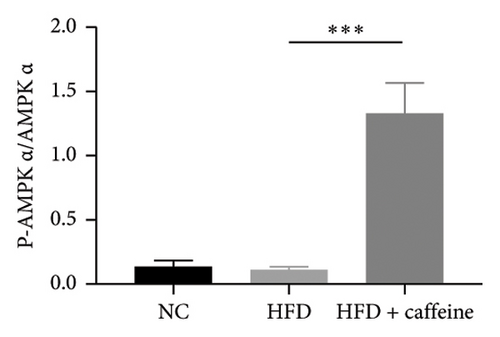
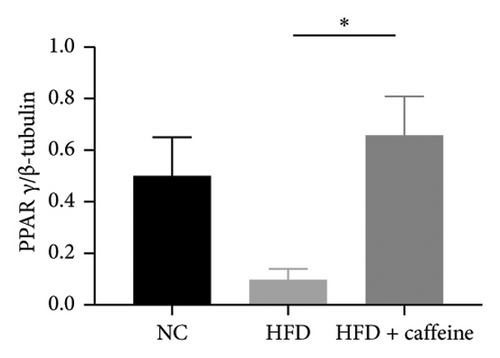
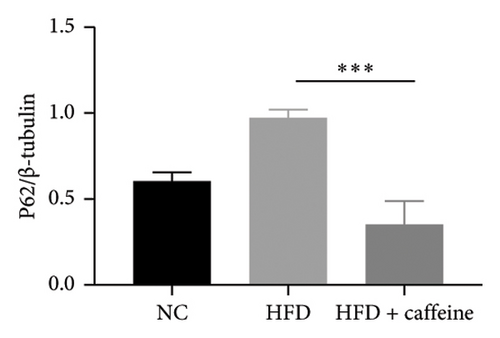
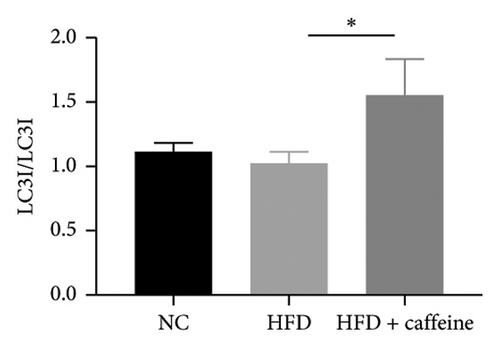
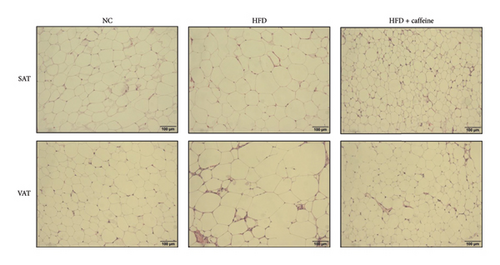
The activation of autophagy represents an effective strategy for ameliorating insulin resistance in obese mice [39]. Previous studies have demonstrated that caffeine can augment the expression of proteins involved in the AMPK/SIRT1 signaling pathway in 3T3-L1 cells, thereby improving insulin resistance in HFD-fed mice. Moreover, it has been established that AMPK/SIRT1 are pivotal regulators of autophagy [36]. Our experimental findings corroborate that caffeine treatment significantly upregulates pAMPKα and SIRT1 expression in HFD-induced adipocytes, while concomitantly downregulating the autophagy marker protein P62 and increasing the LC3II/LC3I ratio (Figures 6(a), 6(b), 6(c), 6(d), 6(e), and 6(f)). Histological analysis using HE staining revealed a marked reduction in lipid droplet size within subcutaneous and visceral fat tissues from the HFD + caffeine-treated group (Figure 6(g)). Collectively, these results indicate that caffeine activates autophagy specifically within visceral fat by modulating pAMPKα and SIRT1 expression.
3.7. Result 7: Caffeine Enhances Mitochondrial Biogenesis and Function
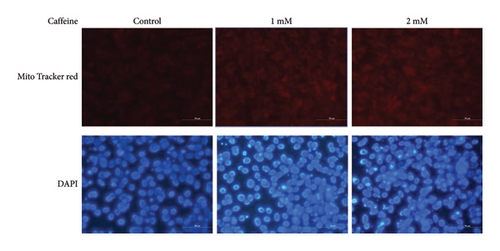
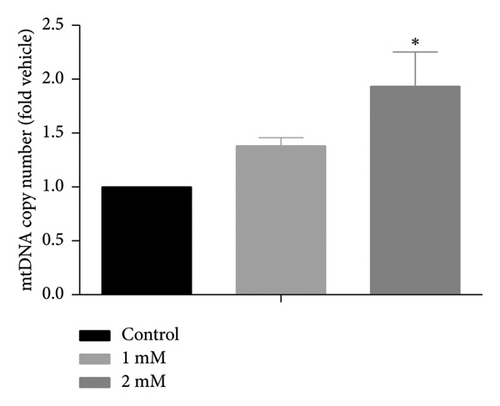
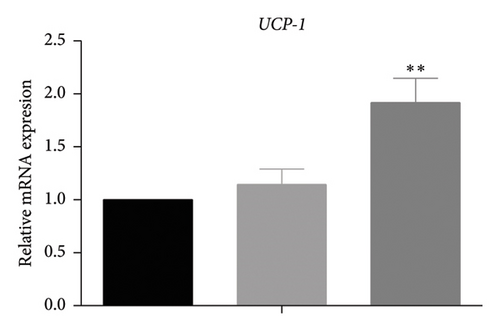
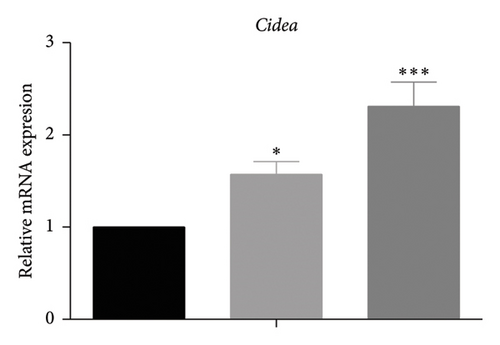
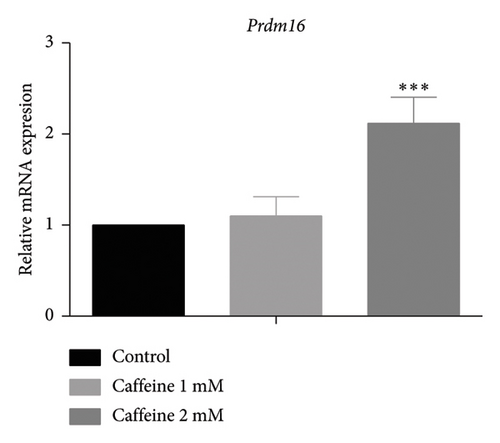
White fat browning significantly ameliorates metabolic disorders of glucose and lipids in obese mice. Previous studies have demonstrated that treatment with caffeine leads to a substantial upregulation of PPARγ expression, which has been shown to effectively promote white fat browning [40]. Therefore, we investigated the impact of caffeine on white fat browning in 3T3-L1 cells. Mitochondrial staining and quantification of mitochondrial copy numbers revealed a notable stimulation of mitochondria production upon caffeine treatment (Figures 7(a) and 7(b)). Concurrently, analysis of genes associated with brown fat transformation in 3T3-L1 cells indicated that caffeine treatments significantly enhanced the expressions of UCP-1, Cidea, and Prdm16 (Figures 7(c), 7(d), and 7(e)). These findings demonstrate how caffeine promotes the conversion of white adipose tissue into brown adipose tissue by stimulating mitochondria production. The above results suggest that caffeine has the potential to stimulate mitochondrial biogenesis and enhance mitochondrial function, thereby facilitating the browning process of white adipose tissue.
4. Discussion
Caffeine has been extensively studied for its therapeutic effects on various diseases, with a focus on its role in autophagy [26, 27, 41, 42]. Autophagy is recognized for its critical role in combating obesity and improving insulin resistance [43–45]. Our findings suggest that caffeine’s antiobesity and anti-insulin resistance properties may be partially due to the activation of autophagy in adipose tissue. Previous research indicates that caffeine can exert its antiobesity and insulin-sensitizing effects through multiple pathways, including modulation of gut microbiota [23], inhibition of neuronal activity [46], suppression of fat synthesis [47], and antagonism against adenosine receptors to enhance insulin sensitivity [48]. It is evident from these studies that high-dose and low-dose caffeine exhibit distinct roles in different diseases [26, 49, 50]. In our study, we initially evaluated the cytotoxicity of caffeine on 3T3-L1 cells using a MTT assay and observed cell toxicity only at a concentration exceeding 8 mM. Therefore, treatment with a high dose (2 mM) of caffeine in our experiments did not impact cell viability.
In this study, we treated differentiated 3T3-L1 cells with caffeine and observed a dose-dependent decrease in the expression of fatty acid synthesis proteins FASN and ACC. Furthermore, increasing doses of caffeine resulted in a reduction in adipocyte size. PPARγ and PPARα are key regulators of energy metabolism and fat synthesis [51]. Previous research has extensively investigated the role of PPARγ in brown adipose tissue thermogenesis and white adipose tissue browning [52]. It is plausible that the upregulation of PPARγ following caffeine treatment contributes to its beneficial impact on energy metabolism in adipocytes. A study by Van Schaik et al. also supports the positive effect of caffeine on promoting energy metabolism in obesity [53]. AMPK and SIRT1 play crucial roles in obesity [54], energy metabolism improvement [55], insulin resistance amelioration [56, 57], and mitochondrial biogenesis regulation [58]. Upon treating 3T3-L1 cells with caffeine, we observed significant increases in AMPKα phosphorylation and SIRT1 expression, as well as an elevation in autophagy-related protein LC3II/I expression levels. This suggests that caffeine can activate autophagy through the AMPK/SIRT1 signaling pathway to inhibit fat synthesis. These findings, combined with previous research, indicate that caffeine may substantially enhance energy metabolism while stimulating autophagy.
Caffeine effectively mitigates obesity induced by a HFD and improves insulin resistance. To align with the mice’s natural activity and feeding patterns, we administered a high dose of caffeine (40 mg/kg) at 9 p.m. to avoid disrupting their circadian rhythm, which could impact energy metabolism. Preliminary experiments and literature reports suggest that caffeine treatment significantly inhibits weight gain associated with a HFD. Obesity is linked to insulin resistance [59]. Through insulin and glucose tolerance tests, we observed a substantial improvement in insulin sensitivity in the caffeine-treated group compared to the HFD group, along with a trend toward decreased levels of serum TC and TG. At the same time, food intake is also an important indicator of obesity. This study monitored the food intake of mice in each group and found that caffeine intake could significantly inhibit the food intake of mice while limiting weight gain. However, the water intake results reflected that caffeine treatment significantly increased water intake in mice, which may be related to caffeine’s ability to enhance energy metabolism, which requires the participation of water [60].
Fat synthesis is regulated by multiple factors, and autophagy has been shown to effectively modulate obesity [44]. Caffeine can induce autophagy in adipocytes by activating the AMPK signaling pathway [61]. Analysis of visceral fat tissue from mice treated with caffeine revealed significant enhancements in pAMPK and SIRT1 expression levels, as well as increased expression of autophagy markers P62 and LC3II/I, indicating enhanced autophagy within visceral fat. These findings suggest that caffeine can enhance adipocyte autophagy via the AMPK/SIRT1 pathway. Leptin, associated with adipocyte size in visceral fat, is implicated in leptin resistance as mice weight increases [62]. Serum leptin levels were significantly lower in the caffeine-treated group compared to the HFD group after 11 weeks of treatment, consistent with the observed trend in adipocyte size. This indicates that caffeine not only improves obesity but also inhibits the development of leptin resistance. In addition, monitoring food intake and water consumption during feeding revealed that caffeine significantly improved increased food intake caused by obesity and leptin resistance.
Enhanced mitochondrial biogenesis significantly promotes thermogenesis in brown adipose tissue and induces browning of white adipose tissue [63]. Previous studies have shown that caffeine treatment markedly suppresses the expression of fatty acid synthesis proteins FASN and pACC, while upregulating the expression of PPARγ protein, which is involved in fatty acid synthesis. Notably, PPARγ substantially promotes mitochondrial biogenesis [64]. Subsequent staining of mitochondria and quantification of mitochondrial copy number in caffeine-treated 3T3-L1 cells revealed a significant promotion of mitochondrial biogenesis and an evident enhancement in markers associated with browning. These findings suggest that caffeine, while stimulating autophagy in white adipose tissue, also exerts a pronounced promoting effect on white adipose tissue browning.
5. Conclusion
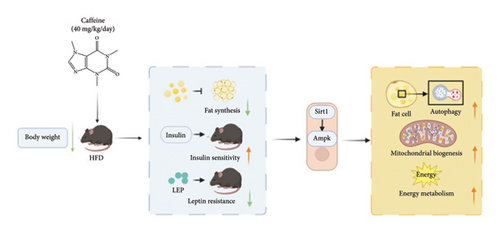
In conclusion, caffeine activates autophagy in adipocytes via the AMPK/SIRT1 signaling pathway, thereby inhibiting lipid accumulation. In obese mice induced by a HFD, caffeine notably suppresses weight gain and enhances insulin sensitivity and leptin responsiveness. In addition, our study demonstrates that caffeine significantly promotes mitochondrial biogenesis in 3T3-L1 cells. These results suggest that caffeine may ameliorate obesity through multiple pathways (Figure 8).
Nomenclature
-
- AMPKα
-
- AMP-activated protein kinase AMPKα
-
- SIRT1
-
- Sirtuin 1
-
- Cidea
-
- Cell death–inducing DNA fragmentation factor alpha-like effector A
-
- DMEM
-
- Dulbecco’s modified Eagle’s medium
-
- ALT
-
- Alanine aminotransferase
-
- AST
-
- Aspartate aminotransferase
-
- H&E
-
- Hematoxylin and eosin
-
- TG
-
- Triglycerides
-
- TC
-
- Total cholesterol
-
- COX2
-
- Cytochrome c oxidase subunit 2
-
- DAPI
-
- 4′,6-Diamidino-2-phenylindole
-
- UCP-1
-
- Uncoupling protein 1
-
- Prdm16
-
- PR domain containing 16
-
- P62
-
- Sequestosome 1 (SQSTM1)
-
- LC3II/I
-
- Microtubule-associated protein 1 light chain 3
-
- FASN
-
- Fatty acid synthase
-
- ACC
-
- Acetyl-CoA carboxylase
-
- VAT
-
- Visceral adipose tissue
-
- RT-PCR
-
- Real-time polymerase chain reaction
-
- SAT
-
- Subcutaneous adipose tissue
Conflicts of Interest
The authors declare no conflicts of interest.
Author Contributions
Wang Yinghao and Peng Wenyuan contributed equally to this work.
Funding
This work was supported by the Natural Science Foundation of China (Grant no. 81760667).
Open Research
Data Availability Statement
The authors confirm that the data supporting the findings of this study are available within the article.


