Royal Jelly Effect on Chronic Unpredictable Stress-Induced Pancreatic Oxidative and Endoplasmic Reticulum Stress and Insulin Secretion Impairment in Adult Male Rats
Abstract
Background: Royal jelly (RJ), secreted by nurse honeybees, possesses antioxidant properties. Studies have demonstrated that chronic stress can impair glucose metabolism, a process intricately linked to oxidative stress and endoplasmic reticulum (ER) stress induction. Consequently, this study investigated the effects of RJ on oxidative stress, apoptosis and ER stress markers, and insulin secretion from isolated pancreatic islets in rats subjected to chronic unpredictable stress (CUS).
Method: Four groups were established, comprising adult male rats: None-STR-Water, STR-Water, None-STR-RJ, and STR-RJ. Over 4 weeks, CUS was applied, and RJ was administered via oral gavage. A glucose tolerance test was conducted, and fasting blood samples were collected to analyze corticosterone, leptin, antioxidants, and malondialdehyde (MDA) plasma levels. Additionally, pancreatic oxidative stress and ER stress markers, apoptosis indicators, and insulin secretion from isolated pancreatic islets were evaluated.
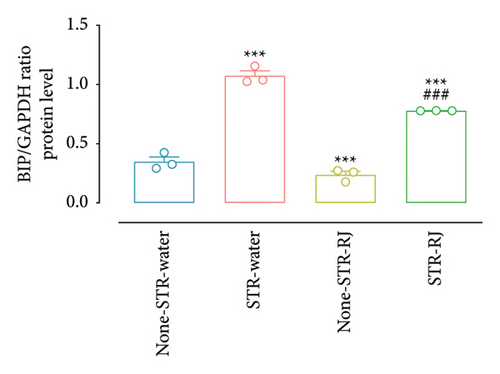
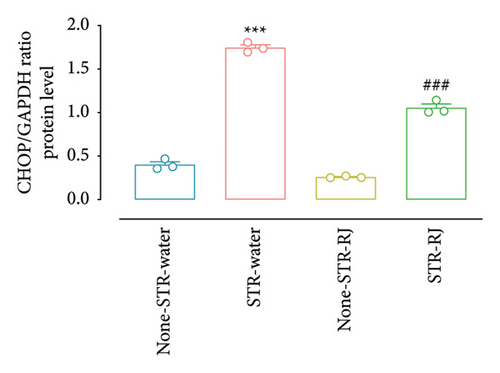
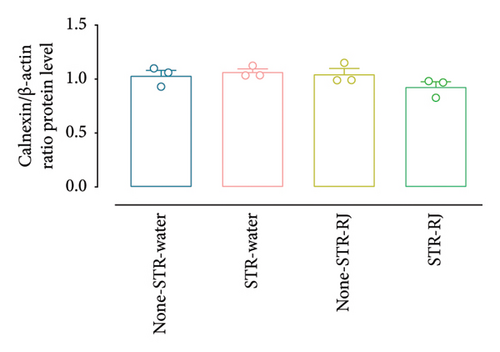
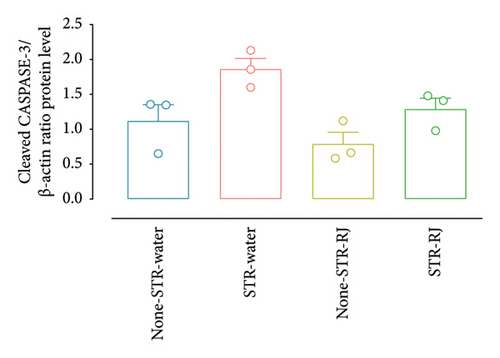
Results: Exposure to CUS increased plasma corticosterone and leptin levels, catalase activity and glutathione (GSH) levels in both plasma and pancreatic tissue and reduced plasma MDA levels. RJ administration in the STR-RJ group restored the mentioned parameters. Furthermore, CUS elevated pancreatic BIP, CHOP, and cleaved CASPASE-3 protein levels; however, these levels were diminished following RJ treatment. The CALNEXIN protein level remained unchanged between the study groups. In the STR-Water group, glucose-stimulated insulin secretion was diminished, whereas in the RJ-treated groups, insulin secretion from islets in response to the high glucose concentration was significantly enhanced.
Conclusion: The administration of RJ, in conjunction with CUS exposure, may protect the normal insulin response to glucose by mitigating oxidative stress, as evidenced by the restoration of catalase activity and GSH levels, and ER stress, as supported by the decrease in BIP and CHOP protein levels.
1. Introduction
Stress is recognized as a significant contributing factor to many disorders, positioning it as a considerable risk factor for diverse diseases [1, 2]. Studies have demonstrated that chronic stress can precipitate insulin resistance, hyperglycemia, and diminished insulin secretion, potentially culminating in diabetes by disrupting glucose metabolism [3, 4]. Chronic unpredictable stress (CUS), characterized by the administration of varied stressors in an unpredictable manner to preclude habituation, serves as a model to mimic the erratic nature of real-life stressors [5]. CUS primarily manifests its effects through the prolonged activation of the hypothalamic–pituitary–adrenal (HPA) axis [6]. This overactivation leads to elevated plasma glucocorticoid levels [7], adversely affecting glucose homeostasis [8, 9].
Increased glucocorticoid levels are associated with generating reactive oxygen species (ROS) and the onset of oxidative stress, a consequence of either hyperglycemia or the subsequent glycation process [10, 11]. Concurrently, the endoplasmic reticulum (ER), an organelle crucial for protein folding and post-translational modifications, may be impacted by excessive glucocorticoid levels [12]. Evidence suggests that high glucocorticoid concentrations are instrumental in inducing ER stress [12–14]. Considering the capacity of glucocorticoids to trigger oxidative and ER stress, these key factors appear to be pivotal in the development of metabolic disorders induced by CUS [15–17]. Moreover, as the initial stages of insulin synthesis occur within the ER of pancreatic β-cells, ER stress in these cells could reduce insulin synthesis [18]. Furthermore, oxidative and ER stress have been implicated in triggering apoptosis in pancreatic β-cells [19], potentially impairing glucose metabolism following chronic stress exposure.
Nutritional supplements with antioxidant capacity offer a promising approach to preventing diseases associated with oxidative stress [20]. Royal jelly (RJ), secreted by worker bees’ mandibular and hypopharyngeal glands, is rich in phenolic compounds with potential free radical scavenging capabilities [21, 22]. Given the antioxidative properties of RJ and its potential to mitigate the interrelated oxidative and ER stress, RJ may improve metabolic disorders resulting from such stress. Previous studies suggest that RJ can normalize imbalanced insulin and glucose plasma levels [23, 24] and ameliorate insulin resistance induced by oxidative stress [25].
Considering the antioxidative nature of RJ and the adverse effects of CUS on oxidative status and ER homeostasis, this study aims to evaluate the influence of RJ on markers of oxidative stress (catalase activity, GSH levels, and MDA concentrations), ER stress (binding immunoglobulin protein (BIP), CCAAT-enhancer-binding protein homologous protein (CHOP) and CALNEXIN expression), and apoptosis (cleaved CASPASE-3 expression) in plasma and/or pancreatic tissue in adult male rats subjected to CUS. Additionally, acknowledging the pivotal role of insulin secretion from pancreatic Langerhans islets in maintaining glucose homeostasis, this research also investigates the effect of RJ on insulin secretion in response to glucose concentrations of 5.6 and 16.7 mM under the condition of CUS.
2. Materials and Methods
2.1. Animals
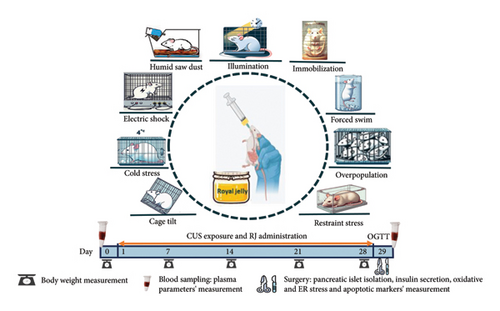
Male Wistar rats, obtained from the Neuroscience Research Center, were utilized for this study. The rats had an average weight of 200 ± 20 g at the outset of the experiment. In this study, each group consisted of 16 rats, in which in a random manner, six rats were used to evaluate plasma and pancreas biochemical parameters, another six rats were assigned for the oral glucose tolerance test (OGTT), and the remaining four rats were utilized for isolating pancreatic islets and insulin release assay. Every pair of rats was housed in a cage located within a controlled environment with a temperature of 22 ± 2°C and a consistent 12-h light/12-h dark cycle. The rats had unrestricted access to food (standard pellets, Pars Production, and distribution of animal feed company, Iran) and water. After 2 weeks of acclimatization, the animals were randomly allocated into four groups as follows: None-stress (STR)-Water (the animals were not under CUS and received water), STR-Water (the animals were under CUS and received water), None-STR-RJ (the animals were not under CUS and received RJ), and STR-RJ (the animals were under CUS and received RJ). Stress was applied for 4 weeks, and the RJ (200 mg/kg) [26–28], diluted in 1 mL distilled water, was administered once daily at 08:00 a.m. before the initiation of stress session. Administration was conducted by oral gavage throughout the entire 4-week period of stress exposure (Figure 1). RJ was directly supplied from a natural honey producer (Parchin, Nir County, Ardabil Province, Iran, with coordinates 37°57′00″N latitude and 48°11′57″E longitude). Ethical approval for the experimental protocols was obtained from the animal care and use committee at the Shahid Beheshti University of Medical Sciences (IR.SBMU.AEC.1401.065).
2.2. CUS Paradigm
The CUS model for stress induction was performed according to the Katz technique with some modifications [29]. The stressed groups were submitted to CUS for four weeks (n = 16 rats/group). The stressors were as follows: restrainer (2 h, in 11 × 8 × 8 plexus glass restrainer), forced swim (15 min, in 50 cm height × 20 cm diameter glass cylinder with a water temperature of 4 ± 1°C), overpopulation (17 h, six rats per cage), humid saw dust (17 h, 200 mL water on the cage saw dust), immobilization (2 h, in a metal mesh), illumination (during dark phase), cage tilt (17 h, with 40°–45° obliquely), cold isolation (1 h, in 4°C temperature), and electrical shock (1 h with the intervals of 60 s, 1 mA, 1 Hz, 10 s duration). The CUS paradigm is listed in Table 1.
| Day | Morning | Noon | Afternoon |
|---|---|---|---|
| 1 | Forced swim (15 min) | Restraint stress (2 h) | Illumination + overpopulation (17 h) |
| 2 | Restraint stress (2 h) | Electrical shock (1 h) | Cage tilt (17 h) |
| 3 | Cold isolation (1 h) | Immobilization (2 h) | Humid saw dust (17 h) |
| 4 | Immobilization (2 h) | Cold isolation (1 h) | Humid saw dust (17 h) |
| 5 | Restraint stress (2 h) | No stress | Humid saw dust + overpopulation (17 h) |
| 6 | Cold isolation (1 h) | Restraint stress (2 h) | Overpopulation + cage tilt (17 h) |
| 7 | Forced swim (15 min) | Electrical shock (1 h) | No stress |
- Note: The stressors were repeated on a weekly basis during the fourth week of the experiment. CUS: chronic unpredictable stress paradigm.
2.3. Body Weight Measurement
The body weight of the rats (n = 8 rats/group) was measured weekly over the 4 weeks of the experiment using a precise digital scale with an accuracy of 1 g (Amput, China). The results are expressed as the percentage of body weight changes relative to the day before starting the stress exposure period (day 0).
2.4. Blood Sampling and Plasma Biochemical Assessments
After the last stress session and following an overnight fasting (16 h), animals were briefly exposed to isoflurane (Nicholas Primal, London, UK). Blood samples were collected using the retro-orbital puncture method and stored in heparinized plastic tubes (5000 IU/mL, Caspian Tamin, Iran) at a ratio of 10 μL of heparin per milliliter of blood. The collected blood samples were then centrifuged at 664 × g for 10 min, at 4°C, and the separated plasma was stored at −70°C until further assay (n = 6 rats/group) [30]. The plasma corticosterone concentrations were determined before (Day 0) and after (Day 29) the induction of stress using a rat corticosterone enzyme-linked immunosorbent assay (ELISA) kit (sensitivity: 0.9 nmol/L; ZellBio, Germany; Cat. No.: ZB-10496C-R9648). The results are expressed as the percentage of changes in the plasma corticosterone concentration on Day 29 relative to Day 0. The plasma concentration of leptin was also measured using the rat leptin ELISA kit (sensitivity: 0.09 ng/mL; ZellBio, Germany; Cat. No.: ZB-10561C-R9648).
2.5. Pancreas Isolation and Total Protein Assessment
Following blood sampling, while the rats were anesthetized, they were euthanized by decapitation, and their pancreases were quickly removed and transferred to liquid nitrogen for storage at −70°C. To prepare the pancreatic tissue, the frozen tissues were homogenized in a lysis buffer kept on ice. Following homogenization, the tissues underwent centrifugation at 12,000 rpm for 30 min at 4°C. The resulting supernatant was used to assess oxidative stress, ER stress, and apoptotic markers. Moreover, the total protein concentration of supernatant was determined using the Bradford method [31].
2.6. Assessment of Oxidative Stress Markers in Plasma and Pancreatic Tissue
Plasma and pancreatic tissue catalase activity as well as GSH level were assessed using the methods outlined by Goth [32] and Ellman [33], respectively (n = 6 rats/group). The assessment of the MDA level was carried out using a commercially available MDA colorimetric kit (sensitivity: 0.1 μmol/L; ZellBio, Germany; Cat. No.: ZB-MDA-96A) (n = 6 rats/group).
2.7. OGTT
On Day 29, following an overnight fasting period (16 h), blood samples were collected at 0 min, and then, an OGTT was conducted (n = 6 rats/group). For this, a glucose solution (45% in distilled water, 2 g/kg body weight) (Merck, Germany; Cat. No.: 104074) was administered via oral gavage, and blood samples were collected at 30 min and 120 min following glucose administration to measure plasma glucose and insulin levels. The plasma glucose level was assessed using a colorimetric enzymatic kit (sensitivity: 1 mg/dL; Pars Azmun, Iran). Furthermore, the plasma insulin concentration was measured using a rat insulin ELISA kit (sensitivity: 0.2 mIU/L; ZellBio, Germany; Cat. No.: ZB-10707C-R9648).
2.8. Insulin Resistance and Sensitivity Along With β-Cell Function Assessments
2.9. Islet Isolation and Glucose-Stimulated Insulin Release
On day 29, following a 16-h overnight fasting period, islets of Langerhans were isolated (n = 4 rats/group) using the collagenase method first described by Lacy and Kostianovsky [35], with a minor modification [34]. In summary, using isoflurane inhalation, the rats were decapitated, and their abdominal cavities were then exposed. Subsequently, a polyethylene catheter was inserted into the bile duct. Then, a cold solution of Hank’s medium, containing specific concentrations of various salts and collagenase [34], was infused into the duct. The distended pancreas was placed in a falcon tube and allowed to incubate for 17 min at a temperature of 37°C in a water bath. The digestion was stopped with cold Hank’s solution, followed by vigorous shaking and transfer to a glass container. Islets were collected after sedimentation and washing multiple times with cold Hank’s solution. For static secretory assessment, 10 islets were picked from each rat and placed into the Krebs Ringer solution, consisting of varying glucose concentrations (5.6 and 16.7 mM), and then incubated at 37°C in a water bath for 90 min. Subsequently, the supernatant was collected and frozen at −70°C for later insulin measurement using a rat insulin ELISA kit [34] (sensitivity: 0.2 mIU/L; ZellBio, Germany; Cat. No.: ZB-10707C-R9648).
2.10. Western Blot
The aforementioned prepared supernatant was used for assessing BIP, CHOP, cleaved CASPASE-3, and CALNEXINE protein levels (n = 3 rats/group). In brief, the proteins were loaded onto polyacrylamide gels with a 12% sodium dodecyl sulfate (SDS) mixture and then electrophoresed. The proteins were then transferred to a polyvinylidene fluoride (PVDF) membrane. The membranes were subjected to overnight incubation with the primary antibody, diluted at 1:1000. The following day, the membranes were incubated for 90 min at room temperature with a secondary antibody (anti-rabbit: ba1054-2), and visualization was carried out using an ECL advance kit (Amersham Bioscience, USA).
The quantification of the results was performed by scanning the films using densitometry, followed by data analysis using Image J software. The results were subsequently presented as a ratio of the target protein to the reference protein. The primary antibodies were used in this study are listed as follows: BIP #SC-13539, USA; CHOP #GTX112827, USA; CALNEXIN #SC-46669, USA; β-Actin: #CST-4970, USA; CASPASE-3 #CST-9662, USA; and GAPDH # GTX100118, USA.
2.11. Peritoneal Fat and Adrenal Gland Weight Measurement
At the end of the experimental procedure, after the animals were decapitated, the peritoneal fat and adrenal glands were carefully isolated from surrounding tissues and weighed immediately (n = 6 rats/group).
2.12. Statistical Analyses
The data were analyzed using the two-way analysis of variance (ANOVA) (considering stress and RJ as independent factors), three-way ANOVA (considering stress, RJ, and glucose concentration as independent factors). and three-factor mixed model ANOVA (considering stress and RJ as independent factors and time as the repeated factor) followed by the Tukey multiple comparison as a post hoc test. Prior to conducting the statistical tests, we assessed the underlying assumptions for the use of ANOVA. Specifically, we evaluated the normality of the data distributions using the Shapiro–Wilk test, which confirmed that all datasets exhibited normal distributions. Additionally, we examined the homogeneity of variances using Levene’s test, and the results indicated that this assumption was also met. Analyses were performed using the software GraphPad Prism (Version 8.3.0; GraphPad Software, San Diego, CA, USA) and IBS SPSS Statistics (Version 22). All data were reported as the mean ± standard error of the mean (SEM). p < 0.05 was considered statistically significant.
3. Results
3.1. Effect of RJ on Body Weight Changes and Peritoneal Fat Weight in Response to CUS
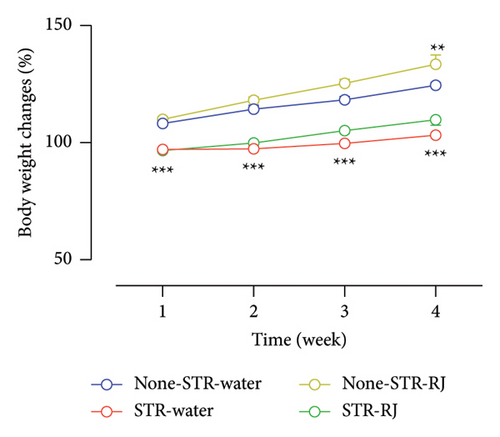
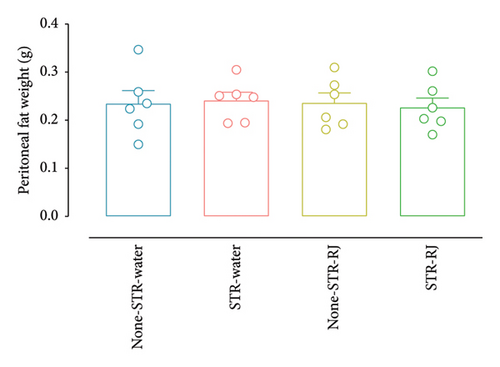
The percentage of body weight changes exhibited lower values in the STR-Water and STR-RJ groups compared to the None-STR-Water group during 4 weeks (p < 0.001). However, the None-STR-RJ group displayed a higher percentage of body weight changes than the None-STR-Water group at the fourth week (p < 0.01) (Figure 2(a)). However, no notable variations were observed in the peritoneal fat weight across the study groups (Figure 2(b)).
3.2. Effect of RJ on Plasma Corticosterone Concentration Changes and Adrenal Gland Weights in Response to CUS
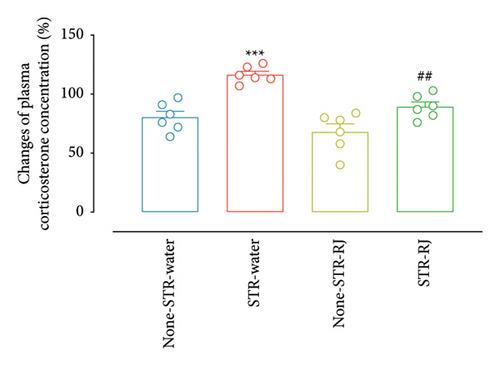
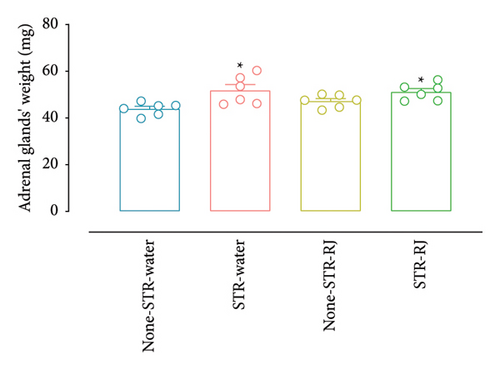
Based on the data presented in Figure 3(a), the percentage change in the plasma corticosterone concentration demonstrated a higher value in the STR-Water group relative to the None-STR-Water group (p < 0.001). However, in the STR-RJ group, this percentage change was lower compared to the STR-Water group (p < 0.01) and exhibited no noticeable disparities in relation to the None-STR-Water group. Moreover, the weight of adrenal glands was found to increase in both the STR-Water and STR-RJ groups compared to the None-STR-Water group (p < 0.05) (Figure 3(b)).
3.3. Effect of RJ on Leptin Plasma Level in Response to CUS
Figure 4 shows that the leptin level was higher in the STR-Water group in contrast to the None-STR-Water group (p < 0.05). However, in the STR-RJ group, it was lower versus the STR-Water group (p < 0.05) and displayed no significant difference concerning the None-STR-Water group.

3.4. Effect of RJ on Plasma Glucose and Insulin Levels During OGTT in Response to CUS
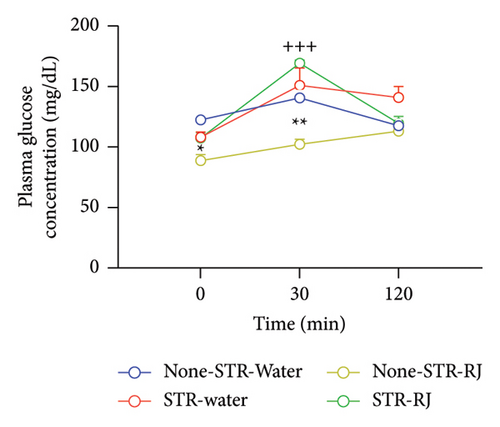
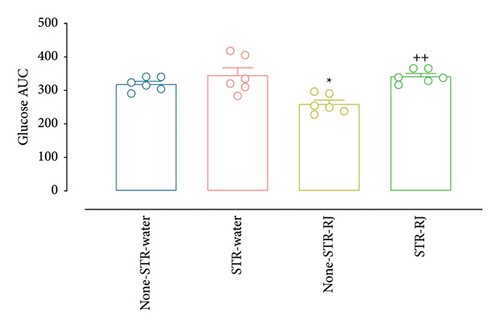
At time zero (p < 0.05), prior to the OGTT, and at 30 min postglucose administration (p < 0.01), the None-STR-RJ group exhibited notably lower serum glucose levels than the None-STR-Water group. Additionally, a significant elevation in plasma glucose levels was detected in the STR-RJ group in relation to the None-STR-RJ group (p < 0.001) at the 30-min point. However, 120 min after glucose administration, there were no meaningful differences in this parameter between the study groups (Figure 5(a)). The plasma glucose AUC was reduced in the None-STR-RJ group relative to the None-STR-Water group (p < 0.05). In contrast, the STR-RJ group exhibited a markedly greater plasma glucose AUC in comparison to the None-STR-RJ group (p < 0.01), yet it did not differ significantly from the None-STR-Water group (Figure 5(b)).
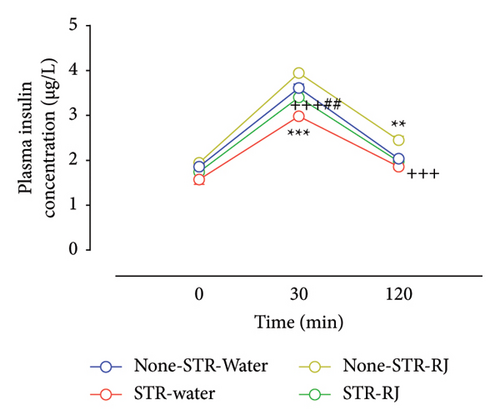
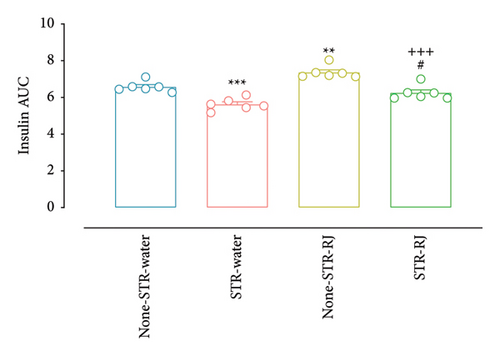
Regarding plasma insulin, at time zero, immediately prior to the OGTT, there were no notable variations in its levels among the study groups. However, 30 min following glucose administration, the plasma insulin level was lower in the STR-Water group versus None-STR-Water group (p < 0.001). Although the insulin level was higher in the STR-RJ group than in the STR-Water group (p < 0.01), its level was lower in this group compared to the None-STR-RJ group (p < 0.001) and did not exhibit any substantial changes when compared to the None-STR-Water group. At 120 min on OGTT, there was a rise in plasma insulin levels within the None-STR-RJ group compared to the None-STR-Water group (p < 0.01). However, the level of this parameter was lower in the STR-RJ group than in the None-STR-RJ group (p < 0.001) and did not differ significantly from the None-STR-Water group (Figure 5(c)). The AUC of plasma insulin level decreased in the STR-Water group (p < 0.001) and increased in the None-STR-RJ group (p < 0.01) compared with the None-STR-Water group. Meanwhile, this parameter was lower in the STR-RJ group compared to the None-STR-RJ group (p < 0.001) and higher than the STR-Water group (p < 0.05) and showed no significant difference compared to the None-STR-Water group (Figure 5(d)).
3.5. Effect of RJ on HOMA-IR, ISI, and HOMA-β in Response to CUS
As depicted in Table 2, HOMA-IR showed a decline in both the STR-Water and None-STR-RJ groups in contrast to the None-STR-Water group (p < 0.01); however, in the STR-RJ group, the index showed no significant difference compared to the mentioned group. ISI demonstrated an increase in the STR-Water (p < 0.001) and None-STR-RJ (p < 0.01) groups versus the None-STR-Water group. Conversely, ISI decreased in the STR-RJ group compared to the STR-Water group (p < 0.05). On a different note, HOMA-β demonstrated an increase in the None-STR-RJ group when compared to the None-STR-Water group (p < 0.001). Meanwhile, the STR-RJ group exhibited a decline when compared to the None-STR-RJ group (p < 0.01) and showed a statistically nonsignificant increase in comparison with the STR-Water and Non-STR-Water groups.
| None-STR-Water | STR-Water | None-STR-RJ | STR-RJ | |
|---|---|---|---|---|
| HOMA-IR | 1.25 ± 0.07 | 0.93 ± 0.19∗∗ | 0.95 ± 0.12∗∗ | 1.03 ± 0.15 |
| ISI(matsuda) | 1.24 ± 0.08 | 1.83 ± 0.25∗∗∗ | 1.67 ± 0.19∗∗ | 1.51 ± 0.19# |
| HOMA-β | 7.8 ± 0.68 | 7.51 ± 1.20 | 11.57 ± 1.75∗∗∗ | 8.42 ± 1.32++ |
- Note: Exposure to stress reduced HOMA-IR index, whereas the elevated ISI index without affecting HOMA-β. However, RJ administration in the STR-RJ group restored the alterations. The F values of the two-way ANOVA for HOMA-IR index are as follows: stress (F (1, 20) = 4.02, p = 0.0588), RJ (F (1, 20) = 3.17, p = 0.0903), and stress × RJ interaction (F (1, 20) = 11.16, p = 0.0033). The F values of the two-way ANOVA for ISI are as follows: stress (F (1, 20) = 8.40, p = 0.0089), RJ (F (1, 20) = 0.53, p = 0.4749), and stress × RJ interaction (F (1, 20) = 26.05, p < 0.0001). The F values of the two-way ANOVA for HOMA-β index are as follows: stress (F (1, 20) = 10.45, p = 0.0042), RJ (F (1, 20) = 19.46, p = 0.0003), and stress × RJ interaction (F (1, 20) = 7.27, p = 0.0139). Each value represents the mean ± SEM for six rats. HOMA-β: homeostasis of beta cell function; STR: stress.
- Abbreviations: CUS, chronic unpredictable stress; HOMA-β, homeostasis model assessment of β-cell function; HOMA1-IR, homeostasis model assessment of insulin resistance; ISI, insulin sensitivity index; RJ, royal jelly.
- ∗∗p < 0.01, ∗∗∗p < 0.001 versus None-STR-Water.
- #p < 0.05 versus STR-Water.
- ++p < 0.01 versus None-STR-RJ.
3.6. Effect of RJ on Pancreatic Isolated Islet GSIS in Response to CUS
The findings revealed a remarkable reduction in insulin secretion from isolated pancreatic islets in the STR-Water group compared to the None-STR-Water group when the islets encountered 5.6 mM of glucose (p < 0.05). On the other hand, at 16.7 mM of glucose, there was a notable rise in insulin secretion within both the non-STR-RJ and STR-RJ groups compared to the None-STR-Water group (p < 0.001). Furthermore, insulin secretion was notably higher in the STR-RJ group than in the STR-Water group (p < 0.001) (Figure 6).

3.7. Effect of RJ on Plasma and Pancreatic Oxidative Stress Biomarkers (MAD and GSH Levels and Catalase Activity) in Response to CUS
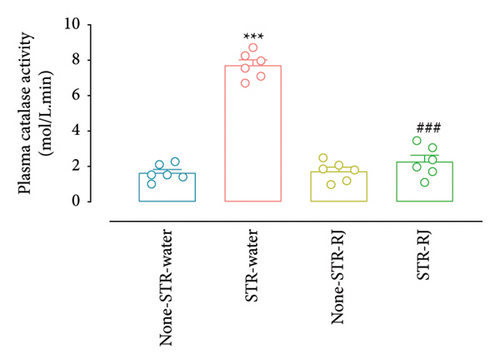
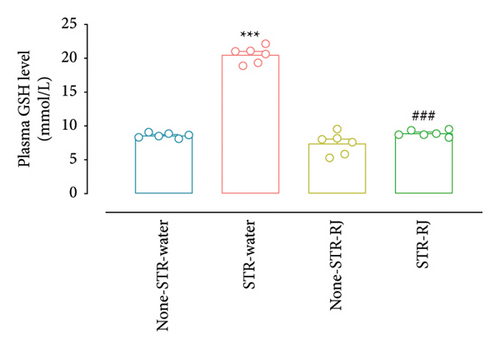
Plasma catalase activity and GSH level increased in the STR-Water group compared to the None-STR-Water group (p < 0.001), indicating heightened antioxidant response. However, RJ intake prevented the surges in the stressed animals leading to a significant difference from the STR-Water group (p < 0.001) (Figures 7(a) and 7(b)). There were no remarkable differences between the STR-RJ group and the None-STR-Water group concerning these biomarkers (Figures 7(a) and 7(b)).
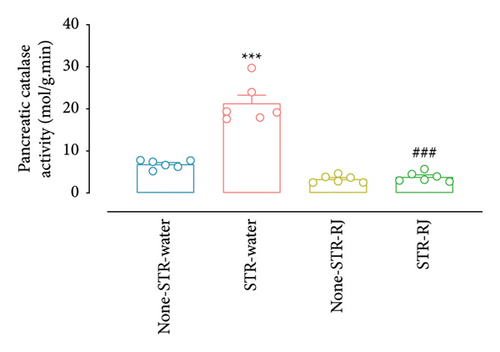
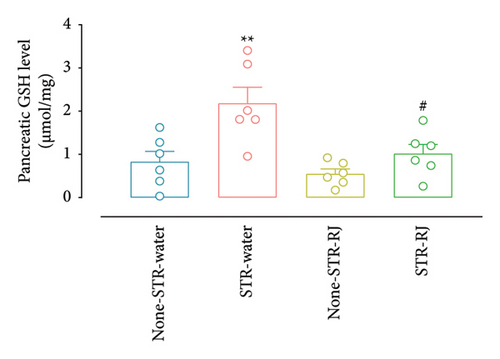
Furhermore, pancreatic catalase activity and GSH levels were notably elevated in the STR-Water animals relative to the None-STR-Water animals (p < 0.001 for catalase activity, p < 0.01 for the GSH level) (Figures 7(c) and 7(d)). In contrast, both catalase activity and GSH levels diminished in the STR-RJ group versus the STR-Water group (p < 0.001 for catalase activity, p < 0.05 for the GSH level) and showed no significant difference in comparison with the None-STR-Water group (Figures 7(c) and 7(d)).
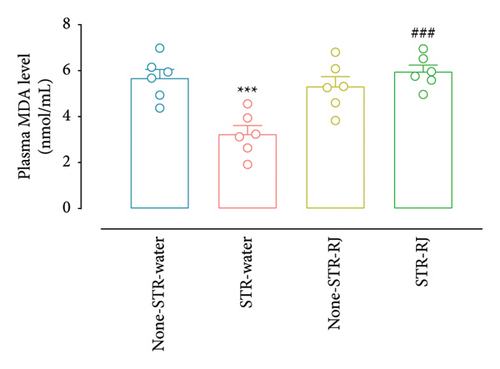
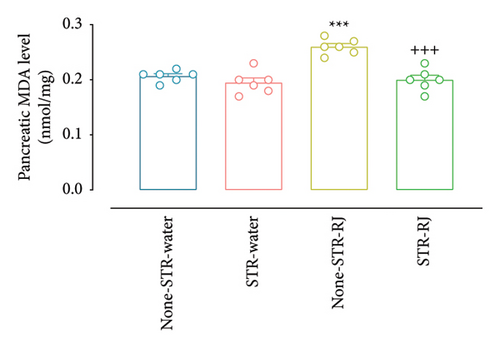
At the same time, the STR-Water group demonstrated reduced plasma MDA levels compared to the None-STR-Water group (p < 0.001), while the STR-RJ group exhibited an increase relative to the STR-Water group (p < 0.001) and showed no significant difference with the non-STR-Water group (Figure 7(e)). The pancreatic MDA concentration had a higher value in the None-STR-RJ group compared to the None-STR-Water group (p < 0.001). However, it was decreased in the STR-RJ group compared with the None-STR-RJ group (p < 0.001) and exhibited no significant difference with the None-STR-Water group (Figure 7(f)).
3.8. Effect of RJ on Pancreatic Protein Levels of ER Stress Biomarkers (BIP, CHOP, and CALNEXIN) in Response to CUS
Based on the western blot analysis, in the STR-Water group, the BIP protein level increased significantly compared to the None-STR-Water group (p < 0.001). Interestingly, the STR-RJ group showed elevated BIP protein levels compared to the None-STR-Water group but exhibited a lower expression than the STR-Water group (p < 0.001) (Figures 8(a) and 8(b)). Concerning the CHOP protein, a similar trend was noted. Its level elevated in the STR-Water group, relative to the None-STR-Water group (p < 0.001), while it reduced in the STR-RJ group when compared to the STR-Water group (p < 0.001) (Figures 8(c) and 8(d)). The CALNEXIN protein level remained unchanged between the study groups (Figures 8(e) and 8(f)).



3.9. Effect of RJ on Pancreatic Expression of Apoptosis Biomarker (CASPASE-3) in Response to CUS
The cleaved CASPASE-3 protein level exhibited an increase (statistically nonsignificant, p = 0.07) in the STR-Water group compared to the None-STR-Water group (Figures 9(a) and 9(b)). However, RJ administration, in the STR-RJ group, restored the cleaved CASPASE-3 protein amount to a level near that of the None-STR-Water group (Figures 9(a) and 9(b)).

4. Discussion
This study revealed that subjecting rats to CUS for 4 weeks induced significant physiological changes, including weight loss, increased adrenal gland weight, and elevated corticosterone and leptin plasma concentrations. Furthermore, an augmentation in antioxidant levels within both plasma and pancreatic tissue was observed, alongside an elevation in pancreatic BIP and CHOP protein levels, a reduction in HOMA-IR, an increase in ISI, and a rise in the pancreatic cleaved CASPASE-3 protein level within the STR-Water group.
Notably, the concurrent administration of RJ with CUS mitigated these alterations, normalizing plasma corticosterone and leptin levels, reducing pancreatic ER stress biomarkers to baseline levels observed in the None-STR-Water group, and ameliorating CUS-associated oxidative stress. Consequently, this intervention preserved glucose-stimulated insulin secretion functionality.
In line with prior studies [36, 37], the findings indicate a notable decrease in the body weight following CUS exposure, likely attributable to reduced food intake. This reduction is possibly mediated by the activation of the HPA axis and subsequent elevation of corticotropin-releasing factor (CRF) levels, an anorexigenic neuropeptide [38]. The results demonstrate significant increases in corticosterone levels and adrenal gland weight in the STR-Water group after 4 weeks of CUS, suggesting the hyperactivation of the HPA axis and increased adrenal cortex stimulation [39].
The sustained elevation of corticosterone underscores the inability of the HPA axis to adapt to chronic stress, affirming the efficacy of CUS as a model for inducing long-lasting stress effects [40]. Moreover, prolonged corticosterone exposure may lead to muscle proteolysis, reducing body muscle mass without affecting peritoneal fat weight [41], illustrating that body weight changes do not directly correlate with alterations in peritoneal fat weight. This discrepancy may arise from variations in the metabolic rate, water retention, and stress-induced metabolic and energy expenditure alterations, which could influence body weight independently of adipose tissue deposition [42]. Stress-induced neuropeptide-Y signaling activation may also prevent reductions in peritoneal fat [43]. Elevated corticosterone levels may also increase serum leptin levels, as observed in the study [44]. Leptin, known for its role in inducing satiety and reducing food intake [45], may contribute to the observed body weight loss in CUS-exposed groups.
Despite no significant changes in the body weight among stressed animals receiving RJ, the STR-RJ group exhibited a nonsignificant trend toward weight gain over 4 weeks compared to the STR-Water group. This trend could be attributed to RJ’s mitigating effects on enhanced corticosterone and leptin levels in STR-RJ animals. Supporting this, Carvalho et al. reported that a week of RJ supplementation (200 mg/kg) before and during chronic stress exposure (cold and restraint stress) prevented an increase in corticosterone levels in rats [27]. Additionally, RJ intake decreased corticosterone levels in mice subjected to 21 days of unpredictable chronic mild stress [46], potentially due to RJ’s capacity to lower cholesterol levels in corticosterone synthesis [47, 48].
The OGTT demonstrated a significant decrease in the area under the curve (AUC) of plasma insulin concentration in STR-Water animals compared to Non-STR-Water animals, with no significant difference in glucose AUC between these groups. This suggests that CUS may enhance insulin sensitivity, further supported by reduced HOMA-IR and increased ISI in the STR-Water group relative to None-STR-Water. Moreover, in vitro analyses revealed a reduced capacity of isolated pancreatic islets from the STR-Water group to secrete insulin in response to a basal glucose concentration of 5.6 mM. This aligns with findings suggesting oxidative stress, as observed in the study, can impair insulin synthesis and secretion by inhibiting the binding of the transcription factor pancreas and duodenum homeobox protein (PDX) to DNA, crucial for β-cell function [16, 49]. Additionally, ER stress disrupts the ER’s normal protein folding and post-translational modifications of insulin [19].
Remarkably, RJ administration in the CUS-exposed group (STR-RJ) elevated plasma insulin levels to those comparable to the None-STR-Water group, as per OGTT results. RJ also restored insulin secretion from isolated islet β cells under basal glucose conditions (5.6 mM) in CUS-subjected animals. Moreover, RJ treatment enhanced insulin secretion from isolated islets in response to 16.7 mM glucose in both stressed and control rats. The HOMA-β results suggest that RJ may improve β-cell function, leading to an increased ability of islets to secrete insulin, elucidating the observed augmentation in plasma insulin levels during the OGTT.
RJ’s impact on insulin secretion appears multifaceted, with an intriguing role played by MDA levels. Studies have indicated that MDA exerts a dual concentration-dependent effect on insulin secretion: Whereas low to average MDA concentrations do not influence insulin secretion, elevated MDA levels can increase the calcium content and the ATP/ADP ratio, thus enhancing glucose-stimulated insulin secretion in β cells [50, 51]. Pourmoradian et al.’s findings that RJ supplementation boosted plasma insulin levels despite a decrease in MDA levels [24] suggest that RJ may activate insulin secretion through alternative pathways. These could involve the enhancement of ATP/ADP ratio and cytosolic calcium in β cells, along with optimizing glucose-dependent insulin secretion mechanisms [52].
The study noted a significant increase in the catalase activity and GSH concentration in the plasma and pancreatic tissue of the STR-Water group compared to the None-STR-Water group. This enhancement in antioxidant levels likely contributed to reduced lipid peroxidation and, consequently, lower plasma MDA levels in the STR-Water group. The increase in antioxidants may result from the activation of the phosphatidylinositol 3-kinase (PI3K)/Protein Kinase B (Akt)/nuclear factor-κB (NFκB) pathway triggered by oxidative stress, thus stimulating the synthesis of catalase and GSH [53, 54]. Despite increased antioxidant levels, pancreatic tissue MDA levels remained unchanged in the STR-Water group. This observation does not necessarily rule out the occurrence of oxidative stress in pancreatic tissue. Elevated antioxidant levels can mitigate oxidative damage without necessarily leading to changes in MDA levels [55]. The STR-RJ group showed reduced antioxidant levels in both plasma and pancreatic tissues and increased plasma MDA levels without significant differences from the None-STR-Water group. RJ’s phenolic compounds, known for their antioxidant properties, likely act as scavengers of peroxide compounds, reducing the accumulation of ROS [21, 55, 56]. Thus, the observed decrease in antioxidant levels in the STR-RJ group may reflect RJ’s action in normalizing redox status by reducing the need for endogenous antioxidant production. The elevation in MDA levels in the RJ-treated groups may result from processes other than lipid peroxidation, suggesting RJ’s capability to increase MDA levels through the degradation of polyunsaturated fatty acids and breakdown of prostaglandins and thromboxanes [51, 55].
Furthermore, the findings revealed increased levels of BIP and CHOP proteins in the pancreas of STR-Water animals, indicating the presence of ER stress. The upregulation of BIP, an ER stress marker, alongside CHOP, confirms ER stress induction [57–59]. Previous studies have shown that CUS and corticosterone elevation can induce ER stress through specific signaling pathways, including Protein Kinase C (PKC) and c-Jun N-terminal kinase (JNK) [14, 60, 61]. Corticosterone’s role in disrupting ER homeostasis, possibly through increased lipid peroxidation and ROS levels, further underscores the interconnected nature of oxidative and ER stress in affecting cellular functions [62, 63].
The research is pioneering in evaluating the effects of RJ on BIP and CHOP levels in the pancreatic tissue of rats subjected to CUS. A notable reduction in BIP and CHOP protein levels was observed in the STR-RJ group compared to the STR-Water group. This is consistent with Irandoost et al.’s findings, which demonstrated the capacity of RJ to decrease BIP protein levels in white fat tissue of rats on a high-fat diet for 8 weeks [64]. Given RJ’s antioxidative properties, the observed reduction in ER stress markers in the STR-RJ group likely stems from RJ’s protective effects against oxidative stress within the pancreas.
Elevated levels of cleaved CASPASE-3 were found in the STR-Water group, mirroring Song et al.’s discovery that chronic restraint stress could induce CASPASE-3 elevation and apoptosis in the spleen of male Wistar rats [65]. Oxidative stress may further exacerbate apoptosis by activating the p53 protein, increasing proapoptotic factors, and reducing antiapoptotic proteins [63, 64]. Moreover, stress can trigger the release of proinflammatory cytokines like IL-1β and IL-8 through CHOP protein upregulation, potentially initiating apoptosis via inflammation [66, 67]. Thus, targeting inflammation might mitigate CASPASE-3 expression in various cell types, a hypothesis supported by numerous studies [68, 69].
The findings also indicate RJ’s capability to normalize cleaved CASPASE-3 levels in CUS-exposed rats, aligning with Karadeniz et al., who reported RJ’s potential to reduce apoptosis by enhancing the antiapoptotic protein BCL-X [70]. Azad et al.’s research supports that this, showing that RJ, in combination with nicotine, can reduce CASPASE-3 and p53 mRNA expression [71]. These observations suggest the beneficial effects of RJ on mitigating CUS-induced apoptosis.
5. Limitations and Future Directions
A notable limitation of our study is the complex composition of RJ, which encompasses a variety of bioactive components such as proteins, sugars, lipids, vitamins, and minerals. These constituents could play a role in the observed effects on insulin secretion and protection against oxidative and ER stress. Our research did not delve into the individual components of RJ; thus, future studies should focus on isolating and analyzing these components to identify, which are responsible for the beneficial outcomes observed. Such investigations would provide deeper insights into RJ’s mechanisms of action and its potential therapeutic applications. Also, as mentioned in the Discussion, CUS and elevated corticosterone levels have the potential to induce ER stress through specific signaling pathways, including the activation of PKC and JNK. Therefore, it is recommended that upcoming studies investigate the impact of RJ on the expression of these proteins. Furthermore, future studies could indeed benefit from exploring the alterations and impacts of the three ER stress arms (PERK, IRE1α, and ATF6) to provide a more comprehensive understanding of the mechanisms involved.
6. Conclusion
This investigation elucidates that CUS precipitates a series of deleterious effects, including heightened plasma corticosterone levels, oxidative status alterations, augmented ER stress, and increased apoptosis markers in pancreatic tissue. Collectively, these disturbances contribute to the impairment of glucose metabolism. Notably, the concurrent administration of RJ with CUS exposure mitigated these adverse effects. Moreover, RJ administration enhanced insulin secretion from pancreatic islets in response to glucose stimulation, even in isolation. Consequently, RJ’s employment in the context of CUS exposure emerges as a potent preventive strategy against oxidative stress, ER stress, and apoptosis, safeguarding against the deterioration of glucose-stimulated insulin secretion.
Therefore, RJ presents a viable therapeutic option for preventing abnormalities in glucose metabolism, underscoring its potential utility in managing conditions precipitated by chronic stress. Future studies focusing on isolating and examining RJ’s bioactive components could further elucidate its mechanisms of action and solidify its role in therapeutic interventions against stress-induced metabolic disorders.
Conflicts of Interest
The authors declare no conflicts of interest.
Author Contributions
Payam Shahsavar: investigation, writing original draft, writing – review and editing, formal analysis, and visualization. Fatemeh Binayi and Mina Salimi: investigation and visualization. Mina Sadat Izadi: visualization and writing – review and editing. Mehdi Hedayati and Rasoul Ghasemi: validation, resources, and data curation. Homeira Zardooz: conceptualization, supervision, resources, project administration, methodology, funding acquisition, data curation, and writing – review and editing.
Funding
The present article was financially supported by the “Research Department of the School of Medicine Shahid Beheshti University of Medical Sciences” (Grant No.: 27614).
Acknowledgments
The present article was financially supported by the “Research Department of the School of Medicine Shahid Beheshti University of Medical Sciences” (Grant No: 27614). The author(s) acknowledge the use of artificial intelligence (AI) software in some aspects of the manuscript’s preparation. ChatGPT was used to formulate the prompts for generating Figure 1, and Microsoft Bing Image Creator was employed to create the images based on these prompts. Additionally, ChatGPT was used for grammatical and structural checking, as well as language polishing. No AI tools were involved in the manuscript’s planning or writing.
Open Research
Data Availability Statement
All data generated or analyzed during this study are included in this article. Further inquiries can be directed to the corresponding author.


