Mulberry Leaf Extract and Deoxynojirimycin Modulates Glucose and Lipid Levels via the IRS1/PI3K/AKT Signaling Pathway in Cells
Abstract
Various diseases caused by disorders of glucose and lipid metabolism are increasing day by day. Although many drugs have certain therapeutic effects, they still produce some side effects. Therefore, this article chooses the natural medicinal plant mulberry leaves to reveal its mechanism of regulating glucose and lipid metabolism. By establishing an insulin resistance model and a 3T3-L1 adipocyte model, it was found that mulberry leaf extract (MLE) and deoxynojirimycin (DNJ) significantly increased glucose consumption and glycogen consumption, while reducing total cholesterol (TC), triglycerides (TG) and low-density lipoprotein cholesterol (LDL-C) levels. Network pharmacology, molecular docking, and protein level showed that MLE and DNJ could improve glucose and lipid metabolism disorders through IRS1/PI3K/AKT signaling pathway. These results suggest that MLE and DNJ may have broad application prospects in regulating glycolipid metabolism in functional foods and healthcare products.
1. Introduction
With the improvement of living standards, the imbalance in dietary structure and irregular schedules have led to a steady increase in the proportion of people experiencing subhealth conditions or suffering from chronic diseases. The number of individuals affected by chronic illnesses such as obesity, hypertension, hyperlipidemia, and diabetes caused by disturbances in glucose and lipid metabolism is constantly rising, posing a direct threat to human health. Obesity occurs when there is excessive or abnormal accumulation of fat in the body. In recent years, the incidence of obesity in China has been escalating, leading to various complications that significantly impact individuals’ physical health and quality of life [1]. According to statistical data, it is estimated that approximately 463 million individuals globally are afflicted with diabetes, with projections indicating a potential increase to 700 million by 2045 [2]. Within this vast patient population, one type of diabetes stands out particularly, namely type 2 diabetes mellitus (T2DM), comprising roughly 90% of all diabetic patients [3, 4]. T2DM, a chronic metabolic disorder, is marked by hyperglycemia, inadequate insulin production, and insulin resistance. The primary pathophysiological underpinning of T2DM is the diminished responsiveness of target tissues, such as adipose tissue, liver, and skeletal muscle, to insulin. This phenomenon is a crucial factor in the development and progression of the disease [5]. Prolonged hyperglycemic states can pose a risk for developing various irreversible complications. Therefore, enhancing insulin sensitivity represents an effective approach to preventing and treating T2DM. Consequently, the identification of substances that regulate glucose and lipid metabolism and the exploration of their underlying mechanisms hold significant scientific importance.
Mulberry leaf is the leaf of Morus abla, as one of the traditional Chinese medicines. It possesses the capability to dispel wind and dissipate heat, as well as cleanse the liver and enhance vision clarity. Extensive research has revealed that mulberry leaves exhibit a diverse array of therapeutic effects, including lipid-lowering, blood sugar-regulating, antioxidant, anti-inflammatory, and antineoplastic properties [6, 7]. Therefore, mulberry leaves are processed into various products for sale, such as mulberry leaf tea for clearing heat and detoxifying, lowering blood pressure, and reducing blood lipids, as well as noodles and buns made with mulberry leaf powder. Among the various health-promoting properties, the medicinal and healthcare benefits of mulberry leaves in lowering blood sugar and lipid levels have garnered significant attention. However, the mechanism of mulberry leaves regulating glucose and lipid metabolism has not been fully elucidated. Mulberry leaves are nutritious and contain a large number of active substances, such as polysaccharides, flavonoids, and alkaloids, which can regulate glucose and lipid metabolism by promoting insulin secretion, inhibiting lipid oxidation, and regulating signaling pathways, so as to achieve the effects of lowering blood sugar and blood lipids [8, 9]. Among them, DNJ in the alkaloid can be used as a α-glucosidase inhibitor to achieve hypoglycemic function. It can inhibit the decomposition of starch and sugar by sucrase, α-glucosidase, and α-amylase in the human body, thereby blocking the body’s absorption of sugar and starch, inhibiting the rise of blood sugar, and achieving the effect of treating diabetes [10, 11]. A study has demonstrated that healthy volunteers who ingested a DNJ-enriched powder prior to consuming sucrose displayed significant reduction in their postmeal blood glucose levels and insulin secretion. This observation was substantiated by comparing their blood glucose and insulin measurements before and after the administration [12]. Therefore, the high hypoglycemic activity of 1-DNJ determines that its content is one of the indicators of the effective activity of MLE. In addition, mulberry leaves can activate brown adipose tissue in T2DM rats by regulating the AMPK signaling pathway, induce white fat browning in the groin, enhance insulin sensitivity, and improve T2DM [13]. MLE has shown to ameliorate the deregulated glucose and lipid metabolism observed in an insulin-resistant (IR) 3T3-L1 adipocyte model. This observed effect was ascribed to its capacity to trigger the IRS1/PI3K/AKT signaling pathway, subsequently inducing the suppression of FAS expression and enhancement of GLUT4 membrane translocation [14].
The objective of this research is to elucidate the underlying mechanism of mulberry leaf, a natural medicinal herb, in regulating glucose and lipid metabolism. By employing appropriate extraction techniques, the active components of mulberry leaf are concentrated into a product known as MLE, which serves as the primary research subject. The study explores the effects of MLE and DNJ on obesity, hyperlipidemia, hyperglycemia, and diabetes. Additionally, network pharmacology serves as a theoretical framework to elucidate the potential molecular targets of MLE in modulating glucose and lipid metabolic processes. This provides a certain reference for the potential application of MLE and DNJ in the development of functional foods and health products for regulating disorders in glucose and lipid metabolism.
2. Materials and Methods
2.1. Extraction and Quality Control of MLE
The mulberry leaves were obtained from Kunming, Yunnan, China, and their authenticity was confirmed by Professor Haiyang Liu from the Kunming Institute of Botany. A voucher specimen of the mulberry leaves, labeled as No. 20220628, has been securely archived at the Yunnan Characteristic Plant Extraction Laboratory in Kunming, Yunnan, China. An appropriate amount of mulberry leaves was taken and mixed them with double-distilled water (material-to-liquid ratio of 1:40). Heat and reflux to extract for 1 h, collect the filtrate, and pass it through a 5-nm ceramic membrane. The clear solution was collected and passed it through a reverse osmosis membrane. After concentrating the turbid solution, a vacuum freeze dryer was used to freeze-dry it, and MLE is obtained. The solid powder was placed in a desiccator for storage and future use.
The Agilent high-performance liquid chromatography system was employed to accurately detect the presence of DNJ in the MLE. The derivatization process is based on the method of Jiang YG et al, with slight modifications [15]. First, 100 μL of the standard DNJ or MLE was taken and added it to a 1.5-mL centrifuge tube for derivatization. Then, 175 μL of 0.4 mol/L potassium borate buffer (pH 8.5) and 250 μL of 5 mmol/L FMOC-Cl acetonitrile solution, the derivatization reagent, successively. The mixture was allowed to react for 25 min at 25°C. After that, 100 μL of 0.1 mol/L glycine solution was added to neutralize the excess FMOC-Cl, and the reaction was allowed to continue for 20 min. Finally, 75 μL of 1% acetic acid aqueous solution and 300 μL of deionized water were added. Once the reaction is complete, the mixture was filtered through a 0.45-μm organic phase filter membrane. The sample solution was stored away from light. For the liquid chromatography analysis, the setup comprised a 120SB-C18 column (3.0 × 100 mm, 2.7-micron) as the chromatographic column. The mobile phase was a blend of acetonitrile and 0.1% acetic acid in water. During the experiment, the column temperature was maintained at a constant 30°C level, and the fluid flow rate was precisely tuned to 1.0 mL/min for accurate and consistent results. The injection volume for each sample was set at 10 μL. Using the peak area of the chromatogram as the vertical coordinate and the corresponding sample concentration as the horizontal coordinate, a linear regression is performed to obtain the standard curve equation. This standard curve equation is then used to calculate the content of DNJ in MLE.
2.2. IR-HepG2 Insulin Resistance Model
2.2.1. Cell Culture and Establishment of IR-HepG2 Cells Model
The cryopreserved HepG2 cells were resuscitated and subsequently transferred to a cell culture flask. The revived HepG2 cells are cultured in complete medium, which is the Dulbecco’s modified Eagle’s medium (DMEM) enriched with 10% fetal bovine serum (FBS) to mimic the in vivo environment. They were placed in a 37°C, 5% CO2 incubator for culturing. After the cells reached contact inhibition, they were passaged once every 3 days at a ratio of 1:3 using complete medium. After the cells had adapted for 2 weeks following resuscitation, they were used for experiments during the logarithmic growth phase (when the fusion rate reached 90%).
In the present study, HepG2 cells were initially dispersed into 96-well plates at a concentration of 5 × 10⁴ cells/mL, ensuring 100 μL of cell suspension dispensed into each well. Following this, the cells were segregated into two distinct groups: a control group and a model group. Once the cells had adhered to and occupied roughly 80% of the plate’s area, the original growth medium was exchanged with a fresh medium enriched with insulin at a concentration of 10−11 mol/L [16]. Thereafter, the plates were incubated in a temperature-controlled environment at 37°C, with 5% CO2, for a period of 48 h, ultimately leading to the establishment of the IR-HepG2 cell model.
2.2.2. Glucose Consumption Determination
HepG2 cells were cultivated from the logarithmic growth phase in a 96-well plate at a density of 5 × 10³ cells per well. The experimental setup was structured into five groups: a blank group (cell-free), a normal group (untreated), a model group, a positive control group treated with rosiglitazone (Rhawn, China), MLE, and DNJ group. The model group, MLE, DNJ group and the positive control were treated according to the model group. The blank group and normal group were normally cultured. After the completion of modeling, different concentrations of extracts (high and low doses) were added to the administration group, and rosiglitazone was 3.25 μg/mL. In each group, three replicate wells were established. After a 24-h incubation period, the glucose concentration in the culture medium’s supernatant was quantified utilizing a specialized glucose assay kit. Subsequently, the glucose consumption was then determined by subtracting the glucose concentration in the blank group from that of the treated group, allowing for a precise assessment of glucose utilization.
2.2.3. Cell Glycogen Content Determination
The glycogen content in the cells was determined by glycogen determination kit (NanJing JianCheng Bioengineering Institute) after 24 h of treatment. The detection method and calculation method are carried out according to the instructions.
2.3. 3T3-L1 Preadipocyte Differentiation Assay
2.3.1. Cell Culture and Establishment of 3T3-L1 Adipocyte Model
The 3T3-L1 pre-adipocytes were propagated in a nutrient-rich complete medium for optimal growth conditions., cultured at 5% CO2, 37°C to form a monolayer of adherent cells, changed the culture medium once at 2 days, when the cells were confluent to 80%–90%, digested into single cells with trypsin-EDTA digestion solution, seeded into new culture flasks, resuspended with complete medium.
3T3-L1 pre-adipocytes were dispersed into 6-well plates with 2.5 × 10⁴ cells/mL using complete medium. Differentiation begins 2 days after the cells grow to complete confluence, and the culture medium is replaced with complete culture of 0.5 mmol/L 3-isobutyl-1-methylxanthine, 10 μg/mL insulin, and 1 μmol/L dexamethasone. After 48 h, 3-isobutyl-1-methylxanthine and dexamethasone were removed, so that the complete culture contained only 10 μg/mL of insulin. After 48 h, the insulin was removed, the cells were cultured with complete medium, and the fluids were changed every 48 h until 95% of the cells were mature adipocytes. The induction differentiation time is generally 7∼8 days [17]. Drugs are added to the culture starting from Day 0 and continued until the end of differentiation. Lovastatin (GLPBIO, China) is an HMG-CoA inhibitor that inhibits the formation of lipid droplets in 3T3-L1 adipocytes, and a concentration of 10 mM lovastatin was used as a positive control.
2.3.2. Oil Red O Staining
After the 3T3-L1 cells are induced and differentiated, the cells are washed with PBS, and 4% polymerized formaldehyde fixing cells are used. After that, the Oil Red O dyed solution is added to dye the cells. Finally, the cells are cleaned with PBS to collect images under the microscope. Subsequently, the Oil Red O was extracted using isopropanol, and the absorbance values were measured at 490 nm [18].
2.3.3. Determination of Intracellular Lipid-Related Indicators
The contents of TC, TG, and LDL-C in cells were quantified following the provided protocols from the NanJing JianCheng Bioengineering Institute in China.
2.4. The MTT Detects Cell Viability
The cell suspension was added to the 96-well plate at an appropriate density and cultured overnight, and different concentrations of MLE and DNJ were added to each other. After 24 h of treatment, we employed the MTT method to evaluate the potential impact of MLE on cell viability [14].
2.5. α-Glucosidase Inhibition Assay
2.6. α-Amylase Inhibition Assay
2.7. Pancreatic Lipase Activity Inhibition Assay
The formula encompasses the following absorbance values: A1 represents the absorbance of the blank group (utilizing distilled water in lieu of the sample), A2 signifies the blank background group (distilled water without the sample, but with PBS instead of pancreatic lipase), A3 corresponds to the sample group, and finally, A4 denotes the sample background group (where PBS substitutes for pancreatic lipase).
2.8. Network Pharmacology Prediction
2.8.1. Screening of Pharmacodynamic Components and Targets of MLE
Utilizing the TCMSP database (https://ibts.hkbu.edu.hk/LSP/tcmsp.php), we screened mulberry leaves for potential pharmacodynamic components that exhibited an oral bioavailability (OB) exceeding 30% and drug-like properties (DL) surpassing 0.18. Subsequently, we identified the primary component targets among the chemically active components of mulberry leaves and annotated them in the UniProt database (https://www.uniprot.org/).
2.8.2. Target Prediction for Hyperlipidemia and Hyperglycemia
To identify the common targets between diseases and drugs, the Veeny 2.1.0 platform (https://bioinfogp.cnb.csic.es/tools/venny/index.html) was utilized. Specifically, the target genes associated with the active components of mulberry leaves, as well as those linked to “hyperlipidemia” and “hyperglycemia,” were uploaded. This process facilitated the generation of a Veeny diagram, which revealed the shared targets between the diseases and the potential therapeutic agents.
2.8.3. Construction of Protein–Protein Interaction (PPI) Network and Identification of Key Targets
To construct the PPI network of overlapping genes, we leveraged the STRING database (https://cn.string-db.org/cgi/input.pl). Subsequently, with the aid of Cytoscape 3.9.0 and the Hubba plug-in, we filtered out the core targets within the PPI network based on their respective degree values.
2.8.4. Functional Enrichment Analysis
Utilizing the STRING database, we conducted an in-depth analysis of the GO functional enrichment and KEGG pathway enrichment pertaining to mulberry leaf proteins, as well as those proteins associated with hyperlipidemia and hyperglycemia. Using p < 0.01 as the criterion, the key pathway information of significant GO enrichment projects and target participation was screened for visualization.
2.8.5. Molecular Docking
To download the structural formula of the active ingredient DNJ from mulberry leaves in TCMSP, enter “INS, PPAPG, PI3K, GLUT4, IL-6” separately on the UniProt website. Search for the structures with the lowest resolution among the various structures available, and then download them from the RCSB PDB website to obtain the PDB structural formulas for these 5 receptors. To ensure accurate molecular docking, we utilized Moe software for preprocessing the essential target proteins, including the removal of solvent molecules. Subsequently, we conducted the docking process and documented the resulting binding energies in a well-organized Excel worksheet.
2.9. Reverse Transcription–Quantitative PCR Analysis
Utilizing the RNA prep Pure cultured cell/bacterial RNA extraction kit from TIANGEN Biotech (Beijing), the total RNA from the sample was successfully isolated. Following this, the isolated RNA was converted into cDNA through the utilization of the Prime Script RT Master Mix (perfect real time) reagent from Takara Bio, Inc. The conditions for reverse transcription were standardized, comprising 15 min at 37°C and a subsequent 5s denaturation at 85°C. For quantitative PCR analysis, the FastStart Universal SYBR Green Master (ROX) reagent from Roche Life Science was employed, coupled with the Quant Studio 3 Real-Time PCR Instrument from Applied Biosystems (Thermo Fisher Scientific, Inc.). Selecting appropriate conditions for the amplification of genes, GAPDH served as the internal control during this process. The resulting data were analyzed to determine the relative gene expression levels, utilizing the established 2−ΔΔCt method. The specific primer sequences employed in this study are detailed in Table 1.
| Gene name | Forward | Reverse |
|---|---|---|
| PI3K | CACCCAAGCCCACTACTGTA | GAGTGTAATCGCCGTGCATT |
| AKT | GTAGCCATTGTGAAGGAG | TCTTGAGGAGGAAGTAGC |
| IRS-1 | GGCACATCTCCTACCATT | CATCATCTCTGTATATTCCTCAAT |
| PPARG | GCATCAGGCTTCCACTAT | CTTCAATCGGATGGTTCTTC |
| IL-6 | ACCTGTCTATACCACTTC | GCATCATCGTTGTTCATA |
| GLUT4 | GCCATGAGCTACGTCTCCATT | GGCCACGATGAACCAAGGAA |
| GADPH | CCATCTTCCAGGAGCGAGAC | GGTCATGAGCCCTTCCACAA |
| H-PI3K | AACGAGAACGTGTGCCATTTG | AGAGATTGGCATGCTGTCGAA |
| H-AKT | AGCACTAAGGCCGTGTC | CCGTGGAGAGATCATCTG |
| H-IRS1 | GCGGTGAGGAGGAGCTAAGC | GCCACTGAGGACTGGGACGG |
| H-GLUT4 | TATGTTGCGGAGGCTATG | TTAAGAAGGTGAAGATGAAGAAG |
2.10. Immunofluorescence Staining
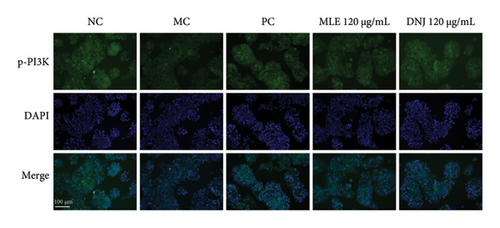
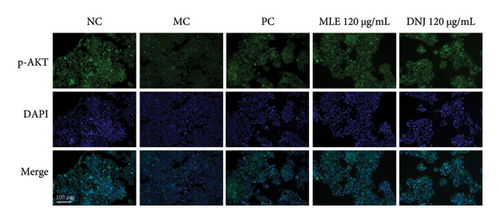
According to the methods outlined in Sections 2.2.1 and 2.3.1, IR-HepG2 and 3T3-L1 adipocytes were grown on glass coverslips and subsequently treated with various reagents in different groups. After fixing the cells with 4% paraformaldehyde, they were washed three times with PBS and then permeabilized using 0.1% Triton X-100. Following another three washes with PBS, the cells were blocked with blocking solution for 1 h. They were then incubated with antibodies against p-IRS1, p-PI3K, and p-AKT. After washing with PBS, the cells were incubated with fluorescein-conjugated secondary antibodies. The cells were stained with DAPI for 5 min, washed with PBS, and imaged using a Leica microscope (Germany). p-IRS1, p-PI3K were provided by Affinity Biosciences LTD (Jiangsu, China), and PI3K, IRS1, AKT, p-AKT were provided by proteintech Group (Wuhan, China). iFluor 488 conjugated Goat anti-rabbit IgG polyclonal Antibody was supplied by Huabio (Hangzhou, China).
2.11. Statistical Analysis
The data were expressed as the average values, along with their corresponding standard error of mean (SEM), derived from triplicate measurements across three independent experiments. GraphPad Prism 8 software was used to create the artwork. In evaluating the differences between various groups, we employed the one-way analysis of variance. A p value below 0.05 indicates the presence of significant differences between the groups, whereas a p value below 0.01 signifies extremely significant differences.
3. Results
3.1. Determination of DNJ in MLE Using HPLC
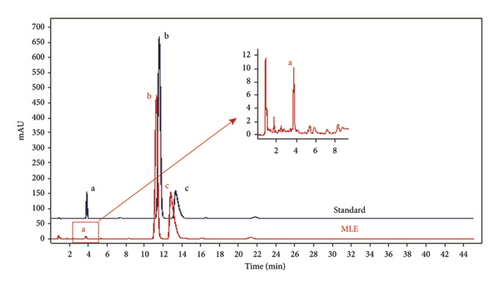
In this study, the content of alkaloid DNJ was enriched through a specific process, and its concentration was detected using HPLC (Figure 1). Linear regression analysis was performed using the mass concentration of the standard DNJ (X) against the peak area (Y), resulting in the regression equation Y = 6881.7688x + 32.4368, with an R2 value of 0.9990 indicating a high degree of fit. By substituting the peak area value of 134.625 for DNJ in MLE into this regression equation, the calculated content of DNJ in MLE was determined to be 1.48%. Before the mulberry leaves undergo membrane filtration, the DNJ content was 0.7%.
3.2. MLE and DNJ Improve the Insulin Resistance of IR-HepG2 Cells
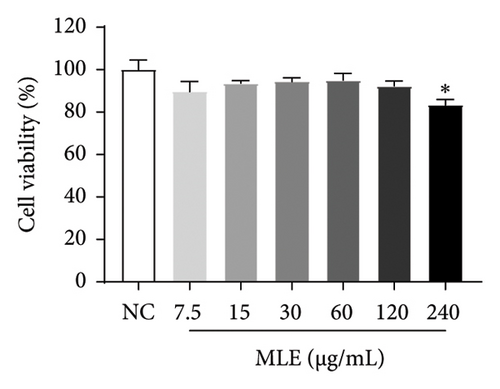
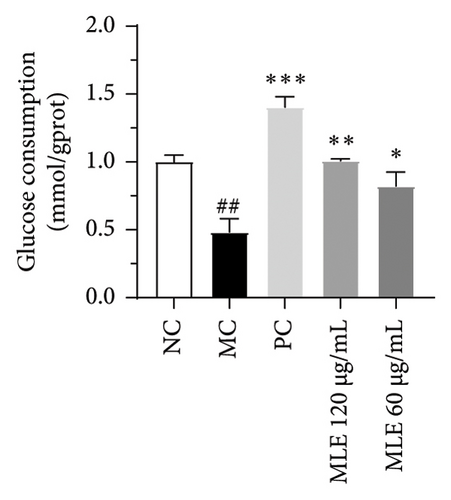
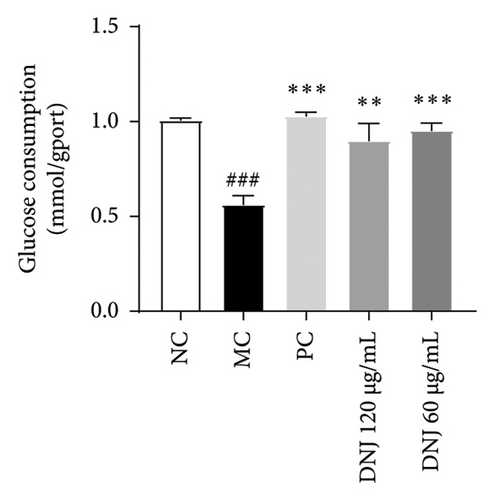
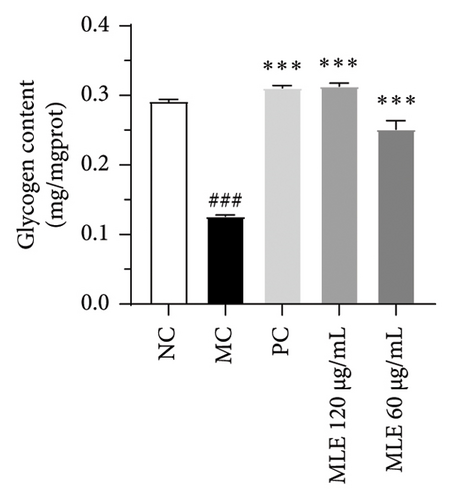
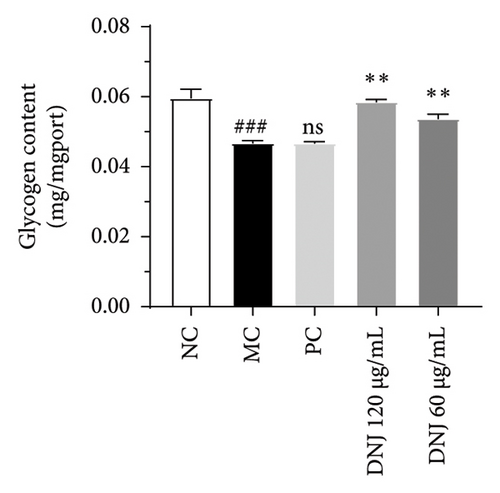
Diabetes primarily stems from impairments in the production or effectiveness of insulin, frequently occurring alongside elevated lipid levels and heightened blood sugar concentrations, subsequently triggering a cascade of secondary health issues. Glucose consumption and glycogen content can indirectly indicate improvement in insulin resistance. Utilizing the MTT assay, we evaluated the impact of varying concentrations of MLE and DNJ on the viability of HepG2 cells. The findings indicated that a concentration of 120 μg/mL of MLE and DNJ exerted no cytotoxic effects on the cells (Figures 2(a) and 2(b)). To evaluate the effect of MLE and DNJ on insulin sensitivity, the HepG2 cell model exhibiting IR was successfully established. The findings indicated a significant decrease in sugar utilization and stored glucose content within the experimental cell population when contrasted with the negative control group (NC), hinting at the onset of insulin resistance within these cellular models. In comparison with the model control group (MC), the MLE and DNJ at concentrations of 120 μg/mL and 60 μg/mL exhibited an ability to elevate glucose consumption and enhance glycogen content in the cells (Figures 2(c), 2(d), 2(e), 2(f)).
3.3. MLE and DNJ Attenuate Lipid Accumulation in the Model of 3T3-L1 Adipocyte
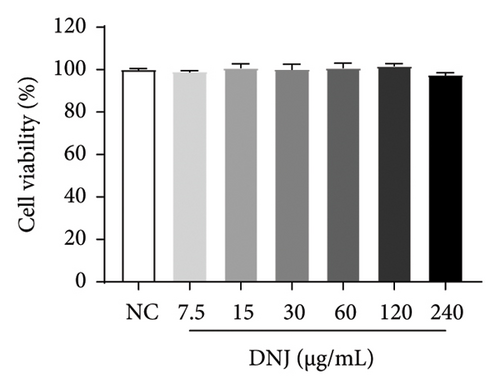
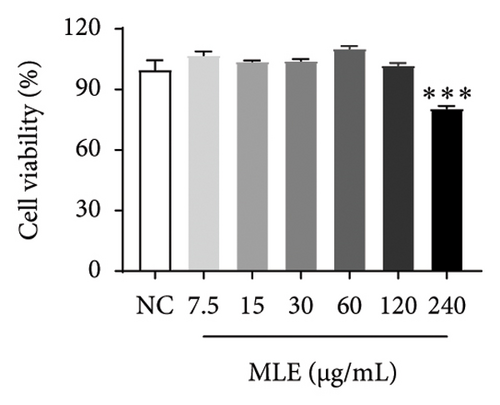
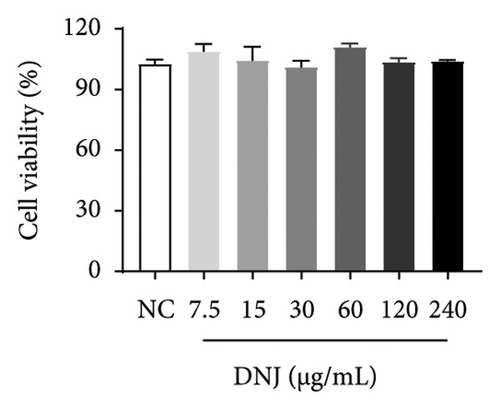
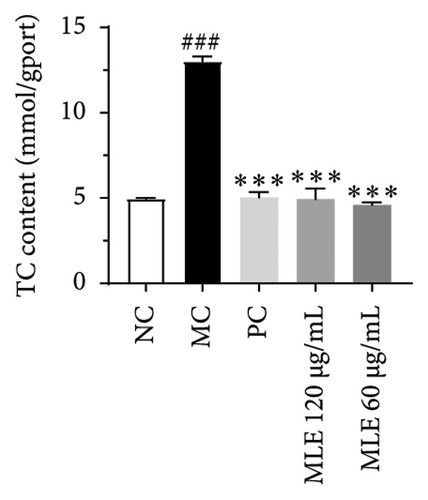
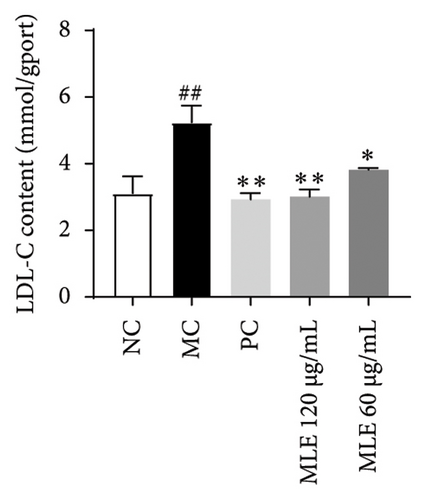
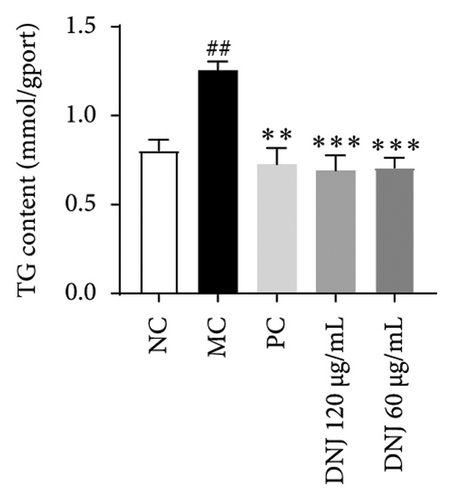
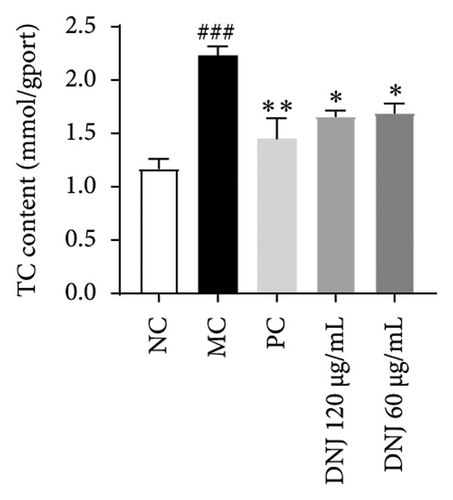
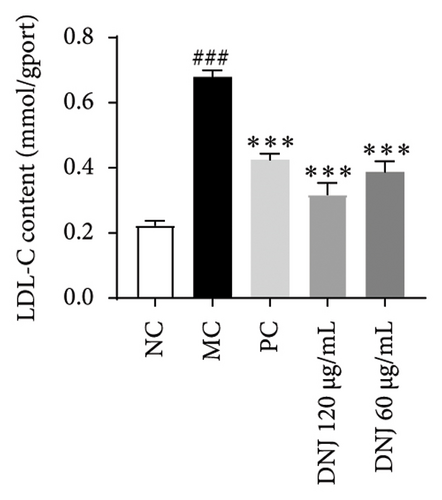
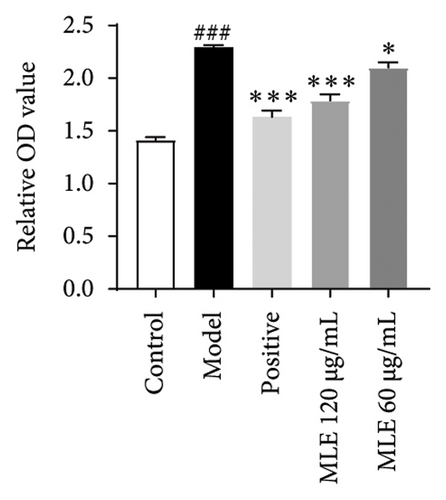
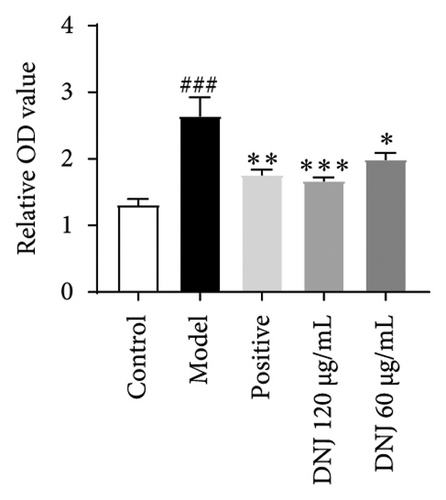
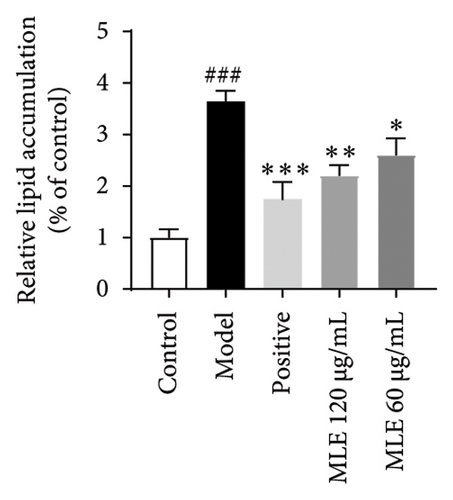
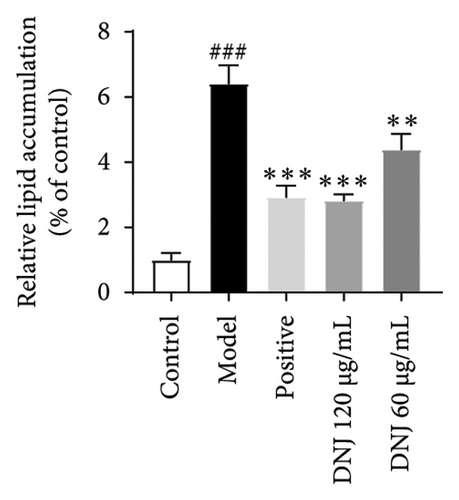
In order to elucidate the role of MLE and DNJ in lipid metabolism, a 3T3-L1 adipocyte model was constructed to evaluate its lipid-lowering effect by measuring the contents of TC, TG, and LDL-C. The survival rate of the blank control group was 100%, and the results showed that MLE and DNJ were not toxic to 3T3-L1 preadipocytes at 120 μg/mL (Figures 3(a) and 3(b)). In comparison with the NC group, the MC group exhibited a significant increase in the concentrations of TG, TC, and LDL-C, with statistical significance. Conversely, when administered with lovastatin, the MC group showed a remarkable reduction in the levels of these lipids. Furthermore, upon treatment with MLE and DNJ, the contents of TC, TG, and LDL-C were decreased significantly (Figures 3(c), 3(d), 3(e), 3(f), 3(g), 3(h)). Lipid accumulation was assessed postinduction using Oil Red O staining. The findings indicated a marked elevation in lipid levels within the MC group when contrasted with the NC group, exhibiting statistical significance. Notably, the PC group exhibited a significant reduction in cellular lipids. Additionally, the MLE and DNJ demonstrated inhibitory effects on lipid accumulation at concentrations of 120 μg/mL and 60 μg/mL (Figures 3(i), 3(j), 3(k), 3(l), 3(m), 3(n)).



3.4. MLE Inhibits α-Glucosidase, α-Amylase, and Pancreatic Lipase Activity
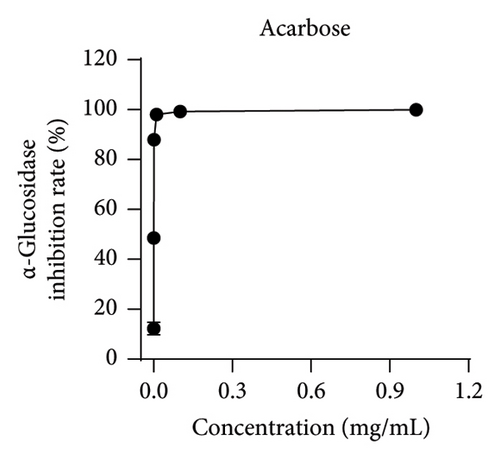
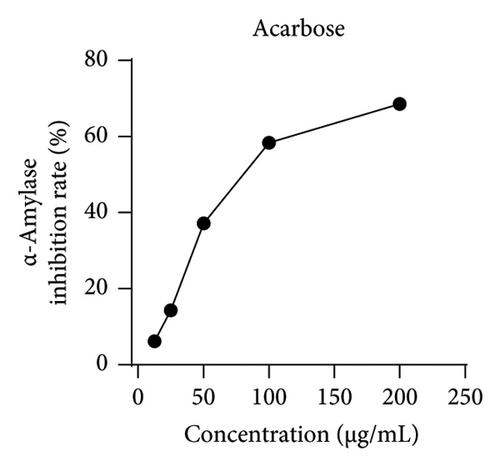
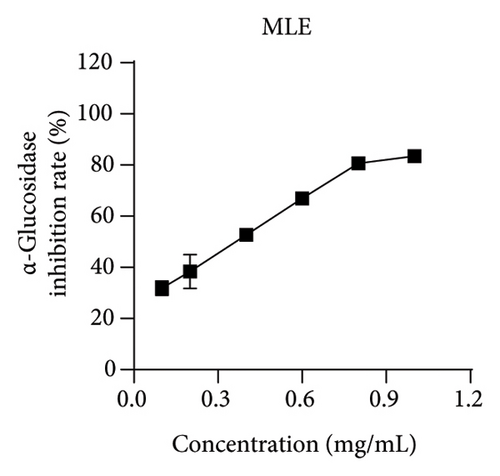
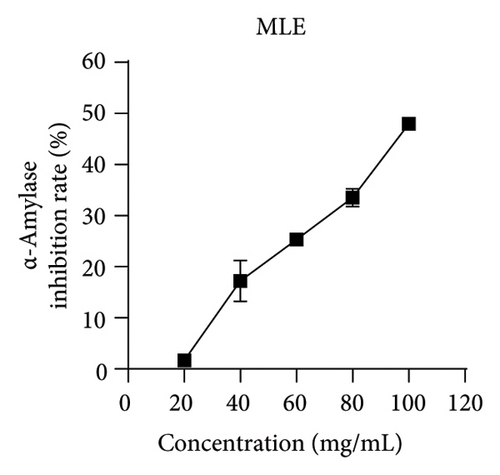
Studies have shown that inhibiting the activity of α-glucosidase and α-amylase can delay the absorption of carbohydrates in the intestine, thereby reducing the content of postprandial hyperglycemia in the human body, thereby reducing blood sugar [19, 22]. Within the scope of this research, acarbose was employed as a reference to assess the ability of MLE to suppress the actions of α-glucosidase and α-amylase. The results revealed an incremental augmentation in the inhibitory percentages of these enzymes in response to elevated concentrations of MLE. Specifically, the semi-inhibitory concentrations (IC50) were determined to be 0.38 mg/mL for α-glucosidase and 106.56 mg/mL for α-amylase (Figure 4).
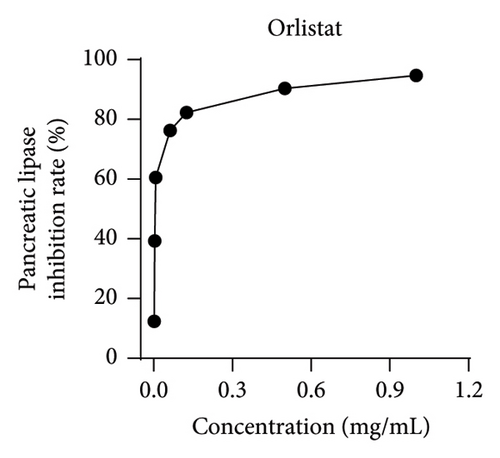
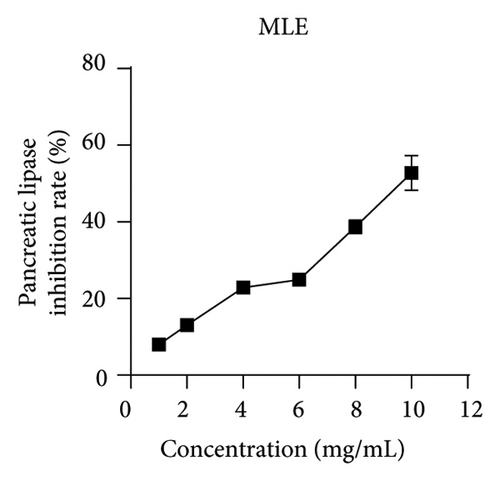
Pancreatic lipase, a crucial enzyme for digesting dietary fats, can be targeted to hinder its activity, resulting in a decreased digestion and absorption of triglycerides, ultimately promoting weight loss [23]. In the current investigation, orlistat served as a benchmark to gauge the suppressive impact of MLE on pancreatic lipase activity. As the concentration levels of MLE were elevated, its ability to hinder pancreatic lipase augmented progressively, demonstrating a clear correlation between dosage and response. Its IC50 is 10.16 mg/mL (Figure 4).
3.5. PPI Network Analysis
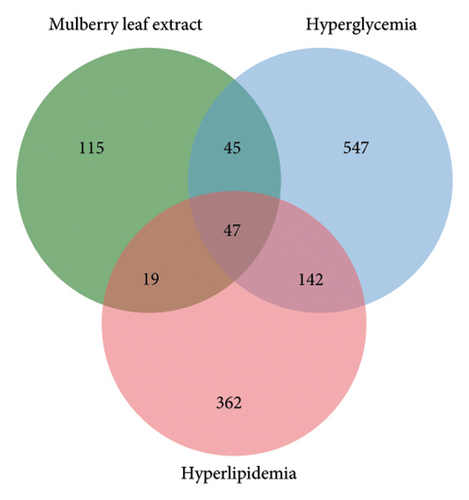
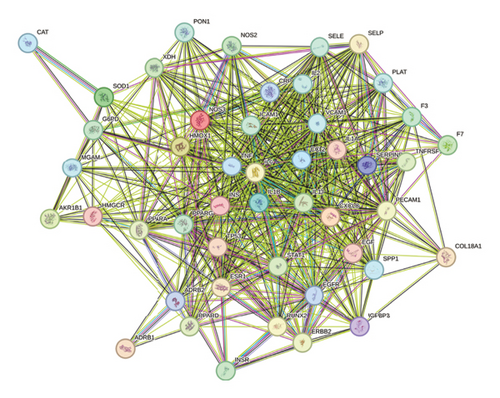
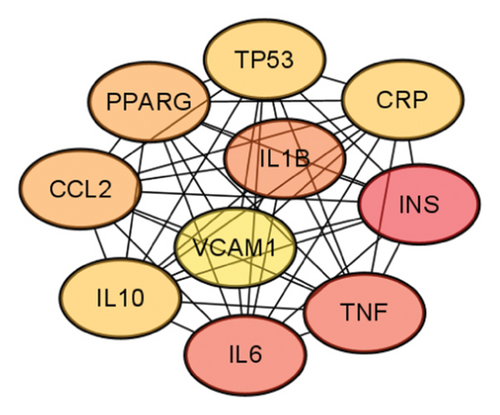
Through the GeneCards, TTD, and DrugBank databases, the search was carried out with the keywords “hyperlipidemia” and “hyperglycemia” to deduplicate the disease targets. Finally, Veeny 2.1.0 software was used to intersect the targets of mulberry leaves and diseases, and a total of 47 common targets were obtained (Figure 5(a)). The 47 candidate genes, pinpointed via the Venn diagram overlaps, were subjected to analysis utilizing the STRING database, culminating in the creation of a PPI network schematic (Figure 5(b)). Subsequently, this PPI network was imported into Cytoscape 3.9.0 software, where 10 crucial target genes were selected based on their degree values. Afterward, the PPI network was imported into the Cytoscape 3.9.0 software, wherein we identified 10 pivotal target genes, selected based on their respective degree values. These genes include IL6, IL10, TNF, VCAM1, PPARG, INS, TP53, CCL2, IL1B, and CRP (Figure 5(c)).
3.6. GO and KEGG Pathway Enrichment Analysis
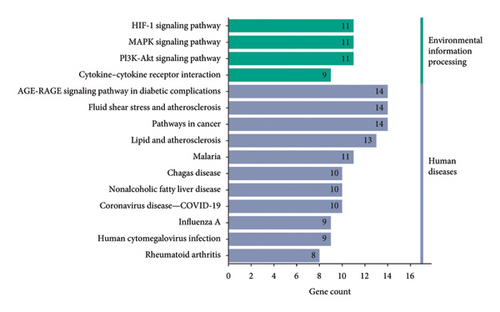
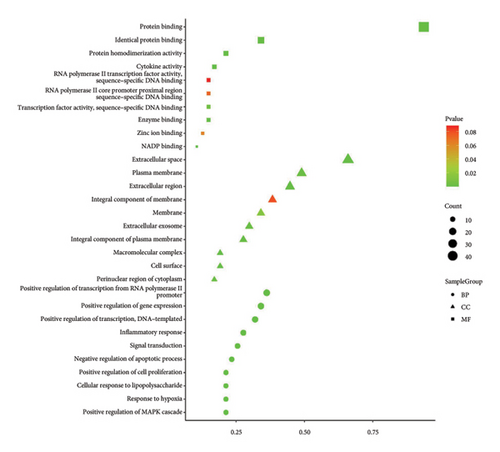
For the purpose of GO enrichment analysis, a collective of 47 target genes were inputted into the DAVID database. The findings revealed that 33 of these genes were primarily associated with cell components such as the extracellular space, integral membrane components, extracellular region, and plasma membrane. The 56 molecular functional processes mainly include protein binding, enzyme binding, cytokine activity, identical protein binding, protein homodimerization activity, etc. After thorough analysis, we identified 308 biological processes, predominantly encompassing the positive regulation of transcription initiated by RNA polymerase II promoters, gene expression, and DNA-templated transcription. Inflammatory response, signal transduction, and other vital biological phenomena were also observed. In terms of KEGG enrichment, we noted the involvement of pathways such as AGE-RAGE signaling in diabetic complications, cancer-related pathways, PI3K-Akt signaling, fluid shear stress and atherosclerosis and MAPK signaling. To further illustrate these findings, we selected the top 10 biological functions and top 15 pathways, utilizing specialized plotting software to generate GO function enrichment and KEGG pathway enrichment maps, both of which were based on the statistical significance (p value) of the enrichments (Figures 5(d) and 5(e)). The findings indicated that the principal mechanisms through which MLE reduces blood sugar and lipid levels involve the pathways associated with lipid metabolism and atherosclerosis, the PI3K-Akt signaling pathway and the AGE-RAGE signaling pathway. Therefore, it can be preliminarily speculated that MLE mainly eliminates inflammation and plays a role in lowering blood sugar and lipids through targets such as IL6, IL10, and TNF.
3.7. Molecular Docking Validation
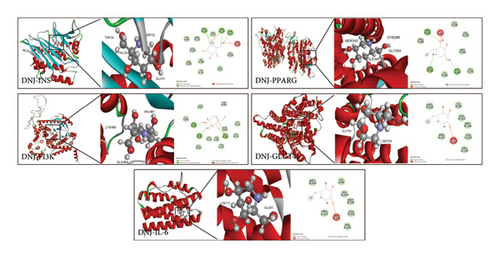
Molecular docking serves as a predictive tool to identify the optimal binding mode and evaluate ligand–receptor complex interactions by studying docking energy, and action sites [17]. There is a prevalent belief that the stability of a ligand’s conformation upon binding to a receptor is directly proportional to its energy level, implying that a lower energy state enhances the probability of an interaction. When the binding energy between the two is less than −5 Kcal/mol, it indicates that they bind well [24]. Using DNJ as a ligand, we performed molecular docking with target proteins INS, PPARG, PI3K, GLUT4, and IL-6 to study their potential binding patterns. The results revealed that the binding energies were all less than −5 Kcal/mol (Table 2), indicating that DNJ exhibited good binding activities with all five target proteins (Figure 6).
| Target | Binding energy (kcal/mol) |
|---|---|
| DNJ-INS | −36.30 |
| DNJ-PPARG | −48.96 |
| DNJ-PI3K | −51.13 |
| DNJ-GLUT4 | −23.68 |
| DNJ-IL6 | −26.33 |
3.8. MLE and DNJ Enhance the Regulation of Glucose and Lipid Metabolism Disorders Through Modulation of the IRS1/PI3K/AKT Signaling Pathway
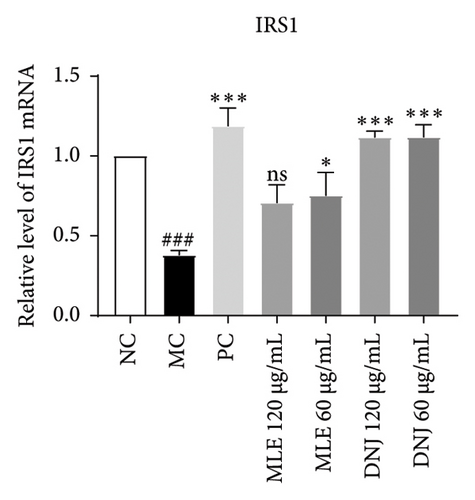
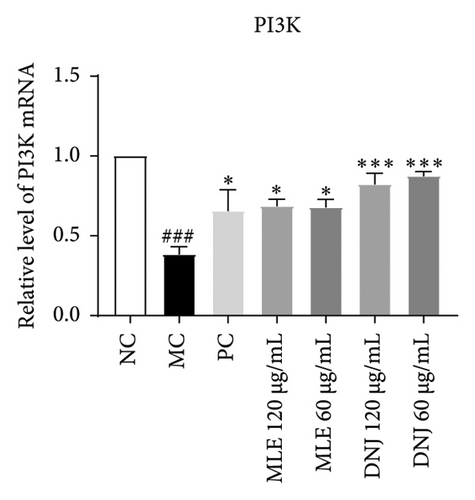
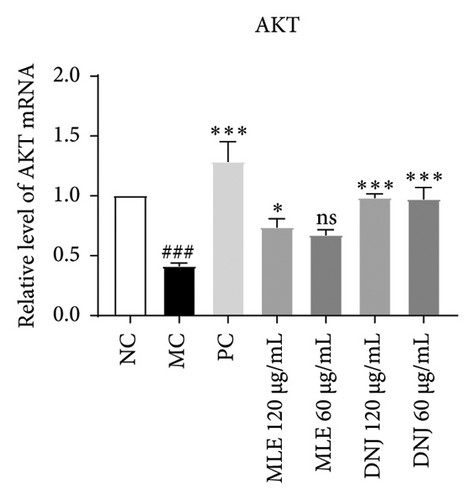
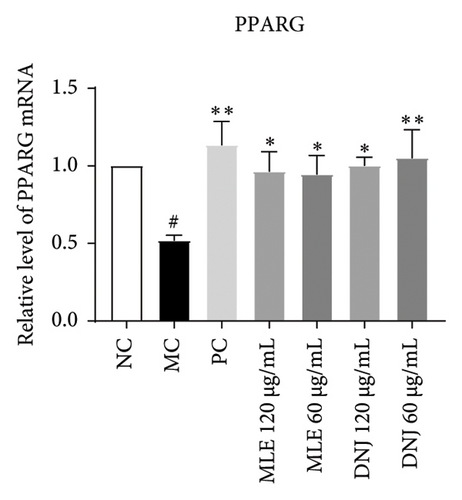
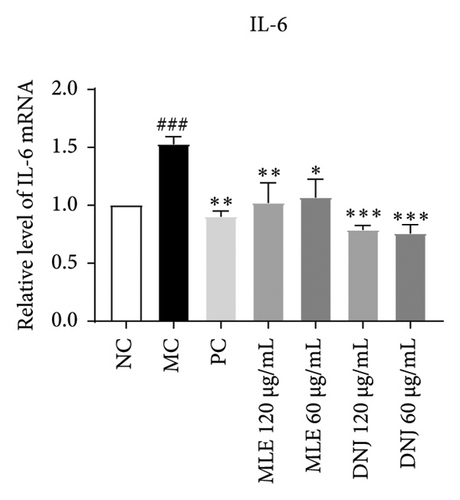
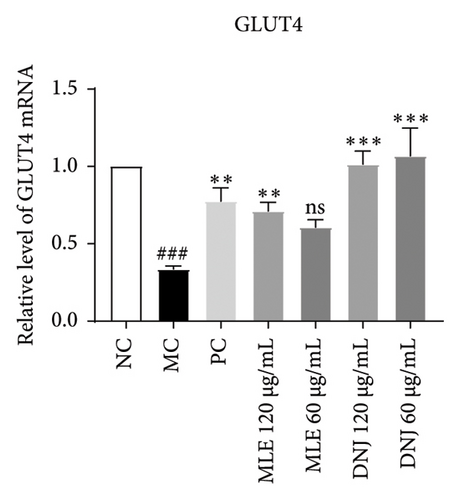
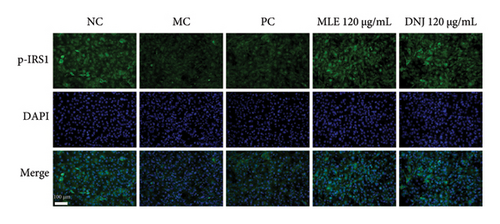
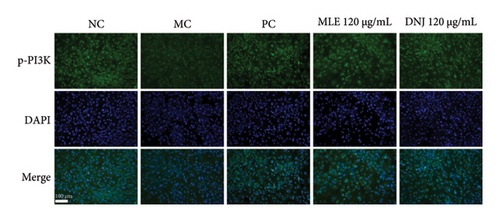
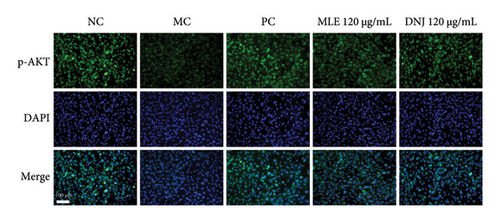
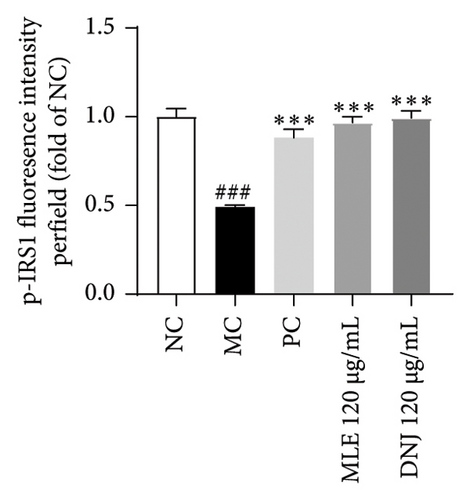
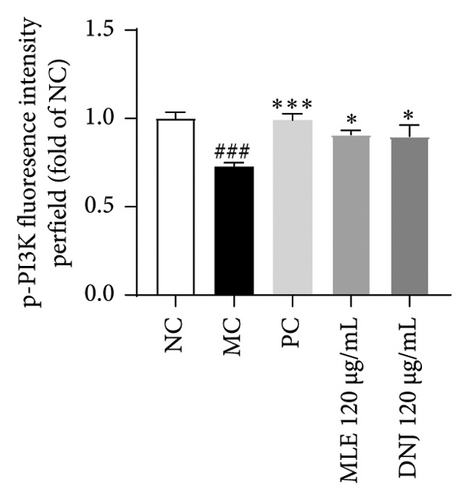
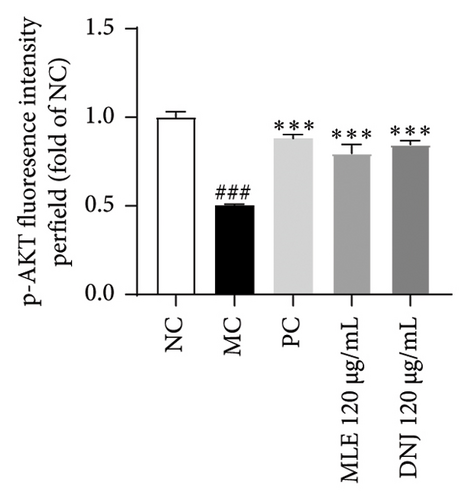
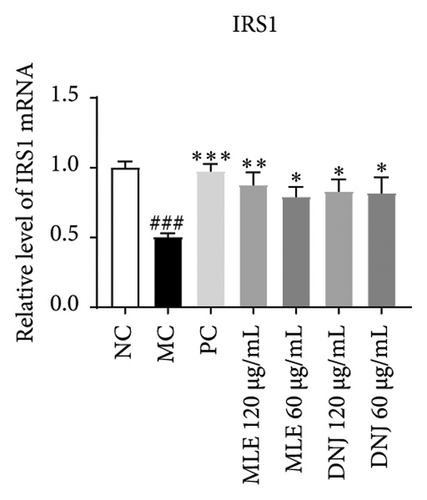
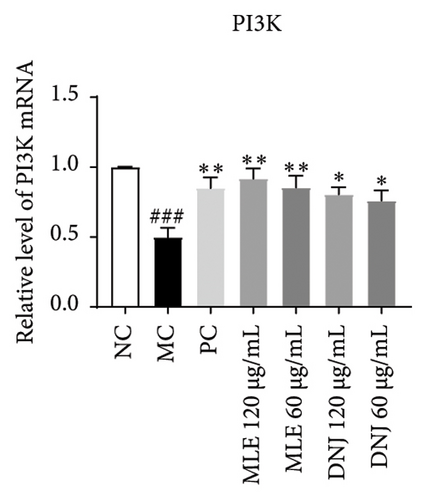
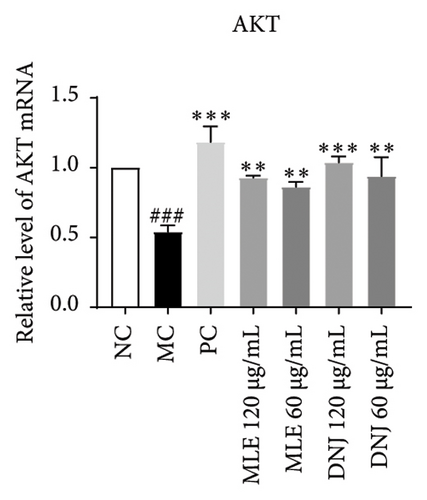
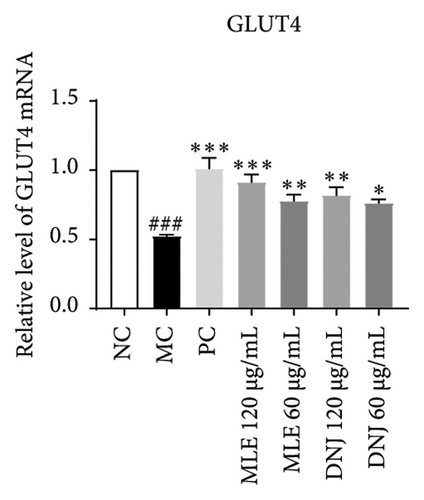
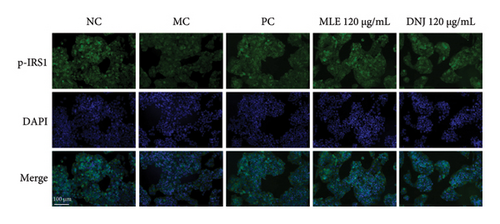
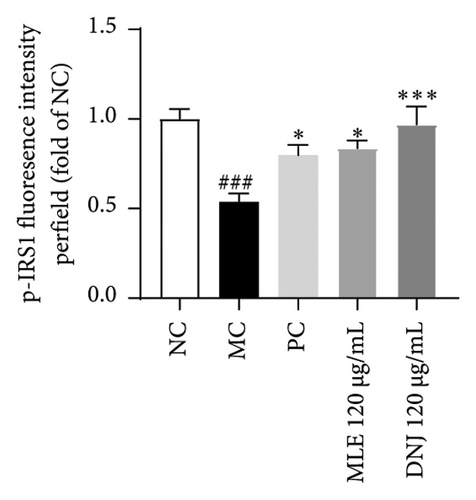
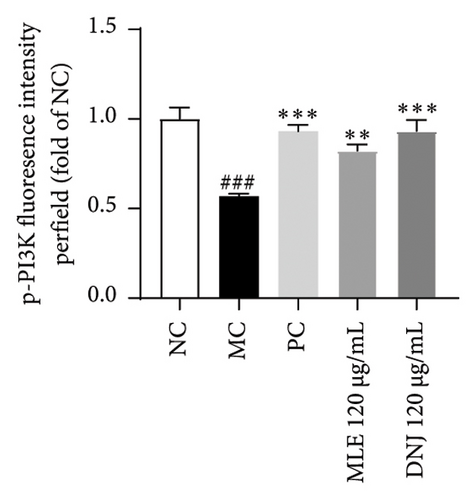
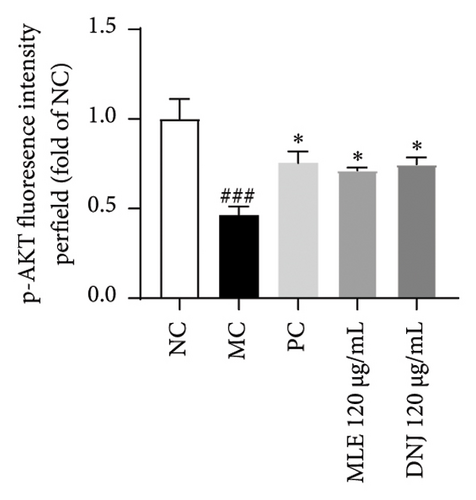
To evaluate the mechanisms of MLE and DNJ in regulating glucose and lipid metabolism, the gene and protein levels of the IRS1/PI3K/AKT signaling pathway were analyzed in 3T3-L1 adipocytes. Compared to MC, the gene expressions of IRS1, PI3K, and AKT in both MLE and DNJ groups were significantly upregulated, with a more pronounced increase observed at 120 μg/mL (Figures 7(a), 7(b), 7(c)). Additionally, after treatment with MLE and DNJ, the gene expressions of PPARG and GLUT4 were enhanced, while the expression of the IL-6 gene was reduced (Figures 7(d), 7(e), 7(f)). Immunofluorescence staining experiments demonstrated a significant increase in the fluorescence expression intensity of p-IRS1, p-PI3K, and p-AKT proteins (Figures 8(a), 8(b), 8(c), 8(d), 8(e), 8(f)). Furthermore, in the IR-HepG2 cell model, upregulated gene expressions of IRS1, PI3K, AKT, and GLUT4 (Figures 9(a), 9(b), 9(c), 9(d)), as well as increased fluorescent expression intensity of p-IRS1, p-PI3K, and p-AKT proteins, were also observed following treatment with MLE and DNJ (Figures 9(e), 9(f), 9(g), 9(h), 9(i), 9(j)). There were no significant changes in the protein levels of IRS1, PI3K, and AKT in 3T3-L1 cells and IR-HepG2 cells (Figures S1 and S2).
4. Discussion
T2DM is a systemic, chronic metabolic disease stemming from abnormally elevated blood glucose levels and disrupted glucose and lipid metabolism. This condition arises from a combination of genetic predisposition and acquired factors, including unhealthy dietary habits, excessive consumption of fatty and greasy foods, and insufficient physical activity. The development of T2DM is intimately tied to impairments in the body’s capacity to produce adequate insulin levels or to effectively utilize insulin, resulting in IR. Notably, IR serves as the primary cause of T2DM and represents a significant pathological characteristic of obesity and metabolic syndrome [25]. Although there are many drugs on the market that have hypoglycemic and hypolipidemic effects, long-term use may bring some adverse effects, such as diarrhea, abdominal discomfort, headache, and fatigue [26]. As a result, the quest for a natural compound to mitigate and prevent the onset of T2DM and diverse chronic health conditions has emerged as a promising direction for future research trend.
Mulberry leaves have attracted much attention due to their rich nutritional value derived from their numerous active substances. Given their outstanding hypoglycemic and hypolipidemic properties, these compounds are extensively employed in the management of diabetes, obesity, and a range of other health conditions [27, 28]. Existing reports indicate that alkaloids extracted from mulberry leaves, especially the polyhydroxy alkaloid DNJ, are considered key bioactive substances. In vitro studies have found that DNJ in mulberry leaves can promote the absorption of glucose by mature 3T3-L1 cells, thereby regulating glucose homeostasis [29]. This study extracted the active ingredients of mulberry leaves to increase the DNJ content to 1.48%. By measuring the α-glucosidase activity of MLE, the results indicate that MLE exhibit strong inhibitory activity against α-glucosidase. It is speculated that MLE may regulate glucose and lipid metabolism by inhibiting the activity of α-glucosidase. This study also verified through network pharmacology and molecular docking that DNJ has strong binding affinity with key target proteins such as PI3K, PPARG, INS, IL-6, and GLUT4. Therefore, we speculate that DNJ may be an important component of MLE in regulating glucose and lipid metabolism.
Within the diabetic context, the PI3K/AKT signaling pathway’s activation is frequently implicated as a contributing factor in insulin resistance. Insulin resistance leads to an increase in blood sugar levels, which in turn can lead to various complications. PI3K, an intracellular phosphatidylinositol kinase exhibiting serine and serine/threonine (Ser/Thr) kinase functions, serves as a target protein for IRS. When activated, the PI3K/Akt signaling pathway, a canonical insulin signaling pathway, effectively enhances insulin sensitivity and ameliorates T2DM [30, 31]. IRS1 protein is the main substrate of insulin receptor, and when the expression of IRS1 mRNA is reduced, it will inevitably lead to a decrease in the amount of IRS1 protein, weakening the intracellular receptor postinsulin signaling, and leading to a decrease in insulin action [32]. Concurrently, PI3K plays a pivotal role in facilitating the translocation of GLUT4 to the cell surface, ultimately activating glucose homeostasis. GLUT4 is the primary carrier protein for glucose transport for fats and plays a role in this process and influences glucose transport in peripheral tissues. Plasma insulin concentration serves as a pivotal factor in regulating blood glucose balance. It enhances the translocation of GLUT-4 to the cell membrane, governing the rate and direction of glucose transport through endocytosis and exocytosis mechanisms [33, 34]. In our investigation, we observed that MLE and DNJ augmented glucose utilization and glycogen accumulation in HepG2 cells by enhancing IRS1, PI3K, AKT, and GLUT4 expression. Immunofluorescence staining revealed an increase in the fluorescence intensity of p-IRS1, p-PI3K, and p-AKT protein expression after treatment with MLE and DNJ. This upregulation resulted in the reduction of glycemic activity and a notable improvement in insulin sensitivity.
The PI3K/AKT signaling pathway can affect lipid synthesis by regulating a variety of lipid metabolism genes. Studies have shown that PPARs can reduce TC, regulate the content of HDL and LDL, and maintain normal levels of blood lipid content and fat metabolism in the body [35]. PPARG is a major regulator of adipocyte gene expression and insulin cell-to-cell signal transduction and is involved in the regulation of adipocyte differentiation and glycolipid metabolism [36, 37]. Investigations have revealed that in rats with type 2 diabetes, the PI3K/AKT pathway in adipose tissue is compromised. Remarkably, limonene stimulates fat synthesis and accumulation via this pathway, thereby modulating lipid accumulation in hepatocytes and mitigating the adverse effects of glucose and lipid metabolic derangements [38]. In our study, we observed that MLE and DNJ exhibited significant lipid-lowering effects through its regulation of various metabolic genes in a 3T3-L1 adipocyte model. Specifically, it reduced TC, TG, and LDL-C levels while enhancing the expression of PI3K, AKT, IRS1, GLUT4, and PPARG. Additionally, immunofluorescence staining revealed a significant increase in the immunofluorescence intensity of p-IRS1, p-PI3K, and P-AKT proteins after treatment with MLE and DNJ. These actions collectively contributed to a decrease in lipid production, achieving the desired goal of lipid reduction.
Obesity is often accompanied by a substantial increase in inflammatory markers such as TNF-α, IL-6, and iNOS, leading to a chronic, mild inflammatory state that can promote the development of insulin resistance, diabetes, and cardiovascular disorders [39]. IL-6 and TNF-α are cytokines that exhibit profound metabolic and, potentially, weight-regulating impacts. Notably, adipose tissue serves as the primary systemic source of IL-6, and in the context of obesity, a reduction in fat mass leads to a corresponding decrease in circulating IL-6 levels [40]. In individuals afflicted with T2DM, a significant increase in the serum levels of CRP, TNF-α, IL-6, and IL-8 was observed, in comparison with those exhibiting healthy conditions [41]. Mice exhibiting obesity and fed a diet rich in fat display signs of intestinal inflammation, coupled with augmented levels of TNF-α [42]. In this study, it was found that MLE and DNJ could reduce IL-6 expression levels in the 3T3-L1 adipocyte model, and it was speculated that MLE could regulate inflammation and reduce lipid production by reducing IL-6 expression levels.
5. Conclusion
This study investigated the efficacy of MLE and DNJ in regulating glucose and lipid metabolism in vitro and explored their underlying molecular mechanisms. Utilizing 3T3-L1 cells and IR-HepG2 cells, the research found that MLE may regulate glucose and lipid metabolism through their inhibitory effects on α-glucosidase. Through network pharmacology, qPCR experiments, and immunofluorescence experiments, it was verified that MLE and DNJ achieve reductions in lipid levels and regulate glucose and lipid metabolism disorders by activating the IRS1/PI3K/AKT signaling pathway, increasing the expression of GLUT4 and PPARG genes, and decreasing the expression of IL-6 to alleviate inflammation. In summary, this comprehensive study explored the hypoglycemic and hypolipidemic properties of MLE and DNJ, providing valuable insights into their potential use in the daily management of hyperglycemia and hyperlipidemia, as well as in the development of functional foods and health supplements.
Conflicts of Interest
The authors declare no conflicts of interest.
Author Contributions
Yin-Di Zhang curated the data, wrote the original draft, and edited the manuscript. Jun-Xi Liu contributed to the study review and supervision. Fei-Fei Wang supervised the study and acquired funding. Li-Ping Qu conceptualized the study and acquired funding. All authors have read and approved the final the article.
Funding
This research was supported by the independent research fund of Yunnan Characteristic Plant Extraction Laboratory 2022YKZY004 and 2022YKZY005.
Acknowledgments
This research was supported by the independent research fund of Yunnan Characteristic Plant Extraction Laboratory 2022YKZY004 and 2022YKZY005. We are extremely grateful to Professor Haiyang Liu from the Kunming Institute of Botany in Yunnan for his assistance with plant identification. We would also like to thank Yichun Wang, Fengkun Xiao, Peng Xu, Xiuqin Pang, and Liangyun Ma of Yunnan Characteristic Plant Extraction Laboratory for their help in sample preparation and experimental support. We are especially grateful to editors Dr. Miguel Rebollo-Hernanz and Arunadevi Balasubramanian for their help with our manuscript.
Supporting Information
Additional supporting information can be found online in the Supporting Information section.
Open Research
Data Availability Statement
The data used to support the findings of this study are available from the corresponding authors upon request.


