Bioactive Flavonoids From Tsaoko Fructus: Antioxidant Capacity and Protection on UV-Damaged Cells and Stimulation to Caenorhabditis elegans Antioxidant System
Abstract
Tsaoko Fructus (TF), the dried ripe fruit of Amomum tsaoko Crevost et Lemarie (A. tsaoko), a dietary medicine plant, has been demonstrated to have high antioxidant activity. The main objective of this research was to investigate the isolation and purification of TF flavonoids ([TFFT, TFFC, and TFFP], TFFs) and their chemical constituents and antioxidant effects by in vitro and in vivo experiments. LC-MS/MS was used to clarify the chemical substance basis. The results of antioxidant activity in vitro showed that TFFs had excellent DPPH and ABTS radical scavenging capacity, FRAP, and total reducing power. UVB-damaged HaCaT cells and C. elegans models were used to study the effect of TFFs on oxidative stress. Results revealed that TFFS could significantly postpone oxidative damage in UVB-induced HaCaT cells by suppressing the ROS, MDA, TNF-α, and MMP-1 production and increasing the activity of SOD, CAT, and GSH-Px. Furthermore, TFFs could ameliorate heat resistance and oxidative damage of C. elegans. qRT-PCR results showed that TFFs could upregulate the mRNA expressions of gst-10, sod-3, and ctl-1 in C. elegans, indicating TFFs can promote the stress resistance of C. elegans by improving the capacity of the antioxidant oxidase system. Overall, these findings suggested that TFFs may be used as an antioxidant to postpone oxidative stress conditions.
1. Introduction
UVB is the most damaging component of sunlight, as it may penetrate the epidermis and reach the upper dermis, leading to oxidative stress and DNA damage [1]. In recent years, the health risks caused by UVB irradiation have received increasing attention [2]. Skin cancer is closely related to the overproduction of reactive oxygen species (ROS) by UVB radiation [3]. When the ROS concentration exceeds the antioxidant defenses, oxidative cell damage occurs [4]. Some botanical ingredients, especially flavonoids, are natural antioxidants that can effectively prevent UVB-induced cellular damage and have few side effects [5]. A previous study reported that the total flavonoids extracted from lemon peels can effectively interfere with UVB-induced oxidative stress and inflammation in mouse skin [6]. Baicalein, a flavonoid, was demonstrated to protect HaCaT (human epidermal keratinocyte line) cells against UVB radiation–induced damage and apoptosis by absorbing UVB and scavenging ROS [7].
A. tsaoko, from the Zingiberaceae family, is an edible plant in Yunnan, China, and grows at high altitudes in Yunnan and Vietnam [8]. Tsaoko Fructus (TF) (Caoguo in Chinese) is a dried ripe fruit of A. tsaoko that has been recorded in the pharmacopoeias of many countries in Asia and Europe. It has been traditionally employed in Chinese folk medicine for managing respiratory and gastrointestinal disorders, particularly as a natural remedy for alleviating cough and treating diarrhea. Studies have shown that TF is rich in flavonoids, volatile oils, phenolic acids (esters), diphenylheptanes, bicyclic nonanes, etc. [9], and it has been found that they have antibiotic [10], antitumor [11], antioxidative [12], and other pharmacological actions. Previous study found that the 60% ethanolic extraction of TF had a high antioxidant activity, with high content of gallic acid [13]. The ethanol crude extract of A. tsaoko fruit has antioxidant and α-glucosidase inhibitory activities, while the ethyl acetate extract of the ethanol crude extract shows better activities [14]. Zhang et al. [15] isolated A. tsaoko flavonoids using methanol and ethanol, and 29 flavonoids were found. In vitro, A. tsaoko extracts had strong antioxidant activity. However, there is a lack of further purification of TF flavonoids (TFFs) and studies on their antioxidant activity. It is of great interest to explore the isolation of TFFs and investigate their antioxidant effect in vitro and in vivo. Therefore, a hypothesis is proposed that TFFs extracted from A. tsaoko is the main substances that showed strong antioxidant activity.
To address the hypothesis, this present study isolated TFFs from A. tsaoko using heating reflux extraction with ethyl alcohol and analyzed their flavonoid constituents using LC-MS. Both in vitro and in vivo tests were carried out to examine the antioxidant properties of TFFs. The main objective of this study is to investigate the antioxidant activities of TFFs, providing a theoretical basis for their potential use as antioxidants.
2. Materials and Methods
2.1. Materials and Reagents
TF dried samples were purchased from Guangzhou Qingping Chinese Herbal Medicine Wholesale Market (Guangdong Province, China) and are of Guangxi Province (China) origin. Botanical identification of TF was performed by Professor Gang Hao from College of Life Science, South China Agriculture University. HPD 300 macroporous resin was obtained from Beijing H&E Ltd Corporation (Beijing, China). 3-(4,5-Dimethyl-2-thiazolyl)-2,5-diphenyl-2H-tetrazolium bromide (MTT) was obtained from Sigma-Aldrich (Shanghai, China). Dulbecco’s modified Eagle’s medium (DMEM), fetal bovine serum (FBS), penicillin, streptomycin, and Trizol reagent were purchased from GIBCO (Grand Island, NY, USA). The assay kits for catalase (CAT), superoxide dismutase (SOD), glutathione peroxidase (GSH-Px), and malondialdehyde (MDA) were purchased from Nanjing Jiancheng Bioengineering Institute (Nanjing, Jiangsu, China). And the ROS assay kits were produced by MeilunBio Co., Ltd. (Dalian, Liaoning, China). Human matrix metalloproteinase 1 (MMP-1) and tumor necrosis factor-α (TNF-α) ELISA kits were purchased from Cusabio Biotech Co., Ltd. (Wuhan, China). All other chemical reagents used in this study were of analytical grade.
2.2. Preparation and Determination of TFFs
TF were grounded with a cutting machine and then passed through a 50-mesh sieve to obtain fine powder. The dried powders were soaked with 70% ethyl alcohol, and then extracted by heating and reflux at 80°C for 3 h. After three times of heating reflux extraction, the alcohol liquid was collected and concentrated into stiff paste using a rotary evaporator (YRSHYQ, SH, China), which was dried at 45°C to obtain the alcohol extracts: TF total flavonoids (TFFT). Subsequently, TFFT was redissolved with distilled water, and then partitioned with ethyl acetate to obtain the crude flavonoids (TFFC). Following this, the impurities in TFFC were removed through HPD 300 macroporous resin using distilled water, 50% ethanol and 70% ethanol. The 70% alcohol eluates were condensed to yield TFFP. Using rutin as the standard, the aluminum nitrate method was employed to determine the flavonoid content in TFFT, TFFC, and TFFP. The measured standard curve was y = 15.687x + 0.0006 (R2 = 0.9970) (1). The absorbance values measured at 510 nm were substituted into the standard curve to calculate the rutin equivalent, with the results expressed as the percentage of rutin equivalent per milligram of sample (%) [16].
2.3. FT-IR Spectra and LC-MS/MS Analysis
The FT-IR spectra were determined by potassium bromide (KBr) pellet method as reported previously [17]. TFFC and TFFP powder (2 mg) was mixed with KBr powder (200 mg), and then pressed into a pellet. The pellet was subjected to infrared scanning in the range of 4000–500 cm−1 using a Fourier transform infrared spectrophotometer (Bruker, Ettlingen, Germany).
The components of flavonoids were identified through LC-MS/MS. TFFC and TFFP were dissolved in 50% acetonitrile to the final concentration of 50 ppm, and the mixture solution was passed through a 0.22 μm nylon membrane. Chromatographic analysis was performed on an Agilent Technologies 1290 Series System (Agilent, USA). The column was a Waters ACQUIY UPLC HSS T3 (2.1 mm × 100 mm, 1.8 μm). The binary mobile phase consisted of acetonitrile (phase A) and 0.01% formic acid in water (phase B). The gradient elution program was as follows: 2%–50% phase A at 0–18 min, 50%–95% phase A at 18–21 min, maintain 95% phase A at 21–23 min and 2% phase A at 23–25 min. The flow rate was 0.2 mL/min; 5 μL sample was injected into the system and the eluent was monitored for UV absorption at 210 nm. The MS data was recorded by Bruker maXis impact system (Bruker, Germany) with an ESI interface in negative ion mode. The parameters of ESI-MS were set as follows: sheath gas flow rate of 35 arbitrary units, aux gas flow rate of 10 arb arbitrary units, capillary temperature of 320°C, heater temperature of 350°C, and spray voltage of 3.0 kV. Primary mass spectra were recorded through full MS scan with 70,000 resolution ratio and a scanning range of 70–1050 m/z. The secondary mass spectrometry was detected through MS2 with a resolution ratio of 17,500.
2.4. Antioxidant Activity of TFFs In Vitro
The in vitro antioxidant capacity of TFFs was evaluated by measuring the DPPH radical scavenging capacity, ABTS radical scavenging capacity, ferric ion reducing antioxidant power (FRAP), and total reducing power. Vitamin C (VC) was used as an antioxidant positive control. The TFFs (TFFT, TFFC, and TFFP) sample concentrations were set as: 50, 100, 200, 400, and 800 μg/mL.
The DPPH assay was performed according to the method reported previously with some modifications [18]. Take 20 μL of samples at different concentrations (50, 100, 200, 400, and 800 μg/mL) and add them to a 96-well plate, followed by the addition of 180 μL of 150 μmol/L DPPH solution. After 10 min of reaction time in the dark, the absorbance values at 517 nm were measured on a 96-well plate with 20 μL of various concentrations of samples and 180 μL of 150 μmol/L DPPH solution. Anhydrous ethanol was used as the blank, while a VC solution was used as the positive control. DPPH was used as the background control instead of anhydrous ethanol. The DPPH radical scavenging activity (%) was calculated using the formula: (1−(Asample − Abackground)/Ablank) × 100%(2). “A” stands for absorbance.
For ABTS radical scavenging capacity assay, the procedure followed the method reported previously with slight modifications [19]. The stock solution was prepared by mixing equal amounts of 7 mmol/L ABTS solution and 4.9 mmol/L potassium persulfate solution. The stock solution was diluted with ethanol to a gradient concentration: 0.15, 0.20, 0.25, 0.30, and 0.35 mmol/L. The working solution was obtained by mixing 180 μL of ABTS solution and 20 μL of water. After 5 min of reaction in the dark, the absorbance values at 734 nm were measured on a 96-well plate with 20 μL of various concentrations of samples and 180 μL of ABTS working solution. Water was used as the blank, while a VC solution was used as the positive control. ABTS was used as the background control instead of anhydrous ethanol. ABTS radical scavenging activity (%) was calculated using the formula: (1 – (A sample – A background)/A blank) × 100% (3).
The FRAP assay was performed according to the reported method with some modifications [20]; 0.3 mol/L sodium acetate solution, 10 mmol/L TPTZ hydrochloric acid solution, and 20 mmol/L FeCl3 solution in a 10:1:1 ratio were combined to make the TPTZ working solution. In a 96-well plate, add 20 μL of FeSO4 solution with different concentrations (0.1, 0.2, 0.4, 0.6, 0.8, and 1.0 mmol/L) and 180 μL of TPTZ working solution, and then react for 5 min at room temperature, protected from light, to determine the absorbance value at 593 nm and plot the standard curve. By substituting samples for FeSO4, the absorbance at 593 nm was calculated. The FRAP of TFFs was determined using the FeSO4 standard curve. FRAP values were expressed as millimolar FeSO4 equivalent (mM Fe2+ Eq), defined as the concentration of FeSO4 required to produce the same absorbance as the sample at 593 nm. Water and VC solution were substituted for the samples as the blank and positive groups, respectively.
For total reducing power assay, the procedure followed reported method with slight modifications [21]. In a centrifuge tube, equal parts 1% potassium ferricyanide, PBS (PH = 6.6), and sample solution were combined. After 20 min of reaction at 50°C, the centrifuge tube was quickly cooled with running water, and the reaction was stopped with 10% trichloroacetic acid. After centrifugation, 90 μL of supernatant, 90 μL of distilled water, and 18 μL of 0.1% ferric chloride were placed on a 96-well plate for 10 min, and absorbance was measured at 700 nm. For the blank and positive controls, the sample solution was replaced with distilled water and VC, respectively. Total reducing power = A sample – A blank(4).
2.5. Cell Culture and Establishment of UV-Damaged HaCaT Cells
Cell proliferation inhibition was utilized to investigate the toxicity of TFFs on HaCaT cells. Specifically, when the cells entered the logarithmic growth phase, the media was removed and the cells were washed twice with PBS. Trypsin was employed to digest the cells for 2 min. After gentle blowing and mixing, the cells were centrifuged at 34 × g for 5 min. The concentration of cells was adjusted to 8 × 10⁴ cells/mL using Complete culture medium. The complete cell culture medium was prepared by mixing DMEM, FBS, and a double-antibiotic solution (a mixture of penicillin and streptomycin) in the ratio of 9:1:0.1. Samples were dissolved in DMSO to form a 100 mg/mL stock solution, which was then aliquoted and stored at −20°C. Before use, the stock solution was diluted to the desired concentration with complete culture medium, ensuring the final DMSO concentration in the treated cells was below 1%. All sample solutions were filter-sterilized using a 0.22-μm membrane filter before application to the cells. A 100-μL cell suspension was added to 96-well plates and grown in a CO2 incubator at 37°C for 24 h. The growth media was gradually drawn out, and 100 μL samples were added to each well. Complete culture medium was used as a normal control. After incubated for 24 h at 37°C, the cell viability was tested by MTT method as described in previous literature [22]. Then, the absorbance value was detected at 570 nm. Cell viability (%) = A sample/A control × 100%(5).
Prior to analyzing the UV protection of flavonoids, the UV irradiation dose should be determined. When the HaCaT cells reached 80%–90% confluence, 500 μL cells were seeded in 24-well plates at a density of 1.2 × 10⁵ cells/mL. After incubation for 24 h, the culture medium was slowly sucked out, and the cells was washed carefully twice with PBS. Then, PBS (300 μL/well) was added before UV irradiation to avoid cell dehydration. The UV irradiation dose was set at 10, 20, 30, 40, and 50 mJ/cm2 using UV irradiation device (HOPE-MED 8140, Tianjin Development Zone Hepu Industry & Trade Co. Ltd., Tianjin, China). After treatment with UV irradiation, the PBS was replaced with culture medium (500 μL/well). After 24 h of incubation, the cell viability was tested by the MTT method and calculated as equation (6). The UV irradiation dose was chosen for further study when the survival rate of HaCaT cells is about 50%.
The experiment was performed in control group, model group, and TFFs groups. After the UV-damaged HaCaT cells model was established, the survival rate of the cells was measured by MTT assay after adding 500 μL sample solution for 24 h, and the cell morphology was observed under a microscope (LIOO, Germany).
2.6. Determination of the Effect of TFFs on Antioxidant System and MMP-1 and TNF-α of UVB-Damaged HaCaT Cells
ROS, CAT, GSH-Px, SOD, and MDA levels were detected following the methods of the previous study with some modifications [23]. After the UV-damaged HaCaT cells model was established, the cells with treatments of TFFs for 24 h were collected. The cell pellet was disrupted using an ultrasonic cell disruptor (Ningbo Scientz Biotechnology Co., Ltd., Zhejiang, China) under ice-water bath conditions. The procedure was performed at 300 W power output, with each cycle lasting 3–5 s followed by a 30-s cooling interval. This process was repeated for three to five cycles. Thereafter, the ROS, CAT, GSH-Px, SOD, and MDA levels were quantified using the BCA protein commercial kits. DCFH-DA was used to detect intracellular ROS detection of HaCaT cells and the levels of MMP-1 and TNF-α were evaluated using the commercial kits (Cusabio Biotech Co., Ltd., Wuhan, China).
2.7. C. elegans Stains and Maintenance
C. elegans N2 (wild type) was used in this study and the age-synchronized C. elegans N2 were collected following the methods of the previous study [24]. Worms were grown on nematode growth media (NMG) plates seeded with E. coli strain OP50 as a food. Then, 100 μM FUdR (5-fluoro-2′-deoxyuridine) was added to NMG to prevent the worm from laying eggs and hatching new worms to interfere with the experiments. Samples were dissolved in DMSO to form a 500 μg/μL stock solution, which was then aliquoted and stored at −20°C. Before use, the stock solution was diluted to the desired concentration with S medium, ensuring the final DMSO concentration in the treated C. elegans was below 0.1%. All sample solutions were filter-sterilized using a 0.22-μm membrane filter before application to the C. elegans. The protocols for preparing NGM, M9 buffer, and S medium used in the experiments are described in previous reference [25].
2.8. Determination of TFFs Concentrations and Stress Resistance Test of C. elegans
The L4-synchronized worms were collected with M9 buffer, and the density was regulated using S medium to contain 5–10 worms per 10 μL. To determine the experimental TFFs concentration, we added 20 μL of different concentrations of TFFs solution, 50 μL of 5-FUdR solution, 10 μL of OP50, and 20 μL of worms into 96-well plates, in which 20 μL of S medium was used in the blank group instead of the sample solution. A minimum of 120 C. elegans should be included in each group, recorded the number of live worms in each well at this time, and then calculated the survival rate of worms after incubation in an incubator at 20°C for 48 h. Survival rate (%) = (Number of live C. elegans/Total number of C. elegans) × 100%(7).
To conduct heat stress and oxidative stress experiments, 20 μL of TFFs solution, 50 μL of 5-FudR mixture, 10 μL of OP50, and 20 μL of L4-synchronized worms were added to 96-well plates at 20°C for 72 h. A blank group of 20-μL S medium was used instead of the sample solution. For the heat stress experiment, the 96-well plate (including both blank group and sample groups) was sealed with a sealing membrane, and the sealing membrane was removed after 5 h of incubation at 35°C, and the survival rate of worms was counted after 12 h of incubation in a 20°C incubator. For the oxidative stress experiment, a total of 100 μL of paraquat solution at a concentration of 20 mM was supplied to each well, and worm survival was counted after 10 h of incubation. For the heat stress experiment and the oxidative stress experiment, a minimum of 120 C. elegans should be included in each group.
2.9. Determination of the Effect of TFFs on Antioxidant System of C. elegans
The M9 buffer was used to gather the L4-synchronized worms, and the density was set at 60 worms/well, and add 200 μg/mL TFFs solution (400 μL), 5-FUdR combination (1 mL), and inactivated OP50 (200 μL) to a 6-well plate. The plate was then incubated at 20°C for 5 days. The DCFH-DA technique was used to treat the worms′ ROS levels, and an inverted fluorescence microscope was used to take pictures. After worms were gathered in 1.5 mL centrifuge tubes and mashed with liquid nitrogen to create worm homogenate, the commercial kits were used to measure the protein content, SOD, CAT, and GSH-Px enzyme activities (Nanjing Jiancheng Bioengineering Institute, Nanjing, China).
2.10. Gene Expression Assay by Quantitative Real-Time Polymerase Chain Reaction (qRT-PCR)
Total RNA was extracted from 5-day-old adult worms using the total RNA extraction kit and reverse-transcribed into cDNA with the Color Reverse Transcription Kit and stored at −80°C for qRT-PCR. The detection was carried out on the Quant Studio 7 Flex using 2 × Color SYBR Green qPCR Master Mix (ROX2 plus) as the detection method. The gene expression data were analyzed using the comparative 2−△△CT method, with act-1 taken as the internal control. Primer sequences are listed in Table S1 of Supporting Information.
2.11. Statistical Analysis
The data (from at least three independent experiments) were shown as mean ± standard deviation (SD). Variances among the groups were analyzed by one-way analysis of variance (ANOVA). All statistical analyses were performed by using SPSS 20.0 (SPSS Inc., CA, USA). Variances were considered significant at p < 0.05. Figures were drawn by Origin 2020 and Adobe Illustrator 2022.
3. Results
3.1. Component Identification of TFFs
The extraction yield and flavonoid content of TFFT, TFFC, and TFFP are presented in Table 1. The higher flavonoid concentration during the isolation operations suggested that the separation and purification of flavonoids was effective.
| Sample | Extraction yield | Flavonoid content |
|---|---|---|
| TFFT | 17.95% ± 1.84% | 17.95% ± 0.95% |
| TFFC | 46.25% ± 2.79% | 50.07% ± 1.27% |
| TFFP | 13.20% ± 0.63% | 90.13% ± 1.19% |
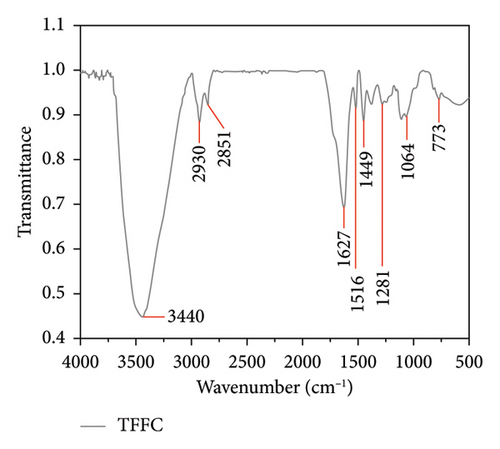
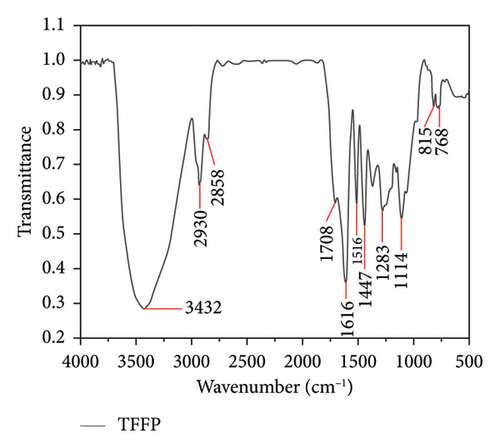
Then, FT-IR scanning spectrum was evaluated. The FT-IR of TFFC and TFFP revealed that several absorption bands are typical characteristic peaks at 500–4000 cm−1 (Figure 1). The peak form and most recognizable peaks of the TFFC (Figure 1(a)) and TFFP (Figure 1(b)) infrared spectra maps were identical; however, the peak position and intensity differ. The hydroxyl group caused the absorption peaks of TFFC at 3440 cm−1 and TFFP at 3432 cm−1, while the C–H absorption peaks of TFFC and TFFP around 2930 and 2850 cm−1 were induced by benzene ring alternations. The aryl carbonyl stretching vibration maxima of TFFC and TFFP were at wavenumbers 1627 and 1616 cm−1, respectively. There were typical absorption peaks of C=C vibration in the benzene ring between 1516 and 1447 cm−1. The hydroxyl group’s bending vibration peak was discovered around 1320–1158 cm−1. At the wave range 890–700 cm−1, there was an absorption peak generated by substituents on the benzene ring. Furthermore, the ether bond on the epoxy ring in the C6–C3–C6 structure absorbed the TFFC signal at 1063 cm−1. The C–O stretching vibration of the hydroxyl group caused an absorption peak in TFFP at 1200–1050 cm−1. There is no absorption in the range of 1700–1900 cm−1, indicating that there were no carboxyl groups and ester bonds; there was no absorption in the range of 2600–3000 cm−1, indicating that there were no long-chain alkanes and conjugated double bonds, and methyl and methylene are relatively small.
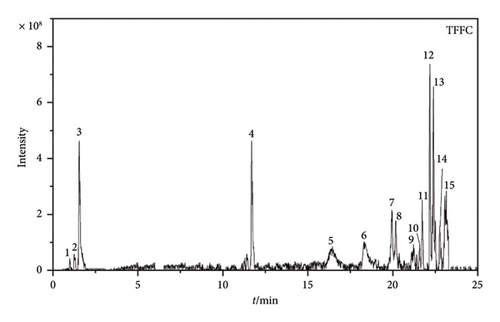
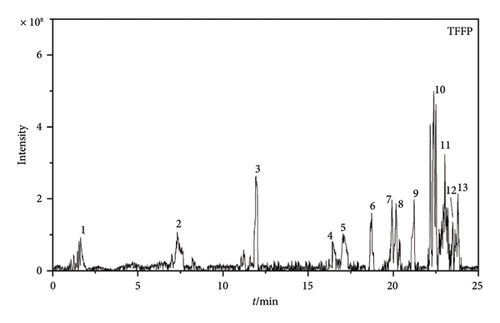
According to the results of LC-MS/MS data (Figures 1(c) and 1(d)), the compositions of TFFC and TFFP differ somewhat. TFFC was found to be composed of at least 15 compounds, whereas TFFP was composed of at least 13 compounds based on their total ion chromatograms. The flavonoid components of TFFC and TFFP were determined by their first-level mass spectrometry (MS1) and second-level mass spectrometry (MS2), which are shown in Figures S1–S18 of Supporting Information. And nine flavonoid components were identified and are shown in Table 2. TFFC and TFFP both contained at least seven flavonoid components, including 2′,4,4′-trimethoxychalcone, 8-aldehyde-catechin, Amomutsaokin A, Amomutsaokin G, Tsaokoflavanol A, Tsaokoflavanol B, and Tsaokoflavanol F. Additionally, (−)-catechin and (2R,3R,4R)-3′,5′-dimethoxy-3,4,7,4′-tetrahydroxy-flavan are unique components found only in ATC. It is worth noting that (2R,3R,4R)-3′,5′-dimethoxy-3,4,7,4′-tetrahydroxy-flavan, Tsaokoflavanol A, Tsaokoflavanol B, Tsaokoflavanol F, Amomutsaokin A, and Amomutsaokin G are all new substances that have been isolated from A. tsaoko for the first time.
| Peaks | RT (min) | m/z | Compound | Chemical formula | Adduct ion | Source | Reference |
|---|---|---|---|---|---|---|---|
| 1 | 1.55 | 289.07 | (−)-catechin | C15H14O6 | M-H | TFFC | [26] |
| 2 | 1.57 | 333.09 | (2R,3R,4R)-3′,5′-dimethoxy-3,4,7,4′-tetrahydroxy-flavan | C17H18O7 | M-H | TFFC | [26] |
| 3 | 23.07 | 343.12 | 2′,4,4′-trimethoxychalcone | C18H18O4 | M + FA-H | TFFC, TFFP | [26] |
| 4 | 11.97 | 317.07 | 8-aldehyde-catechin | C16H14O7 | M-H | TFFC, TFFP | [27] |
| 5 | 21.37 | 469.19 | Amomutsaokin A | C25H28O6 | M + FA-H | TFFC, TFFP | [27] |
| 6 | 16.79 | 441.19 | Amomutsaokin G | C25H30O7 | M-H | TFFC, TFFP | [27] |
| 7 | 16.67 | 415.18 | Tsaokoflavanol A | C23H28O7 | M-H | TFFC, TFFP | [28] |
| 8 | 21.04 | 443.21 | Tsaokoflavanol B | C25H32O7 | M-H | TFFC, TFFP | [28] |
| 9 | 21.26 | 471.24 | Tsaokoflavanol F | C27H36O7 | M-H | TFFC, TFFP | [28] |
3.2. Antioxidant Activity of TFFs In Vitro
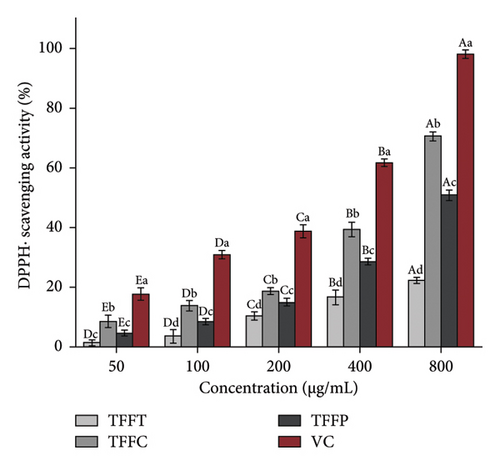
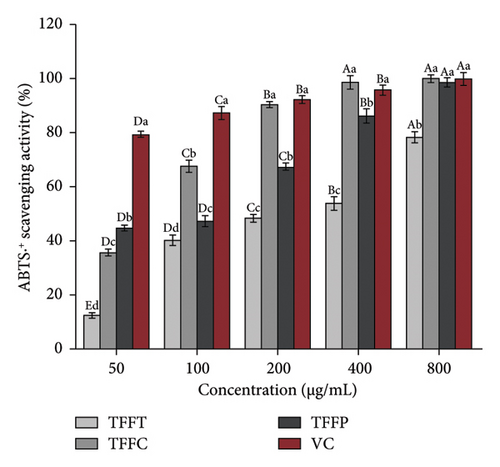
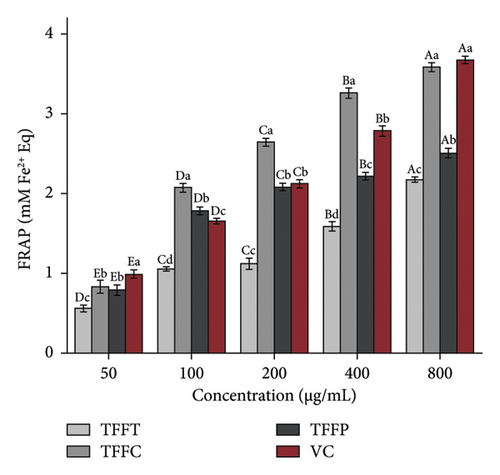
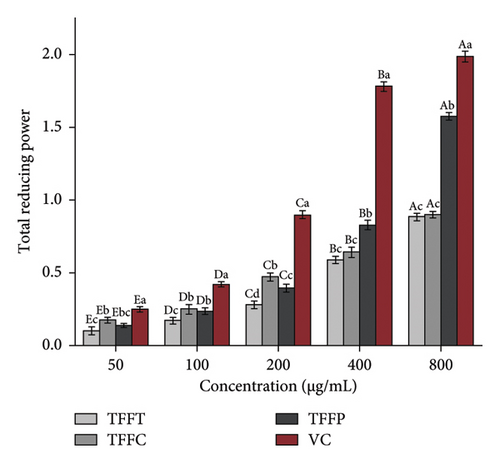
The results of the antioxidant activity of TFFs are summarized in Table 3. As demonstrated in Figure 2(a), as concentration increased, the DPPH radical scavenging activity in the sample groups correspondingly increased. The scavenging capability of DPPH radical in the sample concentration range of 50–800 μg/mL was comparable to that of VC. At the concentration of 50 μg/mL, the DPPH radical scavenging activity of TFFC was approximately 50% that of the VC. TFFC’s DPPH radical scavenging activity was 70.51% at 800 μg/mL, which was 8.39 times that of the low concentration (50 μg/mL). When TFFP was at the concentration of 800 μg/mL, the DPPH radical scavenging rate reached 50.72%. The capacity of TFFs to scavenge ABTS radical increased with concentration (Figure 2(b)). However, when the concentration of ABTS radical increased, the scavenging capacity increasing range of VC and TFFC declined, showing that the scavenging ability of VC and TFFC at high concentrations had achieved saturation. At 50–800 μg/mL, TFFC had the greatest ABTS radical scavenging capacity, while the scavenging rate of TFFC at 200–800 μg/mL was comparable to that of VC, and the scavenging activity of TFFP at 400 μg/mL was 86.07%. The scavenging capacity of TFFT on ABTS radical was the lowest, although at 200 μg/mL, it topped 40%. In the experiment to investigate the reducing ability of TFFs to Fe3+, we found that the reducing ability of each sample to Fe3+ increased with concentration, indicating that the ability of TFFs and VC to promote Fe3+ reduction was dose dependent (Figure 2(c)). The antioxidant capacities of TFFT, TFFC, and TFFP are comparable at 50 μg/mL. When the concentration reached 100–800 μg/mL, the FRAP value of TFFC was the greatest, even topping the VC group at 100–400 μg/mL. Finally, we examined the total reducing capacity of flavonoids and found that it increased in a concentration-dependent way in the range of 50–800 μg/mL (Figure 2(d)). The total reducing power of TFFP at 800 μg/mL was 1.58, 1.74 times that of TFFC (0.90) and 1.78 times that of TFFT (0.89), which was comparable to 80% of the total reducing power of the VC group at the same dose.
| Sample | TFFT | TFFC | TFFP | VC |
|---|---|---|---|---|
| DPPH• scavenging activity IC50 (μg/mL) | 800 < IC50 | 571.75 | 795.00 | 325.6 |
| ABTS•+ scavenging activity IC50(μg/mL) | 235.31 | 58.25 | 94.27 | IC50 < 50 |
| FRAP in 800 μg/mL | 2.17 | 3.59 | 2.51 | 3.68 |
| Total reducing power in 800 μg/mL | 0.89 | 0.90 | 1.56 | 1.99 |
3.3. Establishment of UVB-Damaged HaCaT Cells and TFFs Anti-UVB Damage Effect
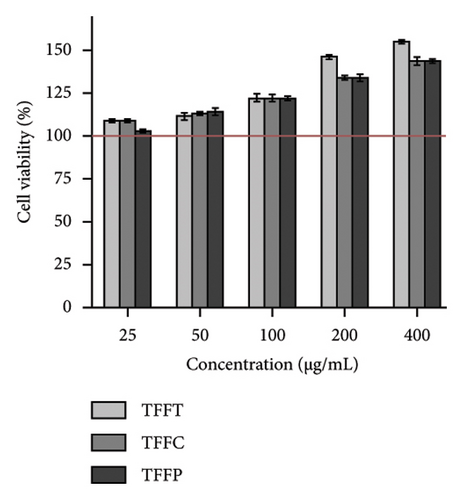
The survival rate of normal HaCaT cells revealed that TFFs samples had no harmful impact on HaCaT cells at concentrations ranging from 25 to 400 μg/mL, and showed a certain proliferation promotion effect as concentration increased (Figure 3(a)). The survival percentage of HaCaT cells was more than 120% when the concentration of TFFs was greater than 50 μg/mL. To avoid the sample effect on promoting proliferation impact on activity evaluation, the following TFFs experiment concentrations were chosen: 12.5, 25, and 50 μg/mL.
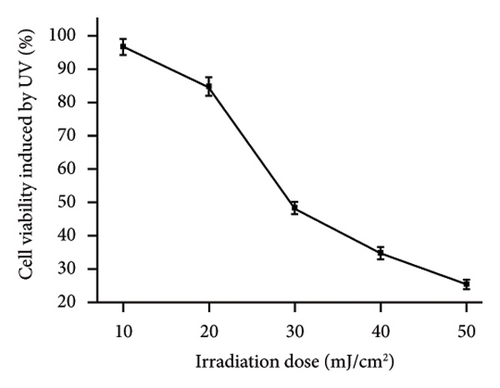

We used different UVB radiation energies to irradiate HaCaT cells, and the results of cell survival rate after 24 h of culture are presented in Figure 3(b). The cell survival rate dropped as the irradiation energy increased. Cell survival was 48.12% when the UV intensity was 30 mJ/cm2. There is currently no common standard for radiation dosage in both domestic and international studies. However, investigations have indicated that when the survival rate of HaCaT cells is about 50%, the levels of intracellular ROS and free radicals rise, causing damage to the antioxidant enzyme system [29]; the optimal radiation dose for establishing injured cell model was decided based on the median lethal radiation intensity. As a result, the irradiation energy of 30 mJ/cm2 was used for the following tests in this study.
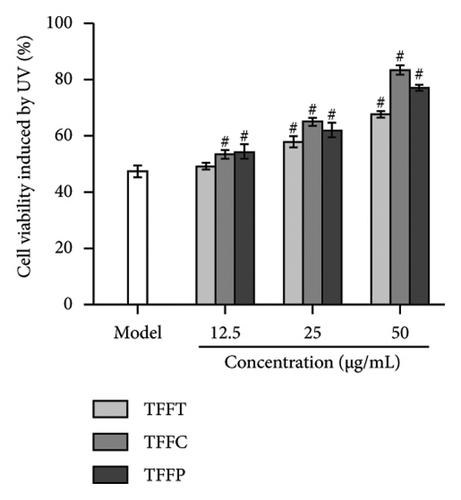
The survival rate of HaCaT cells injured by UVB at 30 mJ/cm2 varied with concentration. The model group’s HaCaT cells survival rate was 47.33%, demonstrating that the UV damage model was successfully established. TFFC and TFFP might considerably increase cell viability at low concentrations (#p < 0.05). At medium concentrations, TFFT, TFFC, and TFFP all demonstrated substantial protective effects on HaCaT cells. HaCaT cells viability rose to more than 80% at high concentrations of TFFC, suggesting that TFFC had a potent anti-UVB damaging impact at high concentration. The uneven rhomboid shape of normal HaCaT cells is seen in the image (Figure 3(d)). Following irradiation, the model group’s adhering living cells decreased in number, their volume shrank, and their form took on a rounder form. Following 50 μg/mL TFFT, TFFC, and TFFP treatment, the number of living HaCaT cells increased in comparison to the model group. Additionally, the morphology and size of the cells did not significantly differ from those of the control group, suggesting that all of the flavonoids found in TF protected HaCaT cells from UVB irradiation.
3.4. Determination of the Antioxidant Activity of TFFs in HaCaT Cells
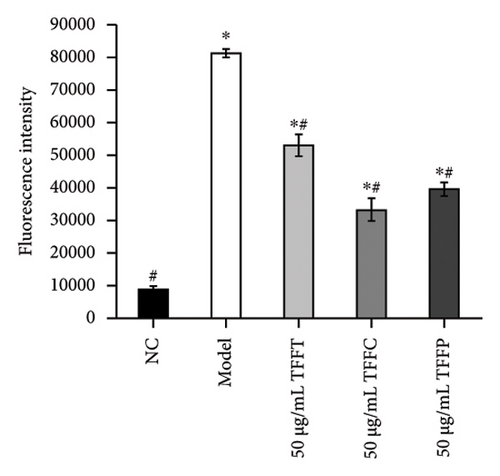
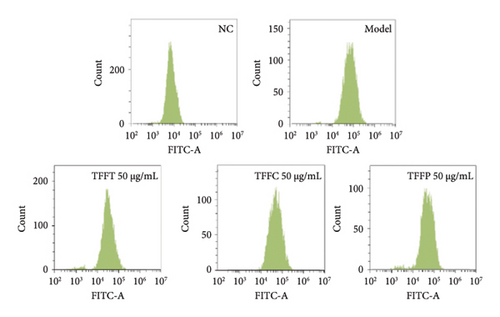
Long-term UV radiation exposure to the skin can cause the body’s antioxidant system to be destroyed by the fast buildup of intracellular ROS, which can hinder normal cell metabolism and cause a cascade of oxidative stress events [30]. After UV irradiation, the ROS level of HaCaT cells treated with 50 μg/mL TFFs was measured using flow cytometry in conjunction with the DCFH-DA fluorescent probe method to assess the protective impact on UV-damaged HaCaT cells. The mean fluorescence intensity of the cells in the model group was considerably higher (∗p < 0.05) than that of the control group (Figures 3(e) and 3(f)), suggesting that UV irradiation may raise the ROS levels in HaCaT cells. The amount of intracellular ROS was reduced by TFFs to varied degrees when compared to the model group. TFFC exhibited the highest level of inhibition, with ROS levels just 40.8% of the model control group, whilst TFFT and TFFP groups had levels 65.33% and 48.57% of the model group, respectively. As a result, HaCaT cells′ capacity to reduce intracellular ROS levels was graded as follows: TFFC > TFFP > TFFT.
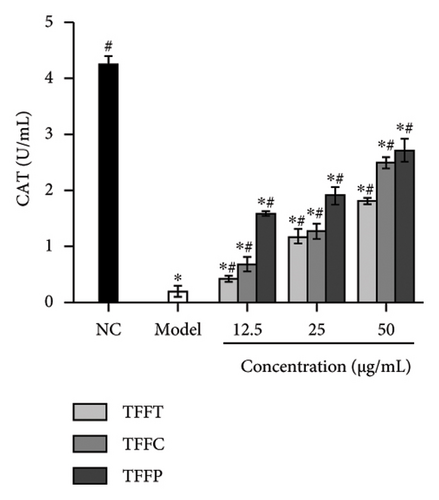
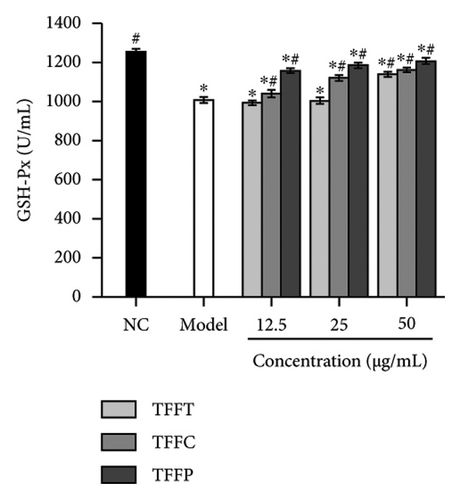
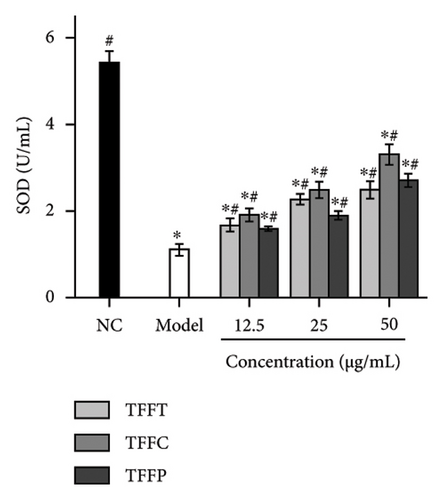
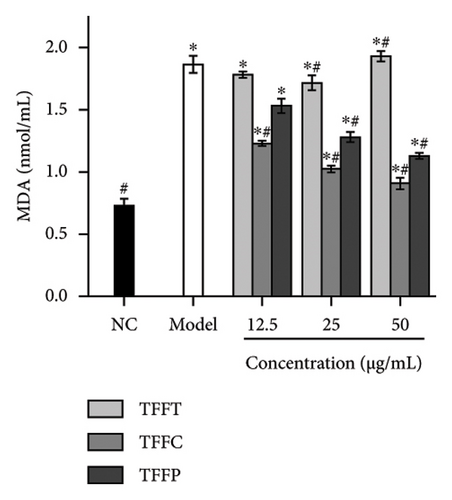
The antioxidant system is responsible for maintaining the homeostatic balance of intracellular redox levels. To further investigate the protective effects of TFFs on UVB-induced oxidative stress in HaCaT cells, the activities of CAT, SOD, GSH-Px, and MDA were analyzed. The CAT concentration of HaCaT cells in the model group was 0.18 U/mL, which was significantly lower than that of the control group (4.24 U/mL) (Figure 3(g)). The TFFs in each sample increase the level of CAT enzyme in HaCaT cells, including TFFP with the strongest protection and TFFT playing the least role. Figure 3(h) illustrates that TFFP had the strongest ability to improve the GSH-Px level in HaCaT cells, whereas TFFC and TFFT could both considerably increase the GSH-Px level in HaCaT cells at concentrations of 25 μg/mL and 50 μg/mL, respectively. SOD activity was most strongly influenced by TFFC, although SOD levels were also markedly raised by TFFT and TFFP (Figure 3(i)). In UVB-damaged HaCaT cells, TFFT was unable to suppress MDA formation, while TFFC had a more potent inhibitory effect on MDA than TFFP (Figure 3(j)).
3.5. Effect of TFFs on TNF-α and MMP-1 Level in UV-Damaged HaCaT Cells
When UV irradiation of HaCaT cells occurred, the creation of ROS was tightly correlated with the activation of TNF-α and MMP-1 expression [23]. Based on the previous experimental findings, TFFs may have an anti-UVB damage impact by inhibiting the generation of ROS in UV-damaged HaCaT cells, boosting the activity of antioxidant enzymes like SOD, and lowering MDA peroxide formation.
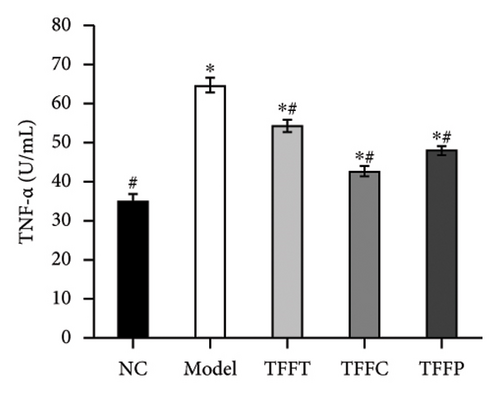
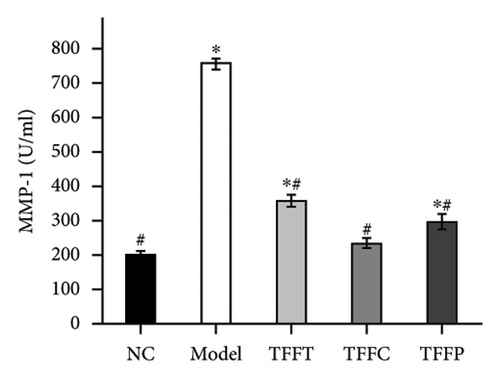
We explored the effect of 50 μg/mL TFFT, TFFC, and TFFP on TNF-α and MMP-1 levels in UV-damaged HaCaT cells. Figure 3(k) demonstrates that TFFC most strongly suppressed TNF-α production, with its release being only 7.74 U/mL greater than that of the control group. Figure 3(l) demonstrates that TFFC had the most pronounced downregulation effect on MMP-1. After being treated with TFFC, the MMP-1 content in HaCaT cells dropped to 231.4 U/mL, and just 30.57% of the content in the model group. As a result, HaCaT cells′ capacity to suppress TNF-α and MMP-1 production was graded as follows: TFFC > TFFP > TFFT.
3.6. Effects of TFFs on the Antistress Ability of C. elegans
The survival rates of C. elegans treated with different concentrations of TFFs for 48 h were almost unaffected (Figure 4(a)), and the survival rates were all above 90%, indicating that TFFs had no toxic effect on C. elegans in the concentration range of 50–200 μg/mL, with 200 μg/mL being the highest experimental concentration of TFFT, TFFC, and TFFP.
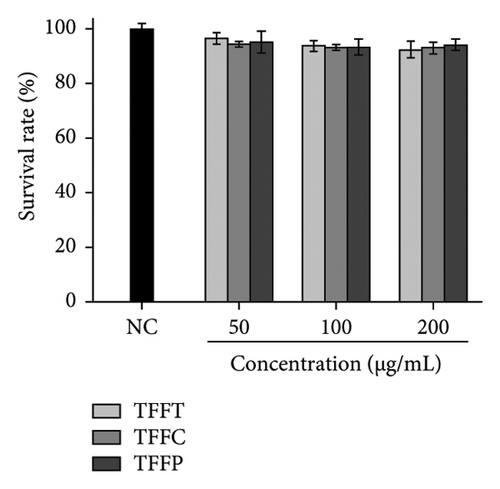
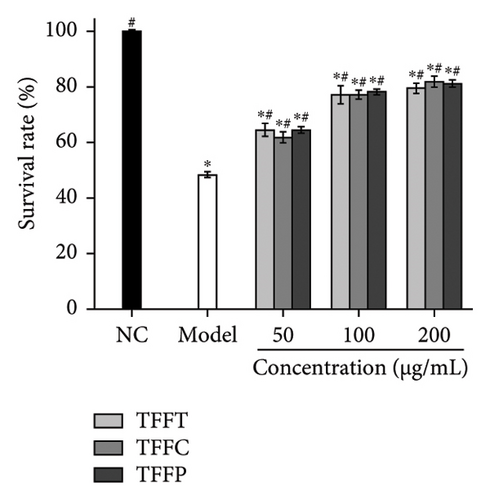
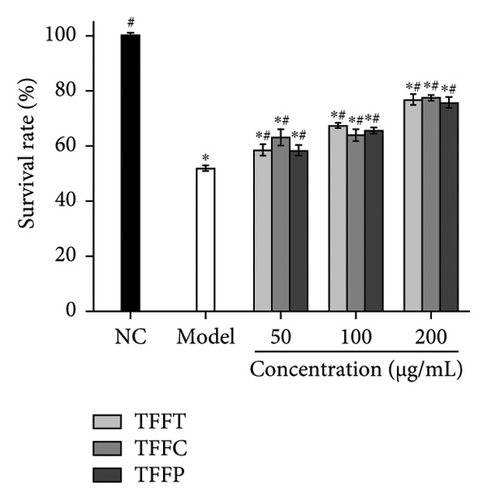

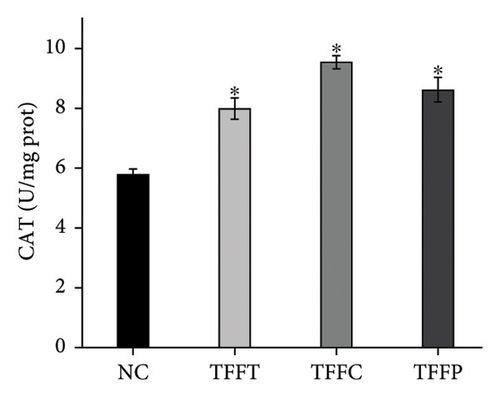
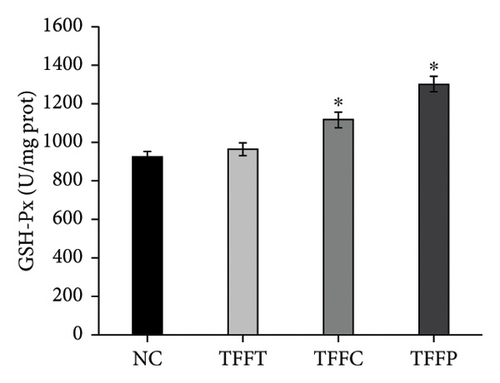
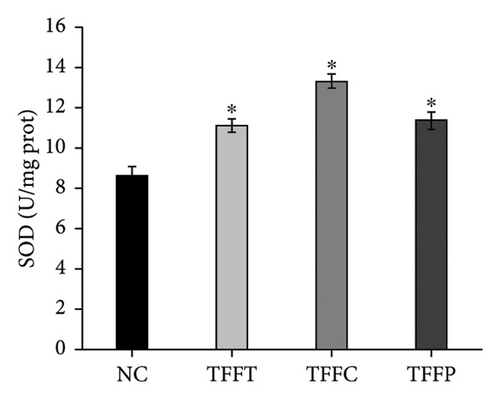
Figure 4(b) demonstrates the findings of the influence of TFFs on the capacity of C. elegans to tolerate heat stress after 5 h at 35°C. When compared to the control group, the model group’s C. elegans survival rate was 48.4%, which was considerably lower than the control group (p < 0.05), demonstrating that the model was established successfully. The findings revealed that, as compared to the model group, each experimental group improved C. elegans survival rates. The higher the concentration of flavonoids, the greater the C. elegans survival rate. In the paraquat-induced C. elegans oxidative damage model, all concentrations of TFFs significantly enhanced C. elegans survival (p < 0.05), and the survival rate of worms rose with concentration (Figure 4(c)). At a concentration of 200 μg/mL, the TFFs significantly increased C. elegans resistance to paraquat, increasing C. elegans survival rate by 48.31% (TFFT), 49.86% (TFFC), and 46.49% (TFFP), respectively, compared to the model group, but the protective effects of the three TFFs on oxidative stress C. elegans differed little.
3.7. Effects of TFFs on the Antioxidant System of C. elegans
In Figure 4(d), the ROS fluorescence intensity of the control group was significantly higher than that of the TFFs treatment groups, indicating that TFFs could effectively alleviate the accumulation of ROS in the body of C. elegans. Figures 4(e), 4(f), 4(g) depict the effects of TFFs on SOD, CAT, and GSH-Px in C. elegans. TFFs-treated groups considerably increased the vigor of SOD, CAT, and GSH-Px enzymes as compared to the control group. Among them, TFFC had the greatest effect on enhancing SOD and CAT enzyme activity, whereas TFFP had the greatest potential to enhance GSH-Px levels.
3.8. Effects of TFFs on the Antioxidant Genes of C. elegans
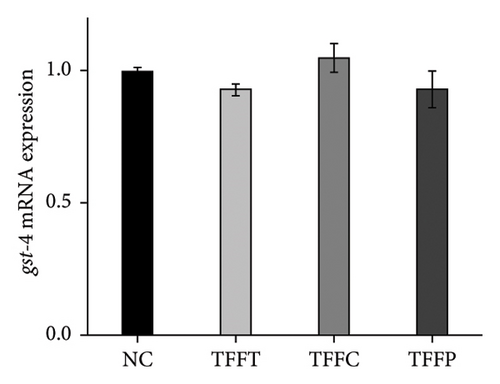
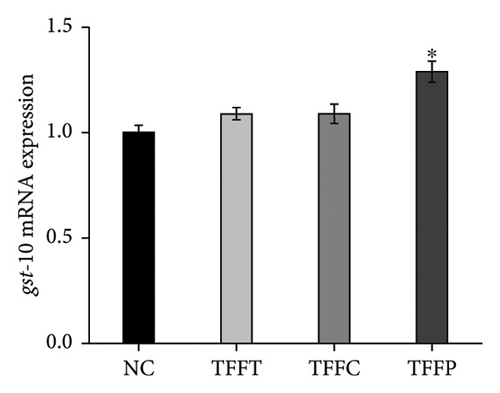
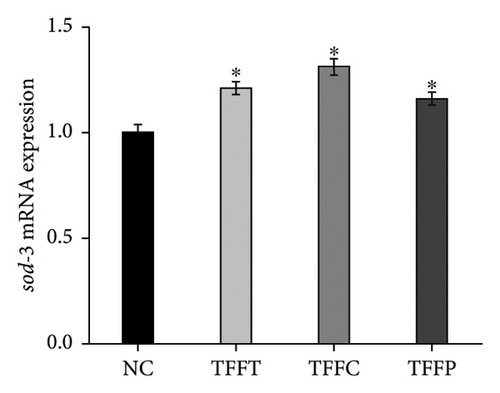
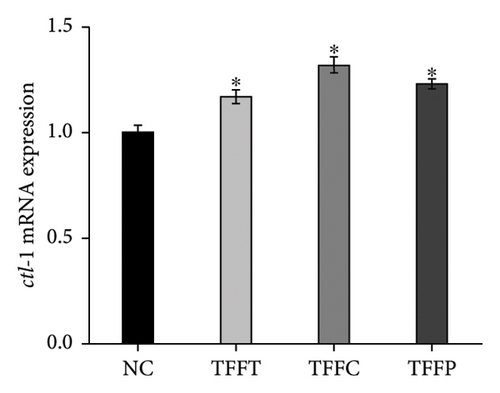
qRT-PCR was used to determine the effects of TFFs on the mRNA expression of gcs-1, gst-4, gst-10, sod-3, and ctl-1 (Figure 5). TFFs significantly raised the transcript levels of gst-10, sod-3, and ctl-1 in C. elegans. Only TFFP raised the expression of gst-10 substantially. TFFT and TFFC also had a tendency to influence the expression of gst-10; however, this was not statistically significant. When compared to the control group, all three flavonoid samples enhanced the expression of sod-3 and ctl-1 to varying degrees, but had no effect on the expression of gcs-1 and gst-4 genes.

4. Discussion
Many plant extracts have antioxidant properties and are effective sources of pharmaceuticals for the treatment of oxidative stress–related disorders, and TF is a traditional plant remedy in China. In this study, the antioxidative effects of TFFs against UVB-damaged HaCaT cells and C. elegans were investigated.
Firstly, TFFs were isolated and their components were identified by LC-MS/MS (Figure 1). Results showed that seven components were found in both TFFC and TFFP including: 2′,4,4′-trimethoxychalcone (1), 8-aldehyde-catechin (2), Amomutsaokin A (3), Amomutsaokin G (4), Tsaokoflavanol A (5), Tsaokoflavanol B (6), and Tsaokoflavanol F (7). In addition to these seven components, TFFC also contains catechin (8) and (2R,3R,4R)-3′,5′-dimethoxy-3,4,7,4′-tetrahydroxy-flavan (9). Previous reports showed that phenolic components, particularly flavonoids, contributed significantly to the antioxidant properties of the natural plants [31], and our findings confirm this opinion (Figure 2). Then, the antioxidant activities of TFFs in vitro were determined by DPPH, ABTS, FRAP, and total reducing power methods. These four antioxidant index assessment studies revealed that the antioxidant capacity was graded as TFFC > TFFP > TFFT, suggesting that most of the flavonoid active components were maintained following ethyl acetate extraction. Previous research has shown that purifying the total flavonoids by ethyl acetate extraction significantly increased the scavenging capacity of various free radicals [32, 33], implying that TFFs antioxidant active components could be better retained in ethyl acetate extract. However, although the content of some active substances was increased after further purification of TFFC, the antioxidant capacity of TFFP was not increased and instead decreased slightly, which could be due to the fact that while the content of some components was increased, some effective components were also lost. According to the LC-MS/MS statistics, (−)-catechins, (2R,3R,4R)-3′,5′-dimethoxy-3,4,7,4′-tetrahydroxy-flavan were found in TFFC while were not maintained in TFFP after purification of macroporous resin. Studies have shown that (−)-catechin is as active as an antioxidant as (+)-catechin, (−)-epicatechin, and quercetin, all known to be antioxidants [34], and the loss of (−)-catechins, (2R,3R,4R)-3′,5′-dimethoxy-3,4,7,4′-tetrahydroxy-flavan may be the reason causing the decreasing antioxidant capacity of TFFP.
UVB irradiation may raise oxidative stress in HaCaT cells by producing ROS and inducing oxidative damage by inhibiting the activity of antioxidant oxidases such as SOD, GSH-Px, CAT, and MDA. Thus, the use of antioxidants to neutralize the elevated ROS levels has been considered as a viable technique to prevent and lessen the negative effects of free radical generation following UVB irradiation of skin [35]. After treating UVB-damaged HaCaT cells with TFFs, the intracellular ROS level was dramatically lowered, with TFFC having the strongest inhibitory impact, and the ROS level was only 40.8% of that of the model group (Figures 3(e) and 3(f)). These findings show that TFFs may have a role in photoaging by counteracting the rise in ROS levels in UV-damaged HaCaT cells. CAT is an endogenous antioxidant enzyme involved in the catalytic conversion of H2O2 to oxygen and water and so reduces the degree of oxidative stress [36]. GSH-Px may increase the breakdown of H2O2 and convert hazardous peroxides to harmless hydroxyl molecules, therefore safeguarding the cellular membrane’s structure and function against oxide damage [37]. SOD effectively scavenges oxygen radicals, protects cells from oxidative damage, and eliminates oxidative stress induced by superoxide anion [38]. MDA is a key indicator of endogenous lipid peroxidation [39]. UVB-damaged cells had considerably higher levels of MDA. As shown in Figures 3(g), 3(h), 3(i), 3(j), TFFT, TFFC, and TFFP were able to raise the viability levels of the antioxidant enzymes CAT, GSH-Px, and SOD while inhibiting the generation of the peroxide MDA in UVB-damaged HaCaT cells within a certain dose range. Furthermore, TFFC was the most effective at boosting SOD levels and decreasing MDA content, whereas TFFP was the best at increasing CAT and GSH-Px levels. Also, study has shown that ROS increases MMP expression to alleviate early senescence in human dermal fibroblasts [40]. TNF-α is a cytokine found in the early stages of inflammation that triggers inflammation in keratinocytes and stimulates neighboring cells [41]. In this study, we found that TFFs could effectively promote the inhibition of MMP-1 and inflammatory factor TNF-α production (Figures 3(k) and 3(l)), which were strongly associated with ROS overproduction [42]. To take these results together, we found that TFFs improved UVB-damaged HaCaT cells by increasing antioxidant enzyme levels, inhibiting ROS and MDA production, and inhibiting MMP-1 and TNF-α production. TFFC provides a superior in vitro antioxidant action, indicating that the unique components in TFFC and the (2R,3R,4R)-3′,5′-dimethoxy-3,4,7,4′-tetrahydroxy-flavan and (−)-catechin may be the key.
The C. elegans offers promising possibilities for studying the mechanisms subjacent to the biological activity of natural compounds in an in vivo model [43], as there is a high degree of homology between C. elegans and human genes involved in processes like ageing, apoptosis, cell signaling, and metabolism [44]. ROS-mediated oxidative stress plays a vital role during the aging of C. elegans [45]. In this investigation, we firstly examined the changes in C. elegans stress resistance caused by TFFs and discovered that TFFs boosted C. elegans resistance to heat stress and oxidative stress (Figures 4(b) and 4(c)). Then, the antioxidant oxidase systems and ROS levels in C. elegans were tested. The results showed that TFFs effectively upregulate the activity of antioxidant enzymes such as CAT, GSH-Px, and SOD while also reducing ROS levels (Figures 4(d), 4(e), 4(f), 4(g)), which were consistent with previous results found in UVB-damaged HaCaT cells. The insulin/IGF-1 (IIS) signaling pathway is critical in the oxidative stress response of C. elegans [46, 47]. gst-10, sod-3, and ctl-1 were the main downstream genes of IIS signaling pathway, exhibiting the essential role of modulating antioxidant oxidases in C. elegans [48]. To determine whether the antioxidant activity of TFFs is related to the above mechanism of action, the effects on the mRNA expression of the downstream target genes of SKN-1 (gst-10, gcs-1, and gst-4), as well as the downstream target genes of DAF-16 (ctl-1 and sod-3), were detected using RT-qPCR (Figure 5). The transcript levels of gst-10 and sod-3, ctl-1 were significantly increased in C. elegans after TFFs. A similar study has demonstrated that genistein, a plant secondary metabolite flavonoid, may increase longevity and boost anti-heat and antioxidant capabilities in C. elegans by activating sod-3 and ctl-1 via the IIS pathway [49]. Overall, we can conclude that TFFs can improve the C. elegans’s antioxidant system capacity by activating the antioxidant oxidase system, thereby raising the C. elegans’s stress resistance.
5. Conclusion
In conclusion, a comparison of TFFT, TFFC, and TFFP revealed that TFFC and TFFP generally exhibited higher activity. However, TFFT may be less effective due to the low content of each active ingredient. In addition, it was found that TFFs possess a great antioxidant capacity in UVB-damaged HaCaT cells and C. elegans through upmodulating the antioxidant oxidase system. This outcome directly addresses the potential of TFFs as promising antioxidants for preventing UVB-induced cellular damage. Given the increasing concern about the harmful effects of UVB radiation on cells and tissues, TFFs could potentially be developed into therapeutic agents or functional ingredients in skincare products to combat oxidative stress caused by UVB exposure. However, studies on structure–activity relationship of TFFs are needed for further detection.
Nomenclature
-
- ABTS
-
- 2,2′-azino-bis(3ethylbenzothiazoline-6-sulfonic acid)
-
- A. tsaoko
-
- Amomum tsaoko Crevost et Lemarie
-
- CAT
-
- Catalase
-
- DMEM
-
- Dulbecco’s modified Eagle’s medium
-
- DPPH
-
- 2,2-diphenyl-1-picrylhydrazyl
-
- FBS
-
- Fetal bovine serum
-
- FRAP
-
- Ferric ion reducing antioxidant power
-
- GSH-Px
-
- Glutathione peroxidase
-
- HaCaT
-
- Human epidermal keratinocyte line
-
- MDA
-
- Malondialdehyde
-
- MMP-1
-
- Human matrix metalloproteinase 1
-
- MTT
-
- 3-(4,5-Dimethyl-2-thiazolyl)-2,5-diphenyl-2Htetrazolium bromide
-
- ROS
-
- Reactive oxygen species
-
- SOD
-
- Superoxide dismutase
-
- TNF-α
-
- Tumor necrosis factor-α
-
- TF
-
- Tsaoko Fructus
-
- TFFs
-
- Tsaoko Fructus flavonoids
-
- TFFC
-
- Tsaoko Fructus crude flavonoids
-
- TFFP
-
- Purified Tsaoko Fructus flavonoids
-
- TFFT
-
- Tsaoko Fructus alcohol extracts
-
- VC
-
- Vitamin C
Conflicts of Interest
The authors declare no conflicts of interest.
Author Contributions
Rui-Fang Zhong: formal analysis, methodology, visualization, validation, writing – original draft, and review and editing. Xiao-Mei Zhan: methodology, formal analysis, visualization, and writing – original draft. Si-Wen Qin: methodology and visualization. Wei Zhu: project administration. Jian-Guo Jiang: project administration, methodology, and conceptualization. Rui-Fang Zhong and Xiao-Mei Zhan contributed to the work equally and are co-first authors.
Funding
This project was supported by the National Natural Science Foundation of China (31871778, 31801468, 32072201, and 82374239), Foshan Social Field Technology R&D Special Program (2120001008478), Science and Technology Program of Guangzhou, China (202201011762), and State Key Laboratory of Dampness Syndrome of Chinese Medicine, The Second Affiliated Hospital of Guangzhou University of Chinese Medicine (SZ2024KF05).
Acknowledgments
The authors acknowledge the editor and the reviewers for their time and effort invested in helping them refine the manuscript.
Supporting Information
Table S1: Primer sequences used in RT-qPCR analysis.
Figure S1: The First-level Mass Spectrometry (MS1) of (−)-catechin.
Figure S2: The Second-level Mass Spectrometry (MS2) of (−)-catechin.
Figure S3: The First-level Mass Spectrometry (MS1) of (2R,3R,4R)-3′,5′-dimethoxy-3,4,7,4′-tetrahydroxy-flavan.
Figure S4: The Second-level Mass Spectrometry (MS2) of (2R,3R,4R)-3′,5′-dimethoxy-3,4,7,4′-tetrahydroxy-flavan.
Figure S5: The First-level Mass Spectrometry (MS1) of 2′,4,4′-trimethoxychalcone.
Figure S6: The Second-level Mass Spectrometry (MS2) of 2′,4,4′-trimethoxychalcone.
Figure S7: The First-level Mass Spectrometry (MS1) of 8-aldehyde-catechin.
Figure S8: The Second-level Mass Spectrometry (MS2) of 8-aldehyde-catechin.
Figure S9: The First-level Mass Spectrometry (MS1) of Amomutsaokin A.
Figure S10: The Second-level Mass Spectrometry (MS2) of Amomutsaokin A.
Figure S11: The First-level Mass Spectrometry (MS1) of Amomutsaokin G.
Figure S12: The Second-level Mass Spectrometry (MS2) of Amomutsaokin G.
Figure S13: The First-level Mass Spectrometry (MS1) of Tsaokoflavanol A.
Figure S14: The Second-level Mass Spectrometry (MS2) of Tsaokoflavanol A.
Figure S15: The First-level Mass Spectrometry (MS1) of Tsaokoflavanol B.
Figure S16: The Second-level Mass Spectrometry (MS2) of Tsaokoflavanol B.
Figure S17: The First-level Mass Spectrometry (MS1) of Tsaokoflavanol F.
Figure S18: The Second-level Mass Spectrometry (MS2) of Tsaokoflavanol F.
Open Research
Data Availability Statement
The data that support the findings of this study are available from the corresponding authors upon reasonable request.


