Lipidomics and GC-MS Analysis of Key Lipids Involved in Forming Volatile Flavor Compounds in Longissimus Dorsi Muscles of Sheep
Abstract
The flavor of meat significantly influences consumers’ purchasing decisions, with lipids playing a crucial role as precursors in the formation of volatile flavors. In this study, we analyzed the lipids and volatile flavor substances in the longissimus dorsi muscles of Chaka (CK), Black Tibetan (BT), and Oula (OL) sheep by liquid chromatography–electrospray ionization mass spectrometry (LC-ESI-MS/MS) and gas chromatography-mass spectrometry (GC-MS) techniques. The results showed that the phospholipids PI (13:1_18:1), PI (16:0_16:0), PI (18:0_18:2), PE (18:0_18:3), PE (18:0_20:5), PE (18:1_18:3), PC (13:0_18:0), PC (14:0_18:2), PC (14:0_18:3), and PC (15:0_16:0) were related to the formation of the flavor substances (1.alpha.,4a.beta.,8a.alpha.)-1,2,3,4,4a,5,6,8a-octahydro-7-methyl-4-methylene-1-(1-methylethyl)-Naphthalene and.gamma.-Muurolene imparted spicy, herbal and woody sensory properties. The triglycerides TG (10:0_16:0_18:2), TG (12:0_16:0_18:2) and TG (12:0_16:1_18:2) were associated with the formation of acetic acid, 2-phenylethyl ester and benzenepropanoic acid, methyl ester, which gave the sheep floral, fruity, honey, balsamic, wine, rose and tropical sensory properties. The lipids Carnitine C10:0, Cer (d16:1/24:1), Cer (d18:1/22:1), Cer (d18:1/23:1), and PE (17:0–22:5) were connected to the formation of propylcyclohexane, which provided sheep with sweet, cooked, buttery and meaty sensory characteristics. This study offers insights into the mechanisms of flavor formation in sheep and lays a scientific foundation for the future evaluation and improvement of flavor in different sheep breeds.
1. Introduction
Mutton plays an essential role in the human diet, as a rich source of protein, lipids, and other nutrients [1]. Flavor often affects the consumer’s buying decision and is a key factor in determining meat quality [2]. Lipids serve as important precursors of flavor compounds in lamb and are closely related to lamb quality [3], contributing to sensory characteristics such as mouthfeel and juiciness [4]. Lipids are broken down into free fatty acids that oxidize or interact with other components to form flavor compounds, including aldehydes, ketones, alcohols, and esters [5]. Guo et al. showed that intramuscular fat (IMF) content and lipid type are closely related to lamb flavor, and that neutral lipids and phospholipids are two key lipids that affect lamb flavor [6, 7]. Studies have shown that the content and type of lipid molecules are usually influenced by intrinsic factors such as the breed of animal, the feeding practices, and the meat processing methods [8]. Breed is one of the main factors affecting meat quality and flavor [9].
The lipidomics technique has developed into an important method for elucidating lipid composition [10]. Several researchers demonstrated that lipidomics analysis is a promising method to detect dominant lipids and candidate biomarkers in meat through ultra-performance liquid chromatography–mass spectrometry (UPLC-MS/MS) or high-performance liquid chromatography–electrospray ionization mass spectrometry (HPLC-ESI-MS/MS), such as beef [11], chicken [12], and tuna [13]. Gas chromatography–mass spectrometry (GC-MS) is a leading analytical technique for analyzing low–molecular weight compounds in food products [14]. Volatiles are broken down into characteristic fragments that are compared to the MS reference spectrum database. High-resolution mass spectrometry is used to further validate the precise masses of flavoring ingredients [15]. Multiple metabolomic approaches, particularly gas and liquid chromatography combined with mass spectrometry–based techniques, have been applied to identify candidate markers in food products [16]. Zhou et al. analyzed the changes in the lipid and volatile compositions of crayfish meat under different heat treatments using ultraperformance liquid chromatography coupled with time-of-flight mass spectrometry (UPLC-Q-TOF-MS/MS) and GC-MS [17]. Wang et al. used these two techniques to study the effect of different feeding regimens on candidate flavor compounds in lamb [18].
The Qinghai–Tibet Plateau is an important base of grassland animal husbandry in China and a major exporter of meat products [19, 20]. Among them, Black Tibetan (BT) sheep, Chaka (CK) semifine wool sheep, and Oula (OL) sheep are important sheep breeds [21–23]. As endemic livestock of the Tibetan Plateau, these breeds exhibit strong physiological adaptability to the harsh alpine environment and serve as vital economic resources for local herders [24, 25]. Although numerous studies have focused on evaluating the nutritional quality of these breeds, the research on their flavor profiles is limited. Flavor is a crucial indicator of meat quality and significantly influences consumer purchasing decisions. However, there is a lack of systematic research on the flavor of CK, BT, and OL sheep, and it remains unclear whether the lipid profiles and flavor components of these three breeds differ from one another.
Therefore, our study was conducted to compare and analyze the lipid composition and differences of the CK, BT, and OL sheep by LC-ESI-MS/MS, to clarify the constituents and differences of their flavor substances using GC-MS, and to explore the lipid molecules affecting the flavor of mutton using the correlation analysis. The results of this study are complementary to the evaluation of sheep quality and provide scientific and meaningful data support for the promotion and publicity of local specialty sheep varieties, which are conducive to the development of the livestock and sheep industry in the Tibetan Plateau region.
2. Materials and Methods
2.1. Animals and Samples’ Collection
The 5-month-old experimental animals were grazed in a highly saline environment for 6 months (Chaka Town, Wulan County, Haixi Mongol and Tibetan Autonomous Prefecture, Qinghai Province, China). The experimental animals were allowed to drink water freely from 8:00 a.m. to 6:00 p.m. The pasture’s species composition included Potentilla multicaulis Bunge, Chrysanthemum morifolium Ramat, Carex capillifolia (Decne.), Poa crymophila Keng, Oxytropis caerulea (Pallas) Candolle, Achnatherum splendens (Trin.) Nevski, Allium mongolicum Regel, Kalidium foliatum (Pall.) Moq., and Stipa capillata L. Nutrient composition of pasture grass is presented in Supporting Table S1. Slaughter was performed at an upland farm (a commercial breeding farm with an exclusive slaughter and sampling room) by trained personnel using special butcher knives. The experimental sheep were slaughtered by the decapitation-bleeding method. Longissimus dorsi muscle samples (muscles from the sheep’s back between the ninth and 11th ribs) were collected from CK, BT, and OL sheep. The samples were cut and placed in lyophilized containers and immediately stored in liquid nitrogen for analysis. Six replicates were used for the determination of lipids and volatile flavor compounds.
2.2. Determination of IMF Content
IMF content of the samples was determined using the Soxhlet method as described by Demirel et al. [26].
2.3. Lipidomic Analysis
The samples were thawed, 50 μL of pure methanol was added, and the mixture was vortexed thoroughly before being centrifuged at 12,000 rpm and 4°C for 30 s. Subsequently, 1 mL of extraction solvent (MTBE = 3:1, v/v) was added. After rotating for 15 min, 200 μL of water was added. The upper 200 μL layer was collected and concentrated by vacuum evaporation. The resulting dry extract was dissolved in 200 μL of a recombinant solution (CAN = 1:1, v/v) and analyzed by LC-MS/MS.
An LC-ESI-MS/MS system (UPLC, ExionLC AD; MS, QTRAP 6500+ system) was used to analyze the sample extracts. The analytical conditions were as follows: Solvent System A: acetonitrile/water (60/40 v/v) with 0.1% formic acid and 10 mmol/L ammonium formate, and Solvent System B: acetonitrile/isopropanol (10/90 v/v) with 0.1% formic acid and 10 mmol/L ammonium formate. The gradient program was as follows: A/B (80:20, v/v) at 0 min, 70:30 v/v at 2 min, 40:60 v/v at 4 min, 15:85 v/v at 9 min, 10:90 v/v at 14 min, and 5:95 v/v at 15 min. The flow rate was 35 mL/min, the temperature was set at 45°C, and the injection volume was 2 μL.
Linear ion trap (LIT) and triple quadrupole (QQQ) scans were detected on a QTRAPLC-MS/MS system with a QTRAP LIT with ESI source parameters as follows: ion spray (IS), 5500 V (positive ion), −4500 V (negative ion); ion spray Gas1 (GS1), Gas2 (GS2), and curtain gas, (CUR) set to 45, 55, and 35 psi, respectively, and collision gas, (CAD) set to mean. For the instrument adjustment and mass calibration, 10 and 100 μmol/L polypropylene glycol solutions were applied in QQQ and LIT modes, individually. QQQ scans with collision gas (nitrogen) set at five psi were performed as MRM experiments. A specific set of transitions was observed based on the metabolites eluted during each period.
2.4. Aroma Compound Analysis
0.2 g of the sample was weighed and immediately transferred to 20 mL headspace vials (Agilent, Palo Alto, CA, USA) with 0.2 g of sodium chloride powder to prevent enzyme activity. For the SPME analysis, each vial was left at 60°C for 5 min and then exposed to a 120-μm DVB/CWR/PDMS fiber (Agilent) for 15 min at 60°C.
After collection, the volatile organic compound (VOC) in the fiber coatings was desorbed at the inlet of a gas chromatograph (Model 8890; Agilent) in the splitless mode at 250°C for 5 min. An Agilent 8890 gas chromatograph and a 7000D mass spectrometer (Agilent) equipped with a 30 m × 0.25 mm × 0.25 μm DB-5MS (5% phenyl-polymethylsiloxane) capillary column were used to identify and quantify the VOCs. The carrier gas used was helium at a linear flow rate of 1.2 mL/min. The injection temperature was kept at 250°C. The furnace temperature was started at 40°C (3.5 min) and heated to 100°C (10°C/min), 180°C (7°C/min), and 280°C (25°C/min) for 5 min. The 70-eV electron impact (EI) ionization mode was used to record the mass spectra. The quadrupole mass detector, ion source, and transfer line temperatures were set at 150, 230, and 280°C. Mass spectrometry was performed in the selected ion monitoring (SIM) mode to identify and quantify the analytes.
Qualitative Analysis of Volatile Compounds: Based on multispecies, literature, some samples, and retention indices, a database was established containing identified retention time (RT) and qualitative quantitative ions for a selective ion detection mode for accurate scanning, one quantitative ion and two to three qualitative ions were selected for each compound. All ions to be detected in each group were detected separately in time periods according to the order of the peaks. If the RT of the detected ions was consistent with the standard reference and the selected ions appeared in the mass spectra of the samples after subtraction of the background, the detected compound was judged to be the substance, and the quantitative ions were selected to perform the integration and calibration work, which improved the accuracy of quantification.
2.5. Statistics Analysis
Statistical analyses were performed using SPSS software version 17.0. One-way analysis of variance (ANOVA) was used to analyze the relative abundance of lipids and volatile flavors. The analysis of the OPLS-DA model was performed using the OPLSR anal function of the MetaboAnalystR package in the R software. VIP > 1 and p value < 0.05 (ANOVA) were used as screening criteria for differential lipids and metabolite. Multiple means were compared using Duncan’s test. Pearson’s correlation analysis was used to correlate the major lipid and volatile flavor compounds. Cystoscope v3.10.2 software was used for the network analysis.
3. Results
3.1. Determination of IMF Content in Three Varieties of Mutton
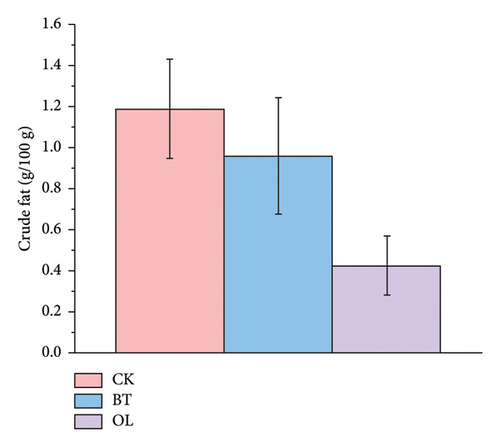
We compared the crude fat content in CK, BT, and OL sheep, with the results presented in Figure 1. The crude fat content was 1.188 g/100 g in CK, 0.959 g/100 g in BT, and 0.427 g/100 g in OL, and there were no significant differences between the three comparison groups (p > 0.05).
3.2. Analysis of the Lipid Composition of Three Breeds of Lamb
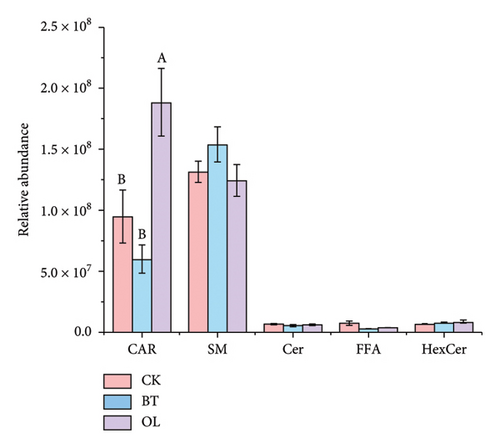
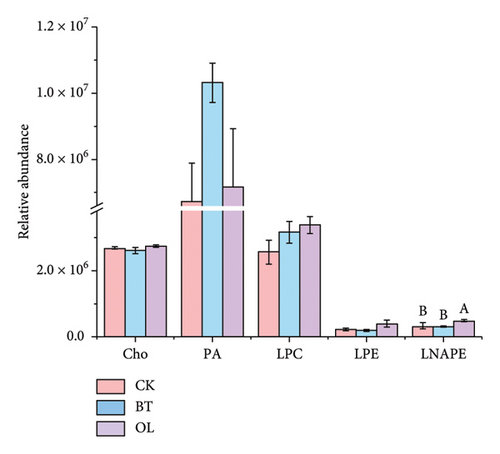
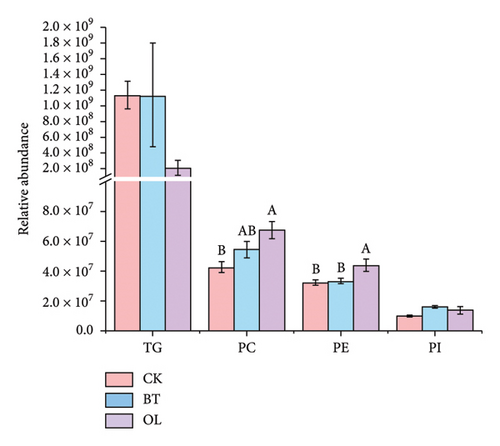
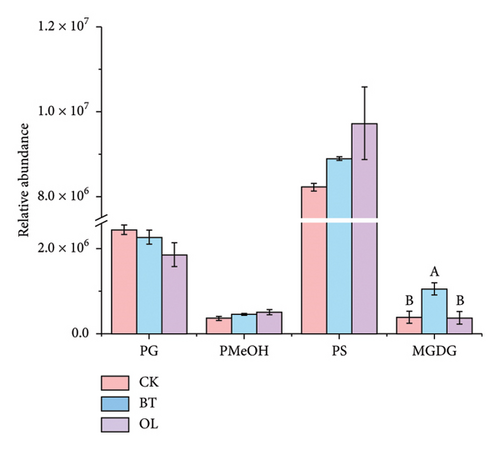
The composition of lipid molecules in the three comparison groups is shown in Figure 2, where a total of five major classes and 18 subclasses of lipid molecules were detected. Notably, the levels of acylcarnitine (CAR), N-acyl-lysophosphatidylethanolamine (LNAPE), phosphatidylcholine (PC), phosphatidylethanolamine (PE), and monosaccharide diglycerides (MGDG) varied significantly among the groups. Specifically, CAR, LNAPE, PC, and PE levels were higher in OL compared to CK and BT (p < 0.05), while MGDG levels were significantly higher in BT than in CK and OL (p < 0.05).
We validated the model using OPLS-DA and evaluated the prediction parameters of the model, respectively: R2X, R2Y, and Q2. The corresponding R2Y parameters of the OPLS-DA models in BT vs. OL (Figure 3(a)), CK vs. BT (Figure 3(b)), and CK vs. OL (Figure 3(c)) were 0.989, 0.993, and 0.993, respectively. These three parameters were close to one, and the parameter Q2 was greater than 0.5 in all three comparison groups, which indicates that the model was stable and reliable and can be applied to determine the differences between the three groups.
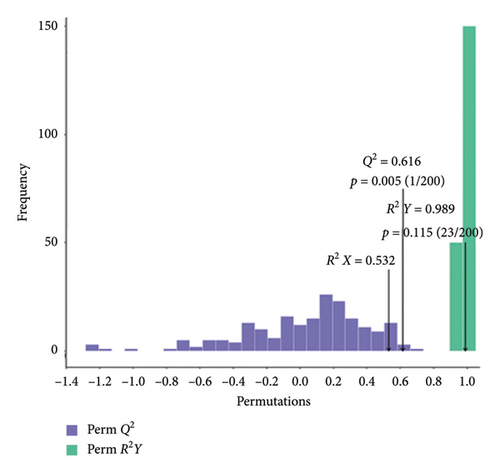
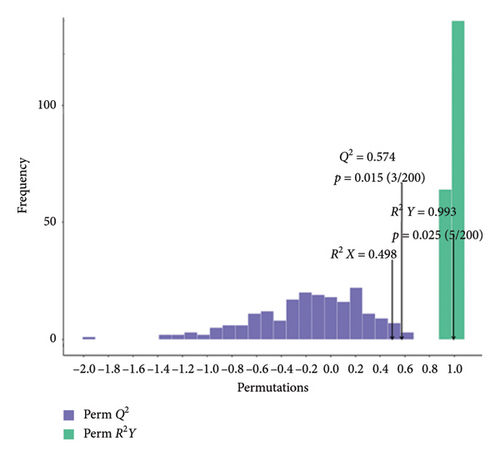
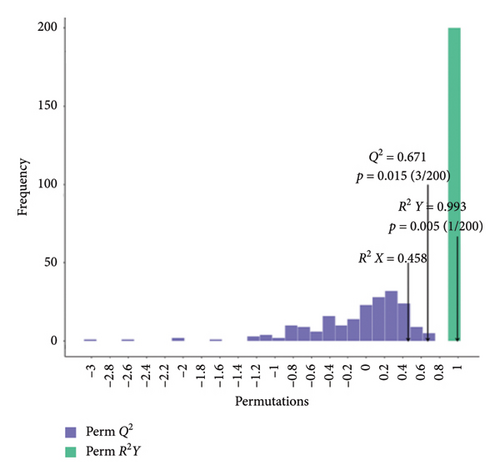
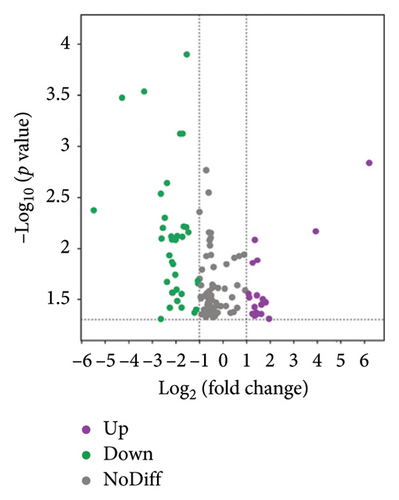
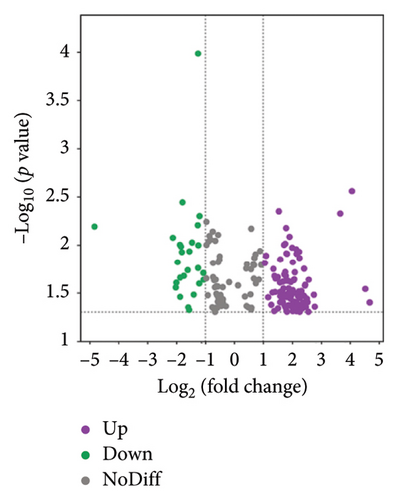
The volcano plots revealed 68 biomarkers identified in the BT vs. CK comparison (Figure 4(a)), with 20 lipids upregulated and 48 downregulated. In the comparison between the BT and OL groups (Figure 4(b)), 121 lipids were detected, including 31 upregulated and 90 downregulated. For the CK vs. OL comparison, 191 lipids were identified, with 123 upregulated and 68 downregulated (Figure 4(c)). The top 10 upregulated and downregulated lipids for BT vs. OL, CK vs. BT, and CK vs. OL are listed in Table S3.

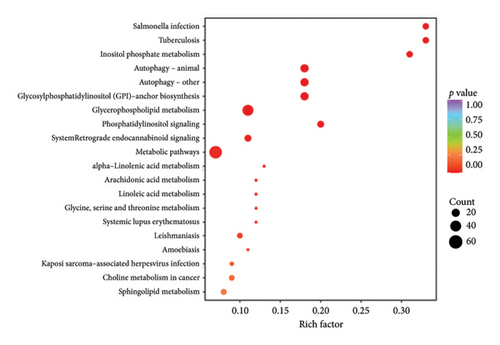
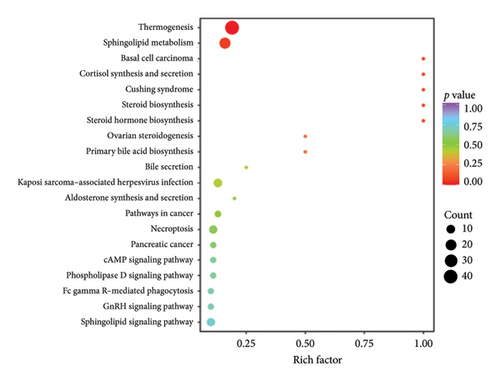
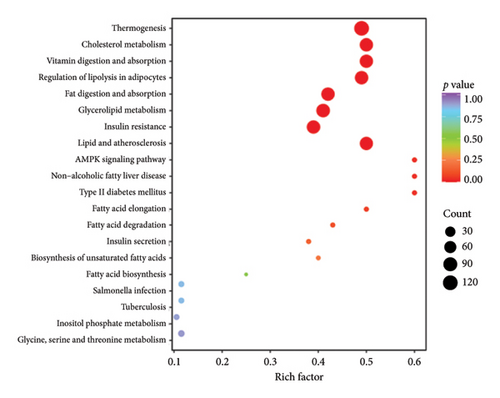
The top 20 pathways in different comparison groups were revealed by the KEGG pathway enrichment analysis (Figure 5). The major enriched pathway in the BT and OL groups was the sphingolipid metabolism pathway (Table S4). The lipids in CK vs. BT were mostly enriched in the pathways of the metabolic pathways, glycerophospholipid metabolism, glycosylphosphatidylinositol (GPI)-anchor biosynthesis, inositol phosphate metabolism, and phosphatidylinositol signaling system. The lipids in CK vs. OL were primarily enriched in the pathways of cholesterol metabolism, regulation of lipolysis in adipocytes, fat digestion and absorption, glycerolipid metabolism, and lipid and atherosclerosis.
3.3. Comparative Analysis of Flavor Substances in Three Varieties of Mutton
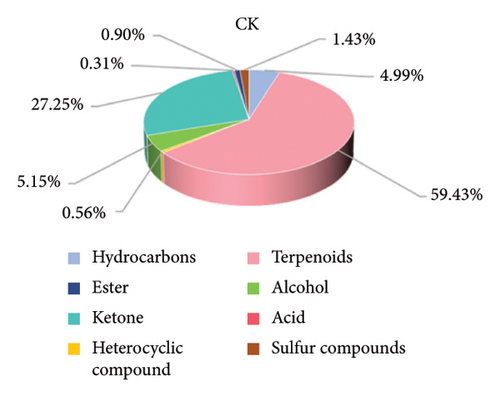
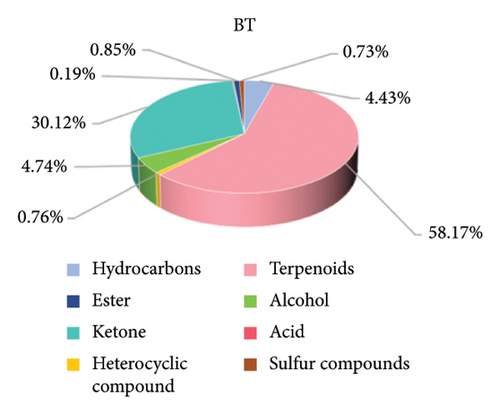
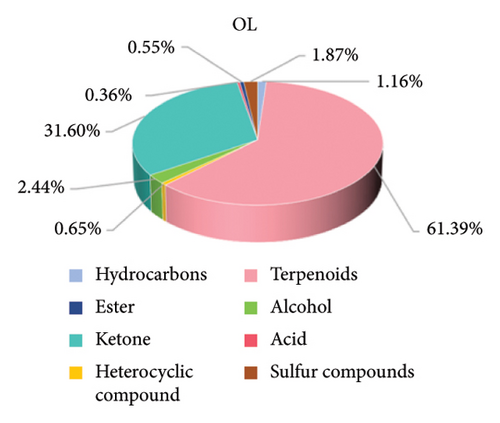
The composition of the volatile flavor compounds in the three comparison groups is shown in Figure 6 and Table S2, where the flavor compounds were mainly composed of hydrocarbons, terpenes, heterocyclic compounds, alcohols, ketones, acids, esters, and sulfur-containing compounds. Among these, terpenes, ketones, alcohols, and hydrocarbons were the major flavoring compounds. The levels of hydrocarbons, terpenoids, and ketones differed significantly among the comparison groups (p < 0.05). The proportions of hydrocarbons were in descending order: CK > BT > OL, and the terpenoids and ketones were in descending order: OL > BT > CK.
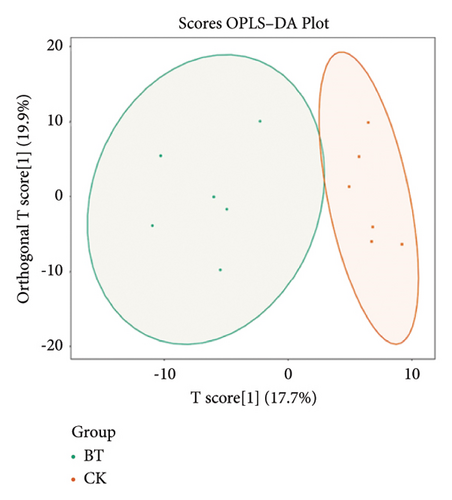
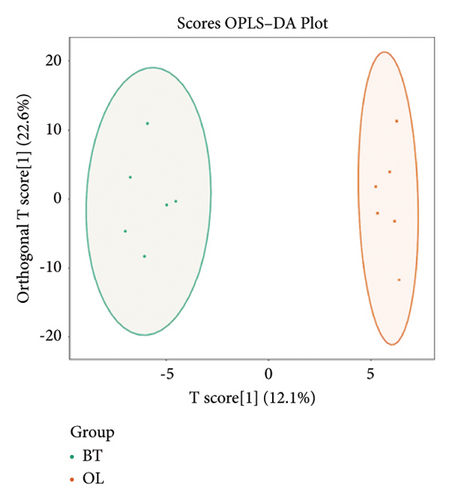
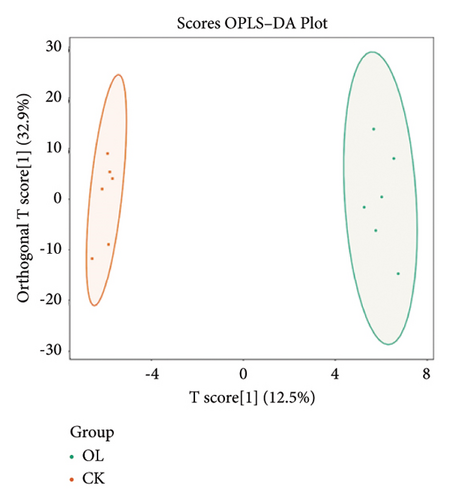
To further demonstrate the differences between the three groups, we analyzed the metabolomic data according to the OPLS-DA model and plotted the scores of CK vs. BT (Figure 7(a)), BT vs. OL (Figure 7(b)), and CK vs. OL (Figure 7(c)). The difference between the two comparison groups is clearly visible in the figure, which indicates that there is a significant difference between the two comparison groups.
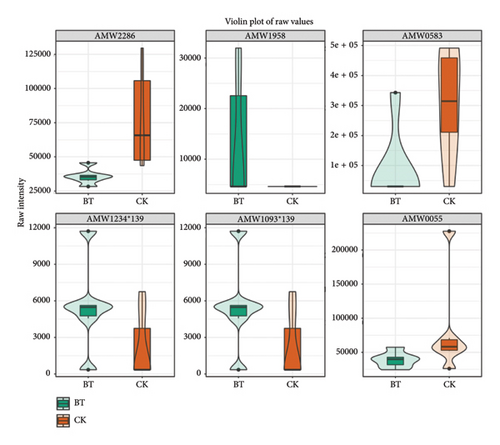
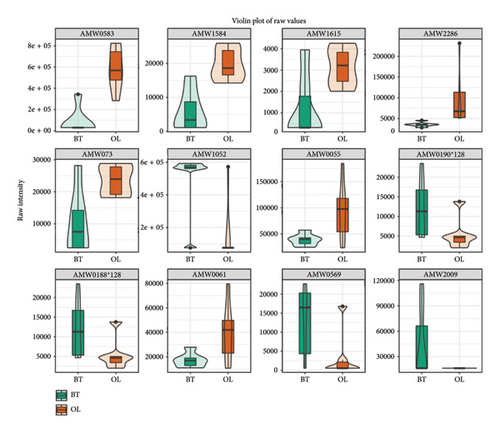
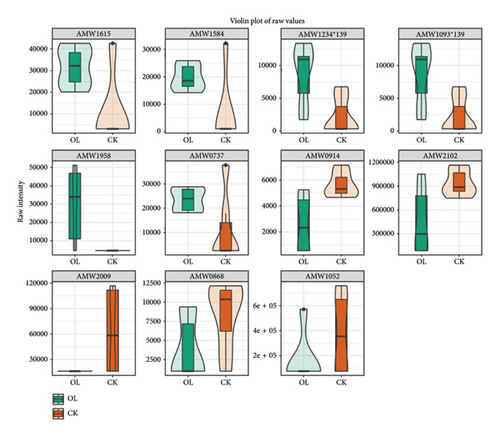
The violin diagrams showed seven volatile flavorants in the comparison between the CK group and the BT group (Figure 8(a)), among which 1-nitropyrazole, (1.alpha.,4a.beta.,8a.alpha.)-1,2,3,4,4a,5,6,8a-octahydro-7-methyl-4-methylene-1-(1-methylethyl)-naphthalene, and .gamma. Muurolene are upregulated compounds, and 4-methylene-1-(1-methylethyl)-cyclohexene, hexathiane, and sulfuric acid, 2-ethylhexyl isobutyl ester are downregulated compounds. Twelve biomarkers were identified in BT vs. OL (Figure 8(b)), of which 1-undecene, 9-methyl-, 5-fluoro-1,3-benzoxazol-2(3H)-one, acetic acid, 2-phenylethyl ester, benzenepropanoic acid, methyl ester, and decane, 2,4-dimethyl- were upregulated compounds, and (1-methylethylidene)-cyclohexane,4-octanone,4-methylene-1-(1-methylethyl)-cyclohexene, hexathiane, oxalic acid, 6-ethyloct-3-yl propyl ester, sulfurous acid, 2-ethylhexyl isobutyl ester and propyl-cyclohexane were downregulated. In OL vs. CK, we identified 11 volatile flavorants, of which (1-methylethylidene)-cyclohexane, (1.alpha.,4a.beta.,8a.alpha.)-1,2,3,4,4a,5,6,8a-octahydro-7-methyl-4-methylene-1-(1-methylethyl)-naphthalene.gamma.-Muurolene, 1-nitropyrazole, 4-octanone and propyl-cyclohexane as upexpressed compounds, and 1-undecene, 9-methyl-, 2-(hydroxymethyl)-2- methyl-1,3-propanediol, decane, 2,4-dimethyl-, heptane, 3,3,4-trimethyl-, and [1aR-(1a.alpha.,7.alpha.,7a.beta.,7b.alpha.)]-1a,2,3,5,6,7. 7a,7b-octahydro-1,1,4,7-tetramethyl-1H-cycloprop[e]azulene were downregulated (Figure 8(c)).
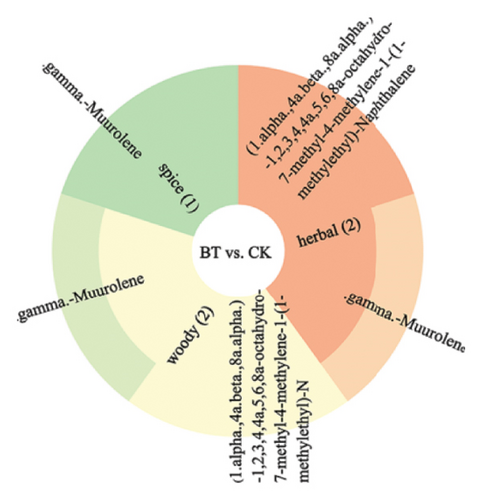
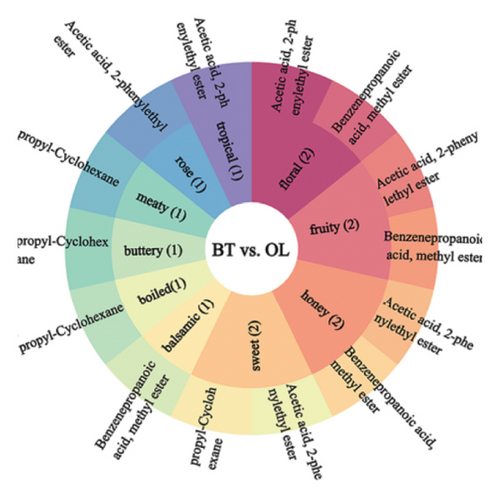
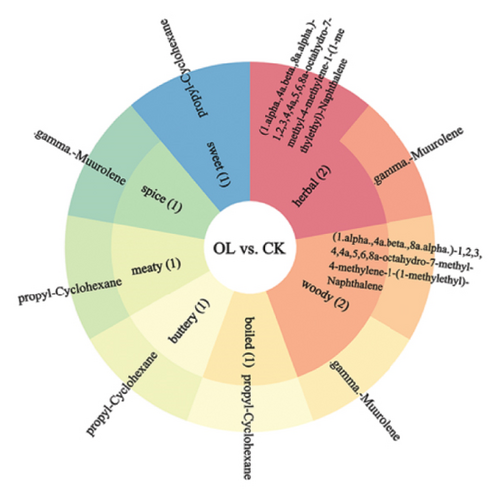
We annotated the significantly different metabolites to the sensory taste profiles in each comparison group, as illustrated in Figure 9. In BT vs. CK, the terpenoid.gamma.-muurolene was annotated as spice, herbal, and woody. The terpenoid (1.alpha.,4a.beta.,8a.alpha.)-1,2,3,4,4a,5,6,8a-octahydro-7-methyl-4-methylene-1-(1-methylethyl)-naphthalene was annotated to flavor profiles of herbal and woody. In comparison groups BT and OL, the ester acetic acid, 2-phenylethyl ester was annotated with the organoleptic flavor profiles floral, fruity, honey, sweet, rose, and tropical. The ester benzenepropanoic acid, methyl ester was annotated with the sensory flavor profiles floral, fruity, honey, balsamic, and wine. The sensory flavor profiles sweet, cooked, buttery, and meaty were annotated for the hydrocarbon compound propyl-cyclohexane. In the comparison groups of OL and CK, the terpenoid (1.alpha.,4a.beta.,8a.alpha.)-1,2,3,4,4a,5,6,8a-octahydro-7-methyl-4-methylene-1-(1-methylethyl)-naphthalene was annotated to the sensory odors herbal and woody. The sensory scents herbal, woody, and spicy were annotated with the terpene.gamma.muurolene. The hydrocarbon compound propyl-cyclohexane has been annotated with the sensory characteristics cooked, buttery, meaty, and sweet.
3.4. Correlation Between Flavor Compounds and Lipids
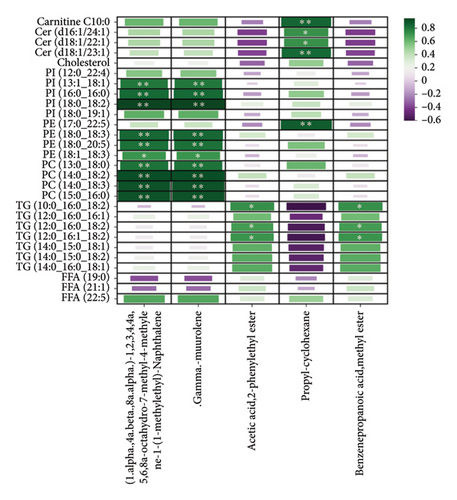
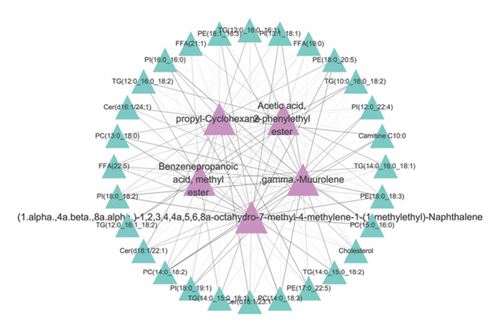
The correlation between key differential lipid molecules and volatile flavor compounds is illustrated in Figure 10. We found that the lipid molecules PI (13:1_18:1), PI (16:0_16:0), PI (18:0_18:2), PE (18:0_18:3), PE (18:0_20:5), PE (18:1_18:3), PC (13:0_18:0), PC (14:0_18:2), PC (14:0_18:3), and PC (15:0_16:0) with the flavor substances(1.alpha.,4a.beta.,8a.alpha.)-1,2,3,4,4a,5,6,8a-octahydro-7-methyl-4-methylene-1-(1-methylethyl)-naphthalene and .gamma.-muurolene showed a significant positive correlation. We identified significant positive associations between the lipid molecules TG (10:0_16:0_18:2), TG (12:0_16:0_18:2), and TG (12:0_16:1_18:2) and the flavorant acetic acid, 2-phenylethyl ester and benzenepropanoic acid, methyl ester. Significant positive associations were detected between the lipid components carnitine C10:0, Cer (d16:1/24:1), Cer (d18:1/22:1), Cer (d18:1/23:1), and PE (17:0_22:5) and the flavorant propyl-cyclohexane.
4. Discussion
4.1. Lipid Composition in Different Breeds of Sheep
Studies have demonstrated that lipid composition is associated with IMF deposition, and that changes in IMF content can alter phospholipids, triglycerides, and diglycerides in lamb and pork [27, 28]. In our study, while the IMF content did not differ significantly among CK, BT, and OL, notable differences were observed in lipid classes such as CAR, LNAPE, PC, PE, and MGDG. LNAPE, PC, and PE are glycerophospholipids, whereas MGDG is a glycerolipid. PE is one of the most abundant glycerophospholipids in the cell membranes of ruminant animals [29]. Glycerophospholipids are not only important nutrients but also major sources of flavor compounds [30]. Liu et al. have identified phospholipids, including PC and PE, as key contributors to flavor component generation [31]. Due to their higher content of unsaturated fatty acids such as FFA (C18:2) and FFA (C20:4), PC molecules are susceptible to oxidation to aldehydes [32]. Our findings align with these observations. Specifically, PE (18:0_18:3), PE (18:0_20:5), PE (18:1_18:3), PC (13:0_18:0), PC (14:0_18:2), PC (14:0_18:3), and PC (15:0_16:0) were identified as key phospholipid molecules associated with sheep flavor. In addition, our study revealed that lipid molecules were mainly enriched in sphingolipid metabolism, glycerophospholipid metabolism, GPI anchor biosynthesis, phosphatidylinositol signaling system, cholesterol metabolism, regulation of lipolysis in adipocytes, fat digestion and absorption, and glycerolipid metabolism. The glycerolipid, glycerophospholipid, and sphingolipid pathways have been identified as important pathways for the regulation of IMF and are characterized by the enrichment of significantly different lipids [33]. It has shown that the regulation of glycerophospholipid metabolism, glycerolipid metabolism, and ether lipid metabolism can significantly enhance the flavor of sheep [34]. Therefore, we hypothesized that these pathways may affect the flavor of lamb by influencing the synthesis and metabolism of some key lipids.
4.2. Composition of Flavor Compounds in Different Breeds of Sheep
Factors influencing meat flavor can be categorized into endogenous and exogenous factors. Endogenous factors typically include breed and genetics, while exogenous factors pertain to various postprocessing methods, such as cooking style [35]. Meat flavor compounds are mainly classified into water-soluble and lipid-derived types [36]. The research indicates that lipid degradation generally produces aldehydes, ketones, and alcohols, which contribute to the distinct flavors of meat from different animal species [37]. In our study, we compared volatile flavor compounds in three varieties of mutton, and the results showed that terpenoids, ketones, alcohols, and hydrocarbons were the major flavoring compounds. Among these, hydrocarbons, terpenoids, and ketones were significantly different among the three comparison groups (p < 0.05). The hydrocarbon content was highest in the CK group and the terpenoids and ketones were highest in the OL group. Ketones are oxidation products, and the formation of ketones occurs via ketoenol interconversion, hydroperoxide isomerization, unsaturated fatty acid peroxide degradation, and intramolecular electron translocation [38]. Hydrocarbons tend to have quite high thresholds, and they may contribute little to the overall flavor [39]. Terpenoids are primarily present in plants, but they can be absorbed into the flesh of animals by direct digestion [40]. Given that our experimental animals were primarily forage-fed, we hypothesized that the detected terpenoids originated from the forage plants. Our detailed analysis revealed that hydrocarbons such as 4-methylene-1-(1-methylethyl)-cyclohexene, 1-undecene,9-methyl-, decane,2,4-dimethyl-, heptane,3,3,4-trimethyl-, and terpenoids [1aR-(1a.alpha.,7.alpha.,7a.beta.,7b.alpha.)]-1a,2,3,5,6,7,7a,7b-octahydro-1,1,4,7-tetramethyl-1H-cycloprop[e]azulene were upregulated in the CK group. The hydrocarbons (1-methylethylidene)-cyclohexane, propyl-cyclohexane,4-methylene-1-(1-methylethyl)-cyclohexene, the ketone 4-octanone, the terpenoids (1.alpha. 4a.beta.,8a.alpha.)-1,2,3,4,4a,5,6,8a-octahydro-7-methyl-4-methylene-1-(1-methylethyl)-naphthalene.gamma.-muurolene were upregulated in the OL group. Thus, we propose that CK and OL sheep might exhibit a more complex flavor profile compared to BT sheep.
4.3. Correlation Analysis of Lipids With Flavor Compounds
Lipids play a crucial role in meat flavor production as solvents and precursors of flavor compounds. They undergo lipolysis and oxidation, which leads to the formation of flavor precursors [5]. Neutral lipids (triglycerides) and phospholipids play an essential part in the flavor retention of meat and the flavor retention of meat products [41]. The research indicates that the flavor of meat is related to the composition of phospholipids [42]. Wang Daoying et al. found that phospholipid is the main factor in the generation of duck flavor, which is also an important determinant of duck flavor [43]. PE and PC are capable of producing flavor compounds such as (E,E)-2,4-decadienal, 1-octen-3-one, and (E)-2-decene upon heating [44]. Zhou et al. showed that PC (18:0/18:2), a major PC molecule, oxidizes to (E)-2-heptenal, (E,E)-2,4-decadienal, and 2-pentylfuran. PE (18:0/18:2) is a major PE molecules, and 2-heptanone is the dominant volatile derived from it [45]. Our study revealed strong correlations between phospholipids PI (13:1_18:1), PI (16:0_16:0), PI (18:0_18:2), PE (18:0_18:3), PE (18:0_20:5), PE (18:1_18:3), PC (13:0_18:0), PC (14:0_18:2), PC (14:0_18:3), and PC (15:0_16:0) and the flavor substances (1.alpha.,4a.beta.,8a.alpha.)-1,2,3,4,4a,5,6,8a-octahydro-7-methyl-4-methylene-1-(1-methylethyl)-naphthalene and .gamma.-muurolene. Because phospholipids are rich in unsaturated fatty acids, they promote oxidative degradation of foods compared to other lipids, resulting in the production of volatile flavor compounds [46]. We speculate that the formation of (1.alpha.,4a.beta.,8a.alpha.)-1,2,3,4,4a,5,6,8a-octahydro-7-methyl-4-methylene-1-(1-methylethyl)-naphthalene and.gamma.-muurolene is associated with unsaturated fatty acids in PI, PE, and PC. Frank’s research found that TG had a significant effect on the volatile content and oral release of the major hydrophilic volatiles. The oxidized volatiles are significantly influenced by the fatty acid species in TG [47]. We identified significant positive associations between the TG (10:0_16:0_18:2), TG (12:0_16:0_18:2), and TG (12:0_16:1_18:2) and the flavorant acetic acid, 2-phenylethyl ester and benzenepropanoic acid, methyl ester. In addition, our study found positive correlations between carnitine C10:0, Cer(d16:1/24:1), Cer (d18:1/22:1), Cer (d18:1/23:1), and the flavorant propyl cyclohexane. Cer has shown to be involved in producing phosphoethanolamine, which is subsequently involved in the glycerophospholipid pathway [48]. Therefore, we hypothesized that Cer (d16:1/24:1), Cer (d18:1/22:1) and Cer (d18:1/23:1) may regulate the flavor of meat through the metabolism of glycerophospholipids.
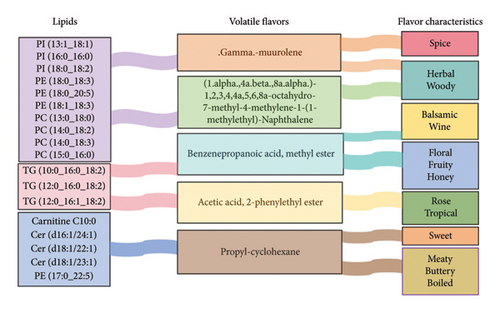
In this study, we developed hypotheses for sheep flavor formation by analyzing Pearson’s correlation between key lipids and flavor compounds, and by annotating these compounds with their sensory properties (Figure 11). The phospholipids PI (13:1_18:1), PI (16:0_16:0), PI (18:0_18:2), PE (18:0_18:3), PE (18:0_20:5), PE (18:1_18:3), PC (13:0_18:0), PC (14:0_18:2), PC (14:0_18:3), and PC (15:0_16:0) were related to the formation of the flavor substances (1.alpha.,4a.beta.,8a.alpha.)-1,2,3,4,4a,5,6,8a-octahydro-7-methyl-4-methylene-1-(1-methylethyl)-naphthalene and .gamma.-muurolene imparted spicy, herbal, and woody sensory properties to the sheep. The triglycerides TG (10:0_16:0_18:2), TG (12:0_16:0_18:2), and TG (12:0_16:1_18:2) were associated with the formation of acetic acid, 2-phenylethyl ester and benzenepropanoic acid, and methyl ester, which gave the sheep floral, fruity, honey, balsamic, wine, rose, and tropical sensory properties. The lipids Carnitine C10:0, Cer (d16:1/24:1), Cer (d18:1/22:1), Cer (d18:1/23:1), and PE (17:0–22:5) were linked to the formation of propylcyclohexane, which gave sheep sweet, boiled, buttery, and meaty sensory characteristics.
5. Conclusions
In conclusion, under identical feeding conditions, the CK, BT, and OL sheep exhibited variations in lipids and volatile flavor compounds. Notable differences were observed in the lipids CAR, LNAPE, PC, PE, and MGDG, as well as in the flavor substances hydrocarbons, terpenoids, and ketones among the three comparison groups. Lipids played a crucial role in the formation of volatile flavors, with phospholipids (PI, PE, and PC) being the primary contributors to flavor formation in sheep. In addition, triglycerides (TG), ceramides (Cer), and acylcarnitines (Carnitine C10:0) were also associated with flavor development. Our findings offer substantial scientific support for elucidating the mechanisms behind flavor substance formation in mutton. They also provide valuable insights for improving the flavor profiles of different mutton breeds, which could enhance the development of the mutton industry in the Qinghai–Tibetan Plateau.
Ethics Statement
The animal procedures used in this study were performed according to the Guidelines for the Care and Use of Laboratory Animals in China. This study was approved by the Experimental Animal Use Ethics Committee of the Northwest Institute of Plateau Biology, CAS (Permit No. NWIPB20160302).
Conflicts of Interest
The authors declare no conflicts of interest.
Author Contributions
Xianli Xu: conceptualization, data curation, formal analysis, writing – original draft. Tongqing Guo: data curation, formal analysis, and sample collection. Xungang Wang: data curation and formal analysis. Qian Zhang: data curation and formal analysis. Hongjin Liu: conceptualization and data analysis. Yuna Jia: sample collection and data curation. Yalin Wang: data curation and formal analysis. Lin Wei: data curation and formal analysis. Linyong Hu: conceptualization and writing – review and editing. Shixiao Xu: formal analysis, funding acquisition, and writing – review and editing.
Funding
This research was supported by the Basic Research Program of Qinghai Province (2022-ZJ-943Q), the Youth Innovation Promotion Association CAS, and the Integration and Demonstration of Key Technologies for Improving Quality and Efficiency of Albas Goats (2024ZY0114).
Acknowledgments
This research was supported by the Basic Research Program of Qinghai Province (2022-ZJ-943Q), the Youth Innovation Promotion Association CAS, and the Integration and Demonstration of Key Technologies for Improving Quality and Efficiency of Albas Goats (2024ZY0114).
Supporting Information
Supporting Table S1 is the determination of nutrients in pasture grasses (%, DM basis).
Supporting Table S2 is the proportion of volatile flavor substances in the longissimus dorsi muscle of three breeds of sheep.
Supporting Table S3 is the upregulated and downregulated top 10 lipids in BT vs. OL, CK vs. BT, and CK vs. OL.
Supporting Table S4 is the different metabolites from the longissimus dorsi muscle in the key differential enriched KEGG pathways.
Open Research
Data Availability Statement
Data will be made available on request.


