ACOCMPMI: An Ant Colony Optimization Algorithm Based on Composite Multiscale Part Mutual Information for Detecting Epistatic Interactions
Abstract
Epistatic interaction detection plays a pivotal role in understanding the genetic mechanisms underlying complex diseases. The effectiveness of epistatic interaction detection methods primarily depends on their interaction quantification measures and search strategies. In this study, a two-stage ant colony optimization algorithm based on composite multiscale part mutual information (ACOCMPMI) is proposed for detecting epistatic interactions. In the first stage, composite multiscale part mutual information is developed to quantify epistatic interactions, and an improved ant colony optimization algorithm incorporating filter and memory strategies is employed to search for potential epistatic interactions. In the second stage, an exhaustive search strategy and a Bayesian network score are adopted to further identify epistatic interactions within the candidate SNP set obtained in the first stage. ACOCMPMI is compared with five state-of-the-art methods, including epiACO, FDHE-IW, AntEpiSeeker, SIPSO, and MACOED, using simulation data generated from 11 epistatic interaction models. Furthermore, ACOCMPMI is applied to detect epistatic interactions in a real dataset of age-related macular degeneration. The experimental results show that ACOCMPMI is a promising method for epistatic interaction detection.
1. Introduction
In recent years, numerous single nucleotide polymorphisms (SNPs) associated with complex diseases have been successfully detected through genome-wide association studies (GWAS) [1]. However, the explanatory power of individual SNPs is limited in some complex diseases, such as cancer [2] and Alzheimer’s disease [3]. Epistatic interactions, broadly defined as nonlinear interactions between SNPs, have emerged as a key mechanism to overcome these limitations. Therefore, the precise detection of epistatic interactions has become a focal point of research [4–6].
Epistatic interaction detection focuses on two key aspects: interaction quantification measures and search strategies. Interaction can be likened to a specific type of association, predominantly manifesting as nonlinear direct associations. Quantifying these interactions relies on various association measures. Traditional statistical measures, such as logistic regression [7, 8], chi-square statistic [9], distance covariance [10], and Pearson’s correlation coefficient [11], are limited to quantifying nonlinear direct associations among target variables. Measures based on information entropy, which do not strictly depend on specific association forms, have gained significant attention in recent years. The mutual information (MI) and conditional mutual information (CMI) are commonly employed for quantifying nonlinear interactions among variables [12–15]. However, they may lead to overestimation and underestimation problems [16]. To precisely quantify nonlinear direct interactions, several measures have emerged, including maximum information coefficient (MIC) [17], conditional mutual inclusive information (CMI2) [18], part mutual information (PMI) [16], partial association (PA) [19] and multiscale part mutual information (MPMI) [20]. Notably, MPMI demonstrates higher accuracy compared with other measures and has not been applied to SNP data. Therefore, this study adopts MPMI and its variant to quantify interaction between SNPs.
The search strategy can be broadly categorized into three groups: exhaustive search, stochastic search, and heuristic search. Exhaustive search methods typically attempt to evaluate all possible SNP combinations within a dataset. However, the high dimensionality of GWAS data imposes a heavy computational burden on exhaustive methods [21]. Stochastic search methods are limited in the number of features they can handle [22]. Heuristic search transforms the epistatic interaction detection problem into an optimization problem. Heuristic search mainly focuses on metaheuristic optimization algorithms, such as the firefly algorithm [23], tree seed algorithm [24], tunicate swarm algorithm [25], side-blotched lizard algorithm [26], African vultures optimization algorithm (AVOA) [27], ant colony optimization (ACO) algorithm [28], symbiotic organisms search algorithm [29], spotted hyena optimizer algorithm [30], yellow saddle goatfish behavior optimization model [31], and grey wolf optimizer [32]. In this study, the ACO algorithm (ACO∗) is employed for searching epistatic interactions, and an improved version of the ACO∗ is presented. The ACO∗ has been widely used in this field [33] and is considered one of the most promising methods among these metaheuristic optimization algorithms.
- •
A composite version of MPMI, termed CMPMI, is proposed. CMPMI is specifically designed for detecting nonlinear direct interactions in SNP datasets.
- •
Memory and filtering strategies are integrated into the ACO∗ to improve the accuracy of epistatic interaction detection.
- •
Epistatic interactions are detected in a two-stage framework. In the first stage, an improved ACO∗ combined with CMPMI is used to generate a candidate SNP set. In the second stage, an exhaustive search strategy and a Bayesian network (BN) score are adopted to further identify epistatic interactions within the candidate set.
2. Related Works
Various methods have been proposed to detect epistatic interactions. For instance, multifactor dimensionality reduction (MDR) [34], backward genotype-trait association (BGTA) [35], Boolean operation-based screening and testing (BOOST) [8], factored spectrally transformed linear mixed models (FaST-LMM) [36], and tree-based epistasis association mapping (TEAM) [37] are epistatic interaction detection methods based on exhaustive search strategies. Bayesian epistasis association mapping (BEAM) [22] and epistatic module detection (EpiMODE) [38] employ stochastic search strategies. BEAM integrates the Bayesian partitioning model with Markov chain Monte Carlo to assess and identify disease-associated SNPs and epistatic interactions. EpiMODE utilizes a Bayesian marker partition model alongside a Gibbs sampling strategy to detect epistatic interactions. For heuristic search methods, CINOEDV is designed to detect and visualize epistatic interactions of various orders, leveraging the particle swarm optimization algorithm and co-information measure [39]. AntEpiSeeker uses a two-stage ACO∗ for identifying epistatic interactions in large datasets [40]. Similarly, MACOED is a multiobjective ACO supervised heuristic method for epistasis detection [41], and IACO applies an improved ACO∗ to search for epistatic interactions [42]. MTHSA-DHEI is proposed for detecting high-order epistatic interactions based on a multitasking harmony search algorithm [43]. Building on this framework, MTHS-EE-DHEI is introduced as an enhanced variant that incorporates explicit encoding into the multitasking harmony search algorithm to further optimize the epistasis detection [44].
3. Materials and Methods
3.1. MPMI
3.2. ACO∗
The ACO∗ is a classical swarm intelligence optimization algorithm designed to solve complex combinatorial optimization problems by simulating the cooperative behavior of ant colonies [45]. The basic idea of the ACO∗ is to map feasible solutions of optimization problems to paths traversed by ants. Ants tend to release more pheromones along shorter paths during their traversal. Meanwhile, pheromones guide ants in selecting subsequent paths. Ultimately, through positive feedback, all ants converge on the optimal path, which corresponds to the optimal solution of the optimization problem. The basic ACO∗ primarily involves two core strategies: path selection and pheromone update.
3.3. BNs
A BN is a network structure based on a directed acyclic graph, used to represent dependencies among observed variables. In this network, nodes represent either SNPs or phenotypes, and edges connecting nodes signify causal dependencies. The K2 score, based on BN, is widely used to quantify causal dependencies between two variables.
3.4. ACOCMPMI
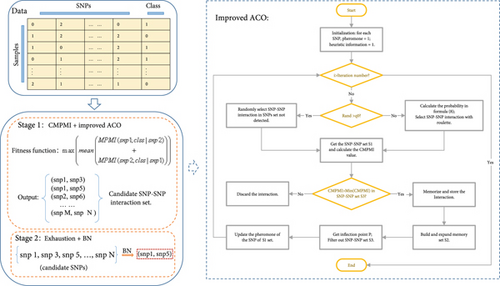
Figure 1 is the flow chart of ACOCMPMI. It can be seen that the ACOCMPMI mainly consists of two parts: Stage 1 (CMPMI + improved ACO) and Stage 2 (exhaustion search + BN). Among them, Stage 1 is the highlight of ACOCMPMI.

3.5. CMPMI
The MPMI possesses several properties that prove beneficial for the investigation of epistatic interaction detection. For instance, (1) MPMI(X; Y|Z) ≥ 0; (2) MPMI(X; Y|Z) = 0 if and only if there is no direct association between X and Y under the condition of Z; (3) when both X and Y are independent of Z, MPMI(X; Y|Z) = CMI(X; Y|Z) = MI(X; Y); (4) MPMI(X; Y|Z) is a vsconstant when X is directly associated with Y regardless of the influence intensity of Z on their association; (5) for the target variables X and Y, MPMI(X; Y|Z) = MPMI(Y; X|Z).
CMPMI is essentially the mean form of MPMI between the involved target variables, indicating the integration of association information related to SNPs and phenotypes. Furthermore, CMPMI incorporates the interconnectedness of SNP combinations, making it symmetric in terms of describing associations.
3.6. An Improved ACO∗
Given that the basic ACO∗ exhibits low convergence speed and faces challenges with local minima problems [28, 48–50], we developed an improved ACO∗.
To further expedite convergence, a filtering operation based on the memory strategy is incorporated into ACOCMPMI. Within the candidate solution set obtained from each iteration, min(CMPMI) is utilized as the filter criterion. For subsequent iterations, those SNP combinations with CMPMI values greater than the filter criterion are retained and stored in the candidate solution set.
4. Results and Discussion
4.1. Evaluation Metrics
In the experiments, three evaluation metrics, including detection power, F-measure, and running time, are employed to assess the performance of compared methods.
4.2. Simulation Datasets
There are 11 epistatic interaction models to evaluate the performance of compared methods, where Models 1–8 are models displaying marginal effects (DMEs), and Models 9–11 are models displaying no marginal effects (DNMEs). Table 1 lists details of these models, in which MAF represents minor allele frequency, AA is the homozygous common genotype, Aa is the heterozygous genotype, and aa is the homozygous minor genotype [49, 53]. Using these models, the simulator EpiSIM was applied to generate datasets of different scales [54]. For small-scale datasets, each model was used to generate 100 datasets, in which the sample number is 4000 and the SNP number is 100. For large-scale datasets, each model was used to generate 50 datasets, in which the sample number is 4000 and the SNP number is 1000.
| Models | MAF(a) | MAF(b) | AABB | AABb | AAbb | AaBB | AaBb | Aabb | aaBB | aaBb | aabb |
|---|---|---|---|---|---|---|---|---|---|---|---|
| Model 1 | 0.2 | 0.2 | 0.087 | 0.087 | 0.087 | 0.087 | 0.146 | 0.190 | 0.087 | 0.190 | 0.247 |
| Model 2 | 0.5 | 0.5 | 0.009 | 0.009 | 0.009 | 0.013 | 0.006 | 0.006 | 0.013 | 0.006 | 0.006 |
| Model 3 | 0.5 | 0.5 | 0.092 | 0.092 | 0.092 | 0.092 | 0.319 | 0.319 | 0.092 | 0.319 | 0.319 |
| Model 4 | 0.2 | 0.2 | 0.084 | 0.084 | 0.084 | 0.084 | 0.210 | 0.210 | 0.084 | 0.210 | 0.210 |
| Model 5 | 0.5 | 0.5 | 0.052 | 0.052 | 0.052 | 0.052 | 0.137 | 0.137 | 0.052 | 0.137 | 0.137 |
| Model 6 | 0.5 | 0.5 | 0.072 | 0.164 | 0.164 | 0.164 | 0.072 | 0.072 | 0.164 | 0.072 | 0.072 |
| Model 7 | 0.5 | 0.5 | 0.067 | 0.155 | 0.155 | 0.155 | 0.067 | 0.067 | 0.155 | 0.067 | 0.067 |
| Model 8 | 0.3 | 0.3 | 0.486 | 0.960 | 0.538 | 0.947 | 0.004 | 0.811 | 0.640 | 0.606 | 0.909 |
| Model 9 | 0.2 | 0.5 | 0.103 | 0.063 | 0.124 | 0.098 | 0.086 | 0.069 | 0.021 | 0.147 | 0.059 |
| Model 10 | 0.5 | 0.5 | 0.000 | 0.000 | 0.000 | 0.000 | 0.050 | 0.000 | 0.100 | 0.000 | 0.000 |
| Model 11 | 0.3 | 0.3 | 0.000 | 0.020 | 0.000 | 0.020 | 0.000 | 0.020 | 0.000 | 0.020 | 0.000 |
4.3. Results on Simulation Datasets
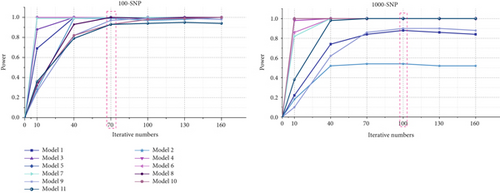
For small-scale datasets, the ant number and the iteration number are set to 200 and 70, respectively, while for large-scale datasets, the ant number and the iteration number are set to 2000 and 100, respectively. The detection power of ACOCMPMI with different iteration numbers is precomputed for all models, and those iteration numbers close to the optimal convergence point are selected as the iteration parameters, as illustrated in Figure 2.

For small-scale datasets, detection power and F-measure of compared methods are presented in Figure 3. In terms of detection power, most methods perform well and detect almost all epistatic interactions in various datasets. Specifically, ACOCMPMI demonstrates high and stable detection power in DMEs, comparable to FDHE-IW and MACOED. Notably, FDHE-IW is a method specifically designed for detecting DMEs [55]. ACOCMPMI exhibits lower detection power than MACOED in small-scale DNME datasets, contrasting with its superior performance in large-scale datasets. Although AntEpiSeeker performs effectively in Model 4–7 datasets, it fails to detect epistatic interactions in Model 2, 8, and 11 datasets, implying that AntEpiSeeker may be inconsistent and exhibit model preference. SIPSO shows similar performance to AntEpiSeeker but with greater stability. However, SIPSO struggles to adapt to DNMEs. In terms of F-measure, ACOCMPMI significantly outperforms most compared methods in DMEs, though its performance is inferior to MACOED in DNMEs.

For large-scale datasets, detection power and F-measure of compared methods are presented in Figure 4. In terms of detection power, ACOCMPMI outperforms all compared methods in almost all datasets except Model 1–2 datasets. Performance of ACOCMPMI ranks second only to SIPSO in Model 1 datasets and to FDHE-IW in Model 2 datasets, respectively, further demonstrating the stability of its detection capability. AntEpiSeeker and MACOED show detection power ranging from 0.1 to 0.5 in most models, which is significantly lower than the detection power of ACOCMPMI. SIPSO performs effectively in datasets of Models 1, 5, and 9–11, but fails to identify over 60% of epistatic interactions in other datasets. epiACO and FDHE-IW exhibit detection power comparable to ACOCMPMI. epiACO performs well in most models since both it and ACOCMPMI use the ACO∗ and the information theory-based quantification measure. In terms of F-measure, ACOCMPMI has higher values than those of compared methods in almost all datasets except Model 1–2 datasets. Although epiACO and FDHE-IW are as effective as ACOCMPMI in identifying epistatic interactions in most models, their F-measure values vary widely among models, implying that both have weaker stability than ACOCMPMI. SIPSO, AntEpiSeeker, and MACOED generally have low F-measure values in most models, which is consistent with their performance in detection power.

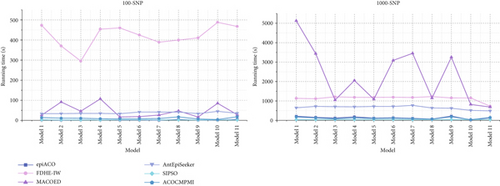
Running times of compared methods in different datasets are shown in Figure 5. It is seen that in small-scale datasets, ACOCMPMI has similar running times to those of both epiACO and SIPSO in various models. Running times of AntEpiSeeker in all models are relatively stable, though it takes more time than ACOCMPMI, epiACO, and SIPSO. MACOED shows significantly varying running times across models, implying that it is sensitive to model type. FDHE-IW requires unacceptable running times in all models. For large-scale datasets, in DMEs and DNMEs, ACOCMPMI has a clear advantage in terms of running time. Unlike FDHE-IW, which has the worst running times in small-scale datasets, MACOED becomes the most time-consuming method in large-scale datasets. Though SIPSO and epiACO have acceptable running times, their detection power is low.

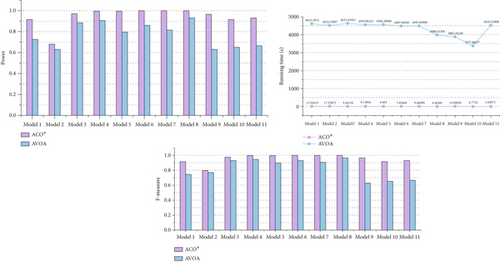
To demonstrate that the improved ACO∗ in ACOCMPMI is effective for searching epistatic interactions, ACO∗ is compared with AVOA in small-scale datasets, using CMPMI as their fitness function, in terms of detection power, F-measure, and running time, as shown in Figure 6. It is seen that even when facing the recently developed meta-heuristic algorithm AVOA, ACO∗ still has an advantage in search performance. In general, the random strategy and memory-filter strategy incorporated into the basic ACO∗ improve its detection capability without increasing running time.

4.4. Case Study
ACOCMPMI is applied to a real AMD dataset to detect two-order epistatic interactions. The AMD dataset contains 103,611 SNPs with 50 controls and 96 cases and has become a widely used benchmark dataset [39, 53]. ACOCMPMI runs four times on this AMD dataset, using ants and iterations as (10,000, 500), (10,000, 1000), (20,000, 250), and (20,000, 1000), respectively, to capture more epistatic interactions. Table 2 lists the Top 15 detected epistatic interactions associated with AMD.
| SNP 1 | SNP 2 | Fitness value | p value | Times | ||||
|---|---|---|---|---|---|---|---|---|
| Name | Gene | Chr | Name | Gene | Chr | |||
| rs3775652 | INPP4B | 4 | rs380390 | CFH | 1 | 123.48 | 0.0175 | 3 |
| rs3775652 | INPP4B | 4 | rs725518 | RRM1 | 11 | 121.99 | 0.0149 | 3 |
| rs380390 | CFH | 1 | rs725518 | RRM1 | 11 | 121.05 | 0.0039 | 3 |
| rs380390 | CFH | 1 | rs54816 | RRM1 | 11 | 120.19 | 0.0064 | 3 |
| rs3775652 | INPP4B | 4 | rs54816 | RRM1 | 11 | 119.90 | 0.0081 | 3 |
| rs7863587 | / | 9 | rs380390 | CFH | 1 | 119.63 | 0.0415 | 2 |
| rs4772270 | PCCA | 13 | rs380390 | CFH | 1 | 118.82 | 0.0265 | 1 |
| rs6480996 | / | 10 | rs380390 | CFH | 1 | 118.11 | 0.0052 | 1 |
| rs2019727 | CFH | 1 | rs380390 | CFH | 1 | 118.05 | 0.0082 | 1 |
| rs380390 | CFH | 1 | rs365299 | / | 1 | 117.10 | 0.0190 | 1 |
| rs3775652 | INPP4B | 4 | rs4772270 | PCCA | 13 | 115.98 | 0.0458 | 1 |
| rs7863587 | / | 9 | rs3775652 | INPP4B | 4 | 115.49 | 0.0394 | 1 |
| rs3775652 | INPP4B | 4 | rs3775650 | INPP4B | 4 | 113.31 | 0.0234 | 1 |
| rs3775650 | INPP4B | 4 | rs4772270 | PCCA | 13 | 112.69 | 0.0046 | 1 |
| rs7863587 | / | 9 | rs725518 | RRM1 | 11 | 111.21 | 0.0285 | 1 |
rs380390 is a G/A/T/C single-nucleotide variation in the CFH gene on human chromosome 1, and rs2019727, also located in CFH, is considered to be significantly associated with AMD in several studies [56–61]. rs3775652 is a C/T single-nucleotide variation located in the INPP4B gene on chromosome 4, and rs725518 is an A/G single-nucleotide variation in the RRM1 gene on chromosome 11, both of which have been detected as AMD-related SNPs [62, 63]. rs4772270 is a G/A/T/C single-nucleotide variation in the PCCA gene on chromosome 13, which has also been reported to be associated with AMD [55, 62, 63]. More recently, rs7863587 was reported to be highly associated with AMD [64]. Although further experiments and clinical studies are needed to confirm real epistatic interactions with AMD, we hope that these findings of ACOCMPMI can provide some clues for the pathological study of AMD.
5. Conclusions and Future Works
Epistatic interaction detection plays a pivotal role in understanding the genetic mechanisms underlying complex diseases. The effectiveness of epistatic interaction detection methods primarily depends on their interaction quantification measures and search strategies. Therefore, both are significant challenges for epistatic interaction detection. In this study, ACOCMPMI, a two-stage ACO∗ based on composite MPMI is proposed for detecting epistatic interactions. In the first stage, CMPMI is introduced to quantify epistatic interactions, and an improved ACO∗, incorporating filter and memory strategies, is employed to search for epistatic interactions. In the second stage, an exhaustive strategy and a BN score, that is, K2 score, are adopted to further identify epistatic interactions within the candidate SNP set obtained from the first stage. ACOCMPMI is compared with five state-of-the-art methods, including epiACO, FDHE-IW, AntEpiSeeker, SIPSO, and MACOED, using simulation data based on 11 epistatic interaction models. Furthermore, ACOCMPMI is applied to detect epistatic interactions in a real dataset related to AMD. The experimental results show that ACOCMPMI is an alternative method for epistatic interaction detection. The time complexity of ACOCMPMI is O(NT + nm2), where N, T, n, and m are numbers of ants, iterations, SNPs, and samples, respectively.
However, there are still several limitations in ACOCMPMI, which inspire us to continue working. First, how to adjust parameter settings to adapt to different scales of input SNP datasets should be further discussed. Second, the practical applicability and scalability of ACOCMPMI require a more detailed analysis. Although some of the identified SNPs have been validated, it remains unclear whether their two-order combinations are indeed causal factors of AMD. Furthermore, the current version of ACOCMPMI focuses on capturing two-order epistatic interactions. In reality, complex diseases are often caused by epistatic interactions with different orders, especially higher orders. Therefore, its future version should be developed to detect higher order epistatic interactions.
Conflicts of Interest
The authors declare no conflicts of interest.
Author Contributions
Yan Sun and Jing Wang contributed equally to this work.
Funding
This work was supported by the National Natural Science Foundation of China (62472250, 62473179, and 62172254).
Open Research
Data Availability Statement
Data is available on request.


