EPHB1 Protein Promoted the Progression of Prostate Adenocarcinoma Through Phosphorylating GSK3B and Activating EPHB1-GSK3B-SMAD3 Pathway
Abstract
Background: The apoptosis affected the prostate adenocarcinoma (PRAD); we aimed to explore the potential pathogenesis of high-risk patients based on the apoptosis features.
Method: The RNA-seq data of patients and apoptosis genes were used for apoptosis score calculation via “GSVA” package; then, the weighted gene coexpression network analysis (WGCNA) and Lasso algorithm were performed for a RiskScore model. After that, the “maftools” package was applied for the somatic mutation analysis. By combining the Kaplan–Meier (KM) survival curves in order to compare the prognosis of different subgroups of patients, Cell Counting Kit-8 (CCK-8), EdU staining, and Transwell assays were performed. Protein expression was measured using western blotting. Finally, the activity of PRAD cells in macrophage polarization was detected using coculture and immunofluorescence assays.
Results: The PRAD samples had significantly lower apoptosis scores, and the RiskScore supported the risk stratification of patients. In somatic mutation analysis, EPHB1 and KIF13A from the top six mutant genes were overexpressed in 22RV1 and PC-3 tumor cells, and low levels of EPHB1 indicated a better prognosis. Overexpression or knockdown of EPHB1 affected cell viability, proliferation, and invasion. We found that high expression of EPHB1 interacting with GSK3B protein promoted the expression of p-SMAD3 in 22RV1 cells with high levels of antiapoptotic and invasion markers (BCL2, Snail, and N-CAD). Importantly, GSK3B and EPHB1 knockdown inhibited p-SMAD3 activation and promoted proapoptotic features, accompanied by a reduction in macrophage M2 polarization.
Conclusion: This study revealed that EPHB1 plays a pivotal role in activating the EPHB1-GSK3B-SMAD3 pathway to facilitate PRAD progression.
1. Introduction
Prostate adenocarcinoma (PRAD) is a common male malignancy with an increasing incidence rate as the population ages [1] and is clinically considered a strongly localized neoplasm with slow progression. The pathogenesis of PRAD remains poorly understood [2]. Epidemiological studies have revealed that obesity, smoking, alcohol use, and genetic factors are associated with a high risk of PRAD [3]. Improved diagnostic and treatment techniques have increased the 5-year overall survival (OS) by up to 90%; however, distant metastasis often occurs in advanced PRAD with invasive features and lowers the 5-year OS rate to 30% [4]. Although radical prostatectomy, radiation therapy (RT), and androgen deprivation therapy (ADT) contribute to favorable treatment outcomes [5], existing diagnostic techniques lack the specificity of distinguishing the aggressive and nonaggressive properties of PRAD, often resulting in treatment failure [6]. Some patients with highly malignant PRAD are insensitive to ADT and have an OS that is 80% similar to that of patients who do not receive ADT [7]. Castration-resistant prostate cancer (CRPC) is resistant to both chemotherapy and radiotherapy [4]. To date, clinicians have relied on clinicopathologic characteristics—such as prostate-specific antigen levels, TNM staging, and Gleason score—to guide therapeutic decisions and assess prognosis in patients with PRAD [8]. However, these markers have shown limited precision in clinical practice. Therefore, it is necessary to develop a novel and effective risk model that integrates molecular profiles with clinical data [9].
Apoptosis is a form of programmed cell death that mediates the efficient removal of damaged or harmful cells produced by oxidative stress, genotoxic stress, or hypoxia [10]. Caspases (aspartate-specific proteases) are the core mechanisms of apoptosis and regulate the imbalance between antiapoptotic (Bcl-xL, Bcl-2, Mcl-1, A1/Bfl-1, and Bcl-w) and proapoptotic (Bax, Bak, and Bok/Mtd) regulators of homeostasis and carcinogenesis [11]. For example, inactivation of the tumor suppressor P53 causes carcinogenesis by reducing apoptosis of tumor cells [12], and targeting apoptotic molecules could be developed as a treatment strategy to overcome tumor apoptotic resistance [13]. For apoptosis research in PRAD, Raffo et al. demonstrated that overexpression of antiapoptotic Bcl-2 protects PRAD cells from apoptosis [14] and that overexpressed antiapoptotic proteins Bcl-X and Mcl-1 in high-grade and metastatic PRAD promote cancer resistance to apoptosis [15]. Interferon activates caspase-8 to increase tumor responsiveness to chemotherapy-induced apoptosis [16], and inducing the P53 gene enhances the radiosensitivity of PRAD to P53 gene therapy [17]. These findings suggest that apoptotic pathways and processes play crucial roles in PRAD progression. In addition, other apoptotic pathways include tumor necrosis factor receptor (TNFR) systems of TNFR1-TNFα, TRAILR2 (DR5)-TRAIL, TRAILR2 (DR5)-TRAIL, and FAS (CD95, APO-1)-FasL [18], especially tyrosine/serine receptor kinases of the EPH receptor B1 (EPHB1). Studies have found that EPHB1 is upregulated by activating PI3K/Akt/NF-κB signaling in a chronic ocular hypertension (COH) model used to analyze the apoptosis of retinal ganglion cells (RGCs) [19] and that EPHB1 is also involved in the regulation of apoptosis during PRAD progression [20]. These findings suggest that exploring apoptotic features is promising for understanding the potential pathogenesis of PRAD and developing effective therapeutic targets. Here, we conducted a retrospective study in a PRAD cohort collected from The Cancer Genome Atlas (TCGA), based on apoptosis-related genes. PRAD samples had significantly higher apoptosis scores, and a risk score model for risk stratification in PRAD was constructed by applying the weighted gene coexpression network analysis (WGCNA) and Lasso algorithms. Focusing on the top six mutant genes in high-risk samples, an in vitro assay demonstrated that EPHB1 and KIF13A were significantly overexpressed in tumor cells and that low levels of EPHB1 were associated with a better prognosis. The role of EPHB1 in tumor viability, proliferation, and invasion was analyzed using knockdown and overexpression experiments. Furthermore, the role of EPHB1 protein in the phosphorylation of Glycogen Synthase Kinase 3 Beta (GSK3B) and SMAD Family Member (SMAD3) proteins, as well as the effects of apoptotic proteins, was examined by western blotting. Overall, the aim of this study was to reveal the critical role of EPHB1 in PRAD progression, and it was found that it activates SMAD3 phosphorylation through interactions with GSK3B to promote tumor cell survival, invasion, and the formation of an immunosuppressive microenvironment, which provides new evidence and perspectives on the progression mechanism of PRAD.
2. Materials and Methods
2.1. Cell Culture and Gene Expression Testing
Human normal prostate epithelial cell line (RWPE-2) and human prostate cancer cell lines (22RV1, PC-3, C4-2, C4-2B, and DU145) were obtained from the American Type Culture Collection (ATCC). Dulbecco’s Modified Eagle’s Medium (DMEM) (OMDCM025, Oumashi, Shanghai, China) supplemented with 10% fetal bovine serum (FBS) (Gibco, Waltham, Massachusetts, United States) and 1% penicillin/streptomycin (P/S, Gibco, United States) was used for RWPE-2 cell culture. The RPMI-1640 medium (Gibco, United States) containing 10% FBS and 1% P/S was used to culture the 22RV1 and PC-3 cells. All cells were maintained in incubator with 5% CO2 at 37°C. STR identification has been carried out on the cells, and the outcome of mycoplasma detection shows negativity. Cultured cells were harvested for total RNA extraction using TRIzol Reagent (15596026, Invitrogen, Carlsbad, California, United States), and cDNA was synthesized using a Reverse Transcription Kit (R211-01, Vazyme, Nanjing, China). Subsequently, we performed on a LightCycler 96 instrument using an SYBR Green qPCR Kit (Q111, Vazyme, Nanjing, China). Gene expression was calculated using the 2−ΔΔCT method with β-actin as a reference [21]. Specific primers for the target genes are listed in (Table 1).
| Gene | Forward (5 ′-3 ′) | Reversed (5 ′-3 ′) |
|---|---|---|
| EPHB1 | GACCAAGGTGAACTCGGTTCC | GGAGGAGGGGCTCTGAGGG |
| DCHS2 | TGTATCACCCTGTTTTCTCACTCATG | GCTCAAATTCATCTATCCCTTCAAT |
| KIF13A | TGCCTAAGAATGAGCTTGCAAA | AGAATGGCAGCACGTGGCT |
| FBN3 | GCATGGCAGGTGGCCAAG | GACAGCGAGATGGGTCTGGTG |
| CDH23 | GACGCTGACCGCTGCCGA | TGCTGCTCACACCCACAAGG |
| CDK12 | GAGAAGACCAGGAAAGAACGGG | AGATCGTGAGGGACTAAGGTCATAA |
| BCL2 | CAACCGGGAGATGTCGCC | TCGCCGGCTCCACAGCCT |
| Snail | CTGAGTGCCCCACTTCTGGC | CACGCAGACAGGCCAGCT |
| N-CAD | TATGTGTACATAATGTTTTATTGGCATAGT | TCTAACTACAGCTCAACAATTGAATCA |
| BAX | ATGCGTTTTCCTTACGTGTCTGA | AGAGCTAGGGTCAGAGGGTCATC |
| E-CAD | GCTCACTGCAGCCTTGTCC | CAAGATGGGAGGATCACTTGAGC |
| β-Actin | ATCATGTTTGAGACCTTCAACACCC | CAGCCAGGTCCAGACGCA |
2.2. Data Collection and Apoptosis Score
The clinical data and RNA-seq data of PRAD patients were obtained from TCGA database (https://portal.gdc.cancer.gov), and the FPKM format of TCGA-PRAD RNA-Seq data was converted to TPM and log2-fromat. A total of 495 PRAD and 52 paracancer control samples with progression-free interval (PFI) were included in this study. In addition, RNA-seq data and information of 131 patients with PRAD from the cBioPortal database (MSKCC, Cancer Cell 2010) were downloaded. The gene set of “HALLMARK_APOPTOSIS” was obtained from the MSigDB [22] (https://www.gsea-msigdb.org/gsea/msigdb/), and single sample gene set enrichment analysis (ssGSEA) was performed to calculate the apoptosis feature score for the patients using “GSVA” R package.
2.3. WGCNA
The “WGCNA” R package was employed to conduct WGCNA analysis for sectioning gene coexpression modules related to the apoptosis feature score [23]. First, the outlier samples were removed by hierarchical clustering, and a similarity matrix was generated using the Pearson method and transformed into an adjacency matrix for the gene-free scale network distribution. The correlation between connectivity (K) and p(k) reaching 0.85 was considered a scale-free topology criterion, and the pickSoftThreshold function was used to determine the optimal soft threshold (β). Finally, the adjacency matrix was calculated and denoted as β, and the gene expression profile was converted to a TOM matrix using dissTOM (method = “average”). Gene modules were sectioned using the cutreeDynamic function, and the apoptosis feature–related module was determined according to the Spearman correlation.
2.4. Differentially Expressed Genes (DEGs) and Function Enrichment Analysis
Under the screening threshold of |log2FC| > 1 and p.adj < 0.05, DEG analysis between the PRAD and paracancer control samples in the TCGA cohort was conducted with the “limma” R package. Then, the “clusterProfiler” R package was applied for the Gene Ontology (GO) and Kyoto Encyclopedia of Genes and Genomes (KEGG) enrichment analyses on these genes [24, 25]. The “clusterProfiler” R package was employed for significant pathway enrichment analysis based on the gene sets of HALLMARK pathway and GSEA; moreover, the HALLMARK gene set was also used in hallmark pathway activation with the “GSVA” R package [24].
2.5. Construction and Validation of Risk Model
Univariate Cox proportional hazard regression in the Kaplan–Meier (KM) “survival” R package was applied to screen significant prognostic factors (p < 0.05) [26], from which the hub genes were filtered by Lasso Cox regression analysis and stepwise regression and used to develop a RiskScore system with the “glmnet” R package: RiskScore = Σβi × Expi (β represents the regression coefficient of the gene; Exp represents the gene expression) [26]. For risk stratification, the RiskScore of patients was calculated based on the optimal cutoff point determined by the “survminer” R package [27].
2.6. Analysis of Immune Cell Infiltration
The CIBERSORT and ESTIMATE algorithms were used to evaluate immune infiltration in the TCGA cohort. The scores of 28 types of tumor-infiltrating lymphocytes (TILs) were calculated using the gene marker set from a previous study using the GSVA package [28]. The gene set of immune checkpoint genes from another published study was used to assess tumor malignancy [29]. Based on the somatic mutation profiles of TCGA and TCGA genomic mutation characteristics obtained from published research, tumor mutation burden (TMB) and mutation frequency of the patients were calculated using the “maftools” R package and the mafCompare function with Fisher’s test [30].
2.7. Transfection Experiment
si-negative control (si-NC) and si-EPHB1 (#1 (sense strand (SS): 5 ′- GUGGGAAACCAAAUAUAUAAU-3, ′ anti-sense strand (AS): 5 ′- UAUAUAUUUGGUUUCCCACGG-3 ′) and #2 (SS: 5 ′-GAUGUUCAACAGAAGUGAAGA-3 ′; AS: 5 ′- UUCACUUCUGUUGAACAUCAC-3 ′)) from Sangon Biotech (Shanghai, China) was used to silence EPHB1 in 22RV1 and PC-3 cells using the pLKO.1 vector (Zeye Biotech, Shanghai, China) with ampicillin and puromycin resistance. All constructs were confirmed by sequencing, and cell transfection was performed using Lipofectamine 3000 (L3000-001, Invitrogen, United States) [21]. To inhibit the activity of GSK3B, the specific inhibitor GSK3B Inhibitor XI (Compound 33, HY-112388, MedChemExpress, Monmouth Junction, New Jersey, United States) was used for intervention. The 22RV1 and PC-3 cells were inoculated in 6-well plates, and were treated by adding complete medium containing GSK3B Inhibitor XI (final concentration of 10 μM) for 24 h once they grew attached to the edge of the plate. Such group was set up as the GSK3B-IN group; the cells of the control group were added with an equal volume of solvent (DMSO) and set up as the vector group. Cells were collected at the end of treatment for subsequent analysis.
2.8. Cell Viability, Invasion, and Proliferation Assay
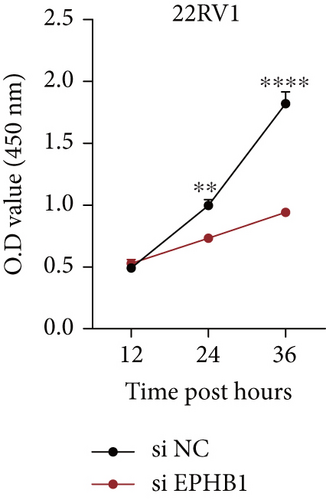
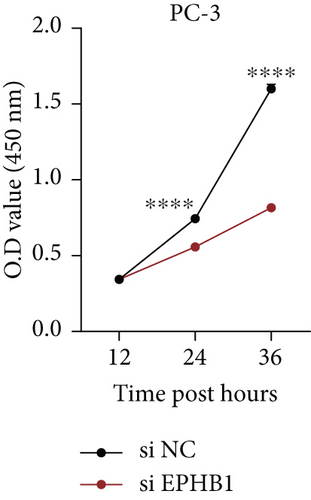
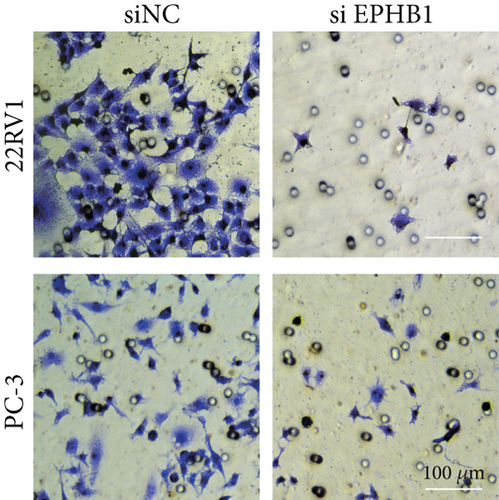
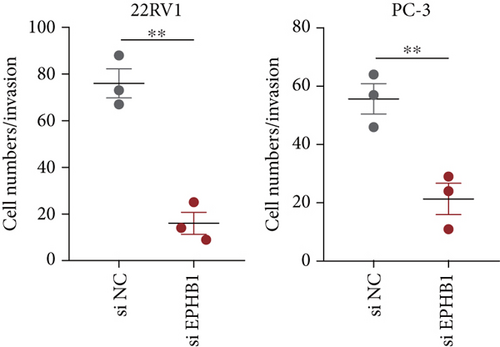
A total of 4 × 10³ cells were seeded into 96-well plates for 2-h incubation, followed by adding 10 μL of Cell Counting Kit-8 (CCK-8) (Dojindo, Kumamoto, Japan) to each well. The absorbance at 450 nm was measured using an enzyme-labeled instrument (iBIO-RADMark, Bio-Rad Laboratories) at 12, 24, and 36 h after cell culture based on the following formula: cell viability(%) = (A(CCK − 8) − A(control)) × 100%) [31]. Cell invasion activity was assessed using a transwell assay. The diluted matrix gel was added to the upper chamber of 24-well plates (Corning, Inc., Corning, New York, United States) containing 8-μm pore inserts for 1-h incubation until a film was formed. After clearing excess fluid, 200 μL of serum-free DMEM was added until the membrane became hydrated. Next, 5 × 10⁴ cell suspensions were seeded into the upper chamber, while the lower chamber was loaded with 800 μL of DMEM containing 20% FBS. After 48 h of culture, 4% paraformaldehyde and 0.1% crystal violet (G1014-50ML, Servicebio, Wuhan, China) were used for cell fixation and staining, respectively, and cells were photographed under an inverted microscope (Leica, Wetzlar, Germany) [21, 32]. Finally, the BeyoClick EdU Kit (Beyotime, Hangzhou, China) was used to detect cell proliferation according to the manufacturer’s specifications. Briefly, 1 × 10⁴ cells were cultured in the 6-well plates overnight, and preheated EdU solution (2x) at 37°C was then added to the 6-well plate in equal volumes for 2 h incubation. Next, the culture solution was removed, and 4% paraformaldehyde was added for cell fixation for 15 min. After washing the cells three times with PBS, PBS containing 0.3% Triton X-100 was added for 15-min incubation. After removing the washing solution, 1 mL of 1× Hoechst 33342 was added to stain cell nuclei. Fluorescence was detected using a fluorescence microscope (Leica, Germany) [33].
2.9. Co-Immunoprecipitation (Co-IP)
The cultured cells were harvested for the protein extraction using a RIPA buffer (Solarbio, Beijing, China) together with phosphatase inhibitors and a cocktail of protease (Solarbio, China), and the antibodies for Co-IP included anti-EPHB1 antibody (XGK1274, AmyJet Scientific Inc., Wuhan, China) and anti-GSK3B antibody (FNab03673, Feien Biotech, Wuhan, China). Next, 200 μL of Pierce Protein A/G magnetic beads (Invitrogen, United States) was used to load the antibodies for 4 h, and 500 μL of cell lysates was mixed with the antibody-crosslinked beads. The beads were washed five times with washing buffer (Cayman, Ann Arbor, Michigan, United States), 2 × sample loading buffer (Beyotime, China) was added, and the beads were incubated for 10 min. Finally, the lysates were separated using 10% sodium dodecyl sulfate–polyacrylamide gel electrophoresis (SDS-PAGE) for western blotting (see the following) [21].
2.10. Western Blotting
The protein samples were extracted from cultured cells and analyzed using a BCA standard protein kit (BCA01, Dingguo, Guangzhou, China). Then the proteins were separated by SDS-PAGE, electroblotted on PVDF membrane (Immobilon-P, Merck Millipore Burlington, Vermont, United States) and blocked with 5% nonfat milk for 1 h. Next, the primary rabbit antibodies of BCL2 (SAB4300339, Merck Millipore, United States), BAX (MBS840953, AmyJet Scientific Inc., China), Snail (ybs-1371R, Yanjin Biotech, Shanghai, China), E-CAD (FNab02618, Feien Biotech, China), N-CAD (K21283-JQK, Beijing Bio-Lab Technology, Beijing, China), SMAD3 (CAF50332, AmyJet Scientific Inc., China), p-SMAD3 (HZK-933951, Huzheng Biotech, Shanghai, China), p-GSK3B (69455-61-2, Ruiqi Biotech, Shanghai, China), and GAPDH (YT778-KFT, Beijing Bio-Lab Technology, China) were added for incubation at 4°C overnight. After washing with TBST, goat anti-rabbit IgG secondary antibody (ab205718, Abcam, Cambridge, United Kingdom) conjugated with horseradish peroxidase was used to incubate the protein for 2 h. Finally, ECL chemiluminescent liquid (PE0010, Solarbio) was used for protein detection using ImageJ software [34, 35].
2.11. Coculture of the Cells With Macrophages
A total of 5 × 10⁵ human monocytes (THP-1) obtained from ATCC were cultured in RPMI-1640 culture medium containing 10% FBS, 1% P/S, and 20 nM CSF-1 at 37°C in a 5% CO2 atmosphere. After 1 week of induction, monocyte-derived macrophages (MDMs) were obtained and further maintained in serum-free RPMI-1640 medium for 24 h to stabilize the M0 macrophage phenotype. For the coculture experiments, a total of 2 × 10⁴ 22RV1 or PC-3 cells with si-EPHB1 and GSK3B-IN were seeded into the upper inserts of 24-well Transwell chambers (0.4 μm pore size, Corning, Inc., United States), while M0 macrophages were plated in the lower chamber wells. The two cell types were cocultured for 48 h at 37°C to allow paracrine interaction without direct cell contact. After coculture, macrophages were harvested for immunofluorescence staining to assess phenotypic polarization.
2.12. Immunofluorescence Detection
After 48-h of incubation, 4% paraformaldehyde was applied for 30 min for cell fixation, and 0.5% Triton X-100 was added for another 2 min of incubation. Next, after blocking specific antibody binding with 1% bovine serum albumin for 1.5 h, anti-rabbit CD86 antibody (abs102644, Absin Bioscience Inc., Shanghai, China) and anti-rabbit CD206 antibody (MBS179821, AmyJet Scientific Inc., China) were added and incubated at 4°C overnight. Goat anti-rabbit IgG secondary antibody with DyLight 488 fluorescence label was used to incubate the cells for 2 h, and the nuclei were counterstained with DAPI. The cells were photographed using an upright fluorescent microscope [34].
2.13. Statistical Analysis
All statistical data were analyzed using the R software (Version 3.6.0) and GraphPad Prism software (Version 8.0.2). The Student’s t-test was used to calculate the difference between two sets of continuous variables, and the two-way ANOVA was applied for the analysis on the results from CCK-8 assay. The KM survival analysis with log-rank test was conducted using the “survival” R package [27], and the “pROC” R package was used for the receiver operating characteristic (ROC) analysis with the area under curve (AUC). Three independent replications were performed for all experimental procedures. A p < 0.05 was of statistical significance ( ∗p < 0.05, ∗∗p < 0.01, ∗∗∗p < 0,001, ∗∗∗∗p < 0.0001) [27].
3. Results
3.1. Construction and Validation of a RiskScore Prognostic Model
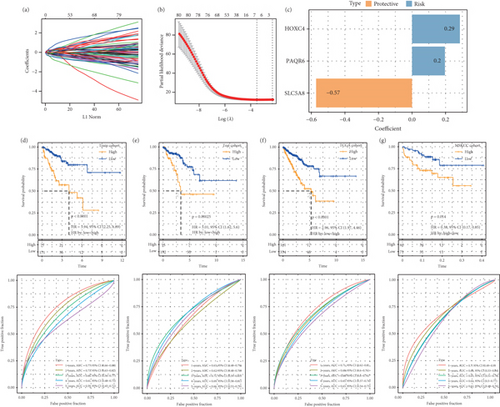
Based on the apoptosis gene set from the MSigDB database, we found that the apoptosis feature score was significantly lower in the tumor samples (p < 0.05, Figure S1A). WGCNA was used to identify the gene modules related to the apoptosis score. A soft threshold of β = 6 (Figure S2A,B) ensured a scale-free network for hierarchical clustering and generated 41 coexpression modules (Figure S1B). Notably, the red module was positively correlated with the apoptosis feature score (p = 1.10e − 64, Figure S1C,D), and its genes were mainly enriched in the focal adhesion, calcium signaling pathway, and cAMP signaling pathways in the KEGG analysis (Figure S1E) and were associated with the regulation of membrane potential, cell-substrate adhesion, muscle system process, urogenital system development, muscle contraction, and renal system development in the biological process (BP) term in the GO analysis (Figure S1F). We identified 348 overlapping genes between the DEGs (240 up-regulated DEGs and 759 down-regulated DEGs) and red module genes (Figure S3A–C). The training set in the TCGA-PRAD cohort was subjected to a chi-squared significant difference test at a ratio of 7:3. Three candidate genes were selected from 384 overlapping genes using the LASSO algorithm with stepwise regression (Figure 1a,b) to formulate a RiskScore model = 0.285∗HOXC4 + 0.196∗PAQR6 + (−0.572∗SLC5A8) (Figure 1c). KM survival analysis revealed that high-risk patients had poor outcomes and that the RiskScore model had an accurate classification ability (Figures 1d, 1e, 1f, and 1g), which supported the development of a nomogram with strong prediction performance and clinical value (Figure S4A–E).
3.2. Pathway Activation and Mutation Characteristic Analysis
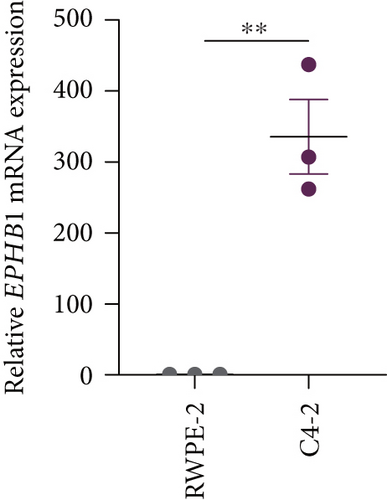
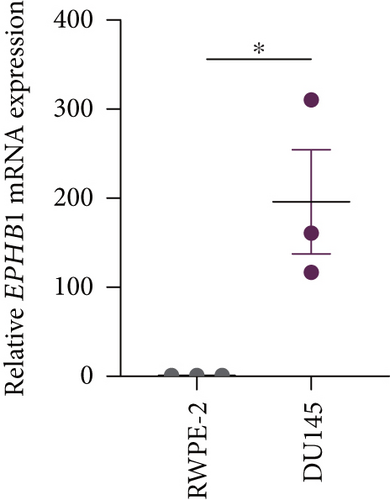
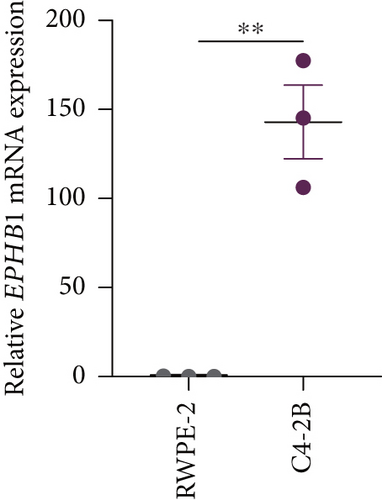
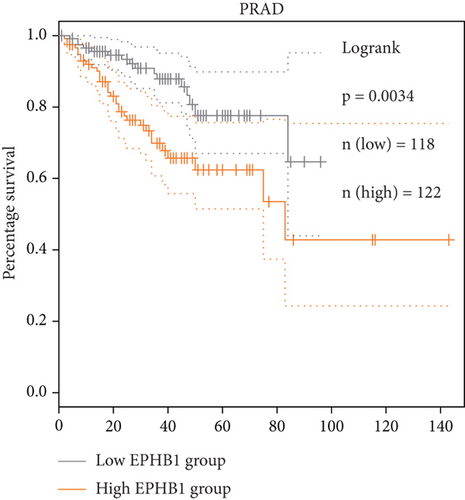
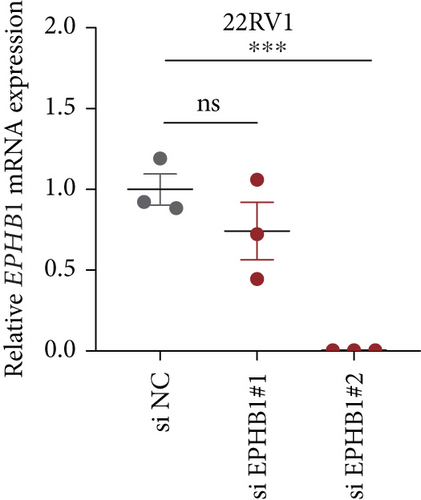
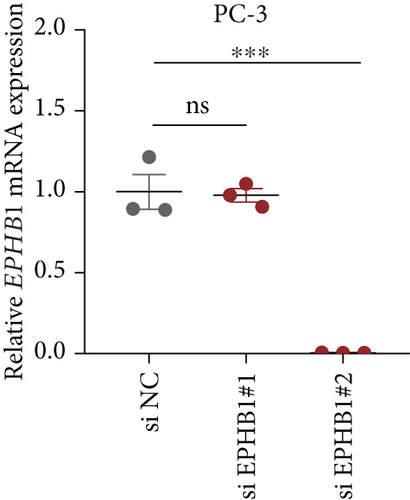
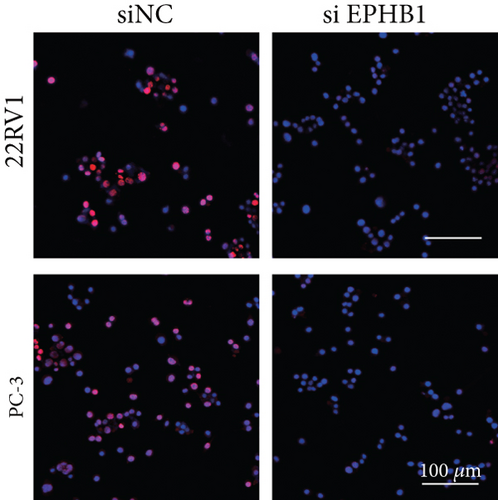
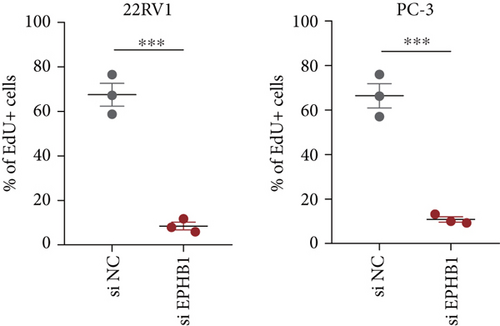
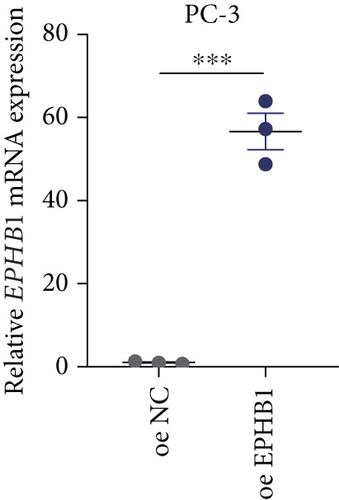
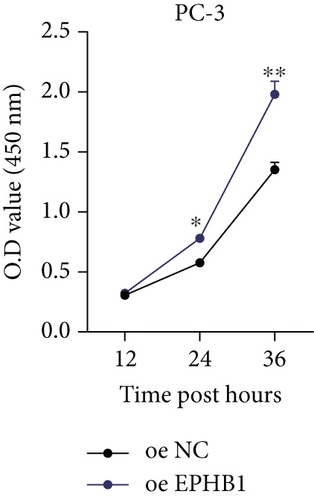
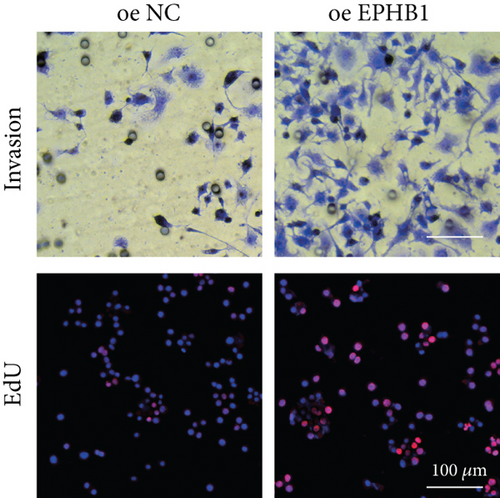
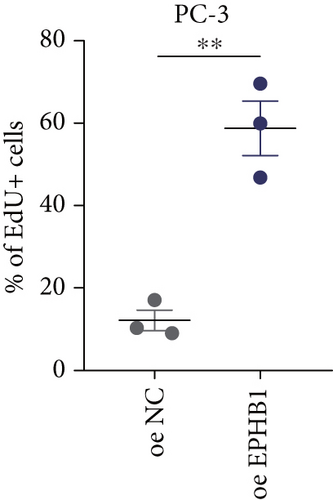
GSEA revealed that high-risk patients had significantly enriched DNA replication initiation, meiotic cell cycle phase transition, and DNA replication checkpoint signaling pathway activation (Figure S5A). The hallmark analysis showed that proliferation-related pathways, including E2Ftargets and the G2Mcheckpoint, were significantly activated in the high-risk group (Figure S5B), which also showed a significantly higher rate of nonsilent mutation, number of segments and fraction altered, proliferation, and homologous recombination defect score (p < 0.05, Figure S5C) and higher mutation frequencies of EPHB1, DCHS2, KIF13A, FBN3, CDH23, and CDK12 (Figure S5D). We observed a trend of upregulation of multiple genes (especially EPHB1 and KIF13A) in two PRAD cell lines (22RV1 and PC-3) (p < 0.05, Figure 2a,b), and EPHB1, with the highest mutation frequency, was also significantly upregulated in C4-2, DU145, and C4-2B tumor cells (p < 0.05, Figures 2c, 2d, and 2e). Based on median EPHB1, KM survival analysis demonstrated that patients with high EPHB1 had poor clinical outcomes (Figure 2f). After silencing EPHB1 in the 22RV1 and PC-3 cells, si-EPHB1#2 exhibited a higher silencing efficiency (Figure 3a,b). Meanwhile, cell viability (Figure 3c,d) and cell invasion activity (Figure 3e,f) were significantly reduced after 24 and 36 h of culture. In addition, the EdU method revealed lower cell proliferation in the si-EPHB1 group (Figure 3g,h), and EPHB1 was significantly overexpressed in the oeEPHB1 group with high overexpression efficiency of oeEPHB1 (Figure 3i). Overexpression of EPHB1 increased tumor cell viability (Figure 3j), invasion, and proliferation (Figures 3k, 3l, and 3m). These results indicate that high expression of EPHB1 affected the proliferation, invasion, and survival of tumor cells, suggesting its vital role in tumor progression in high-risk PRAD patients.



3.3. The EPHB1-GSK3B-SMAD3 Pathway Affected the Cell Viability and Apoptosis
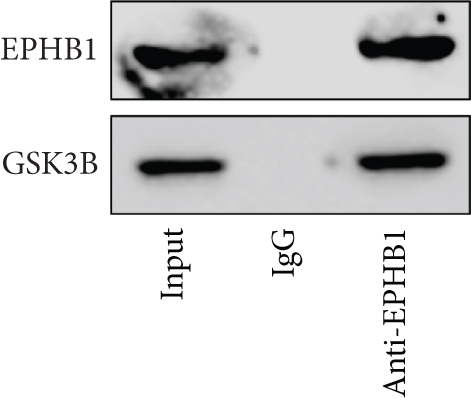
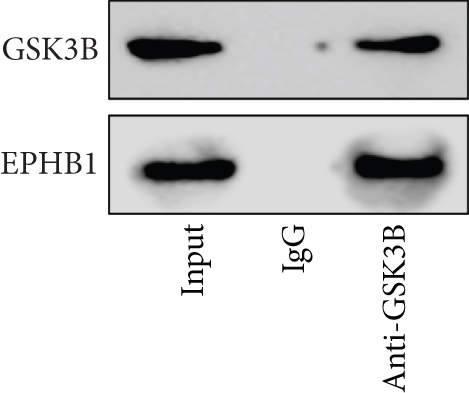
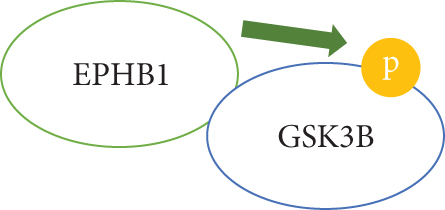
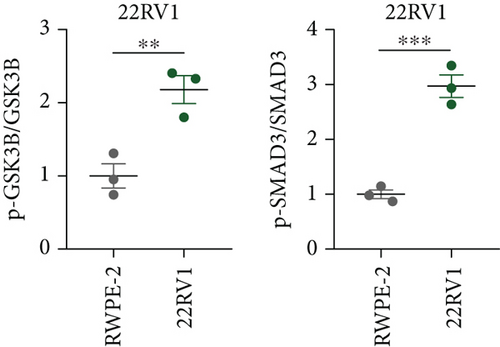
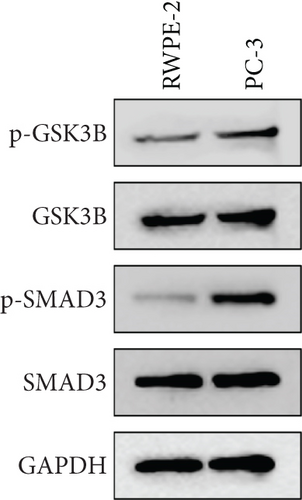
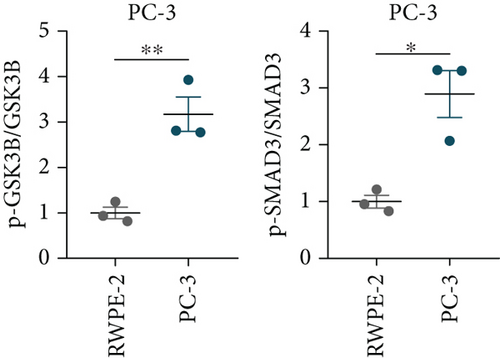
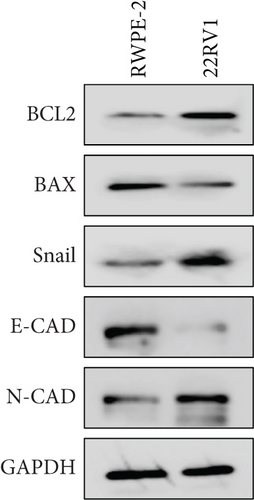
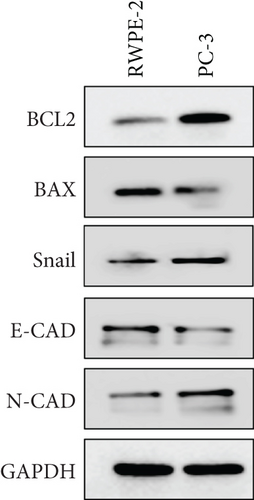
A Co-IP experiment was performed to detect the relationship between EPHB1 and GSK3B protein, which has been reported to be involved in apoptosis, migration, and invasion in prostate cancer [36], and the results confirmed the interaction between EPHB1 and GSK3B protein (Figure 4a,b). A previous study also showed that upregulated secreted frizzled-related protein 1 (sFRP1) in the prostatic tumor stroma [37] could restore the activity of glycogen synthase kinase 3β (GSK3β), whereas inhibition of GSK3β abolishes the regulation of sFRP1 on SMAD3 signaling and the aggressive phenotype of gastric cancer [38]. We found that GSK3B and the proliferative regulatory protein SMAD3 were phosphorylated substrates of the EPHB1 protein (Figure 4c). Here, western blot analysis showed that the expression of p-GSK3B and p-SMAD3 in 22RV1 cells (Figure 4d,e) and PC-3 tumor cells (Figure 4f,g) was significantly upregulated compared to that in RWPE-2 cells, suggesting that the EPHB1-GSK3B-SMAD3 signaling pathway was activated during PRAD development. The expression of the antiapoptotic protein BCL2 and proinvasion-related proteins Snail and N-CAD was upregulated in 22RV1 and PC-3 tumor cells, while those of the proapoptotic protein BAX and invasion-related protein E-CAD were downregulated (Figures 5a, 5b, 5c, and 5d).



3.4. GSK3B Downregulation Inhibited Cell Viability and Promoted Expressions of Proapoptotic Proteins
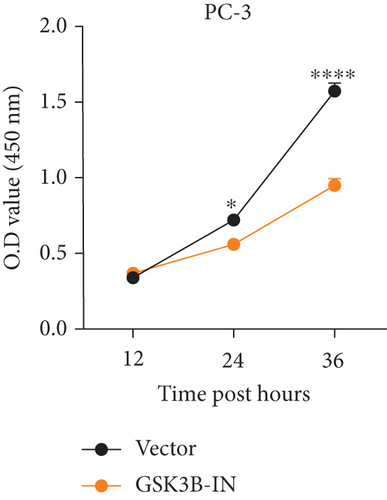
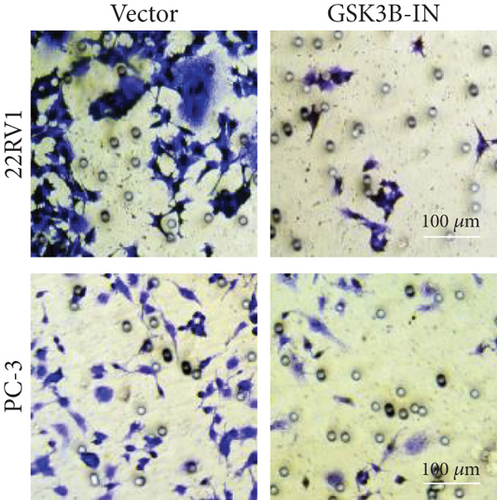
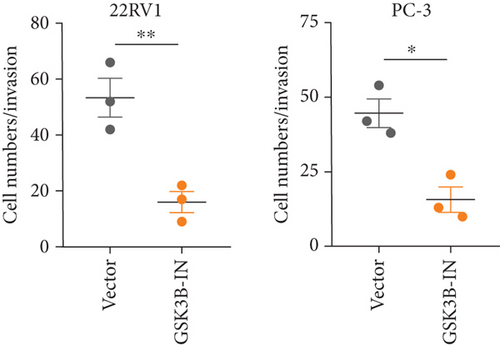
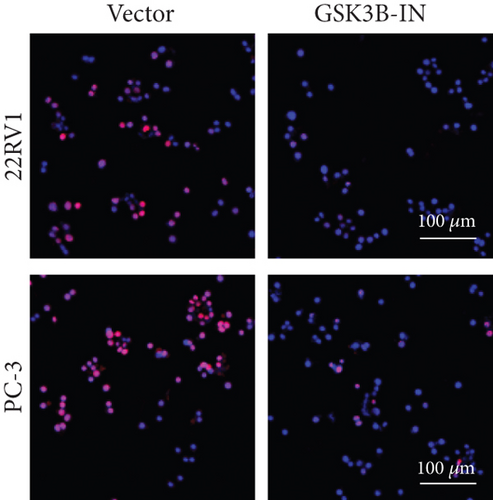
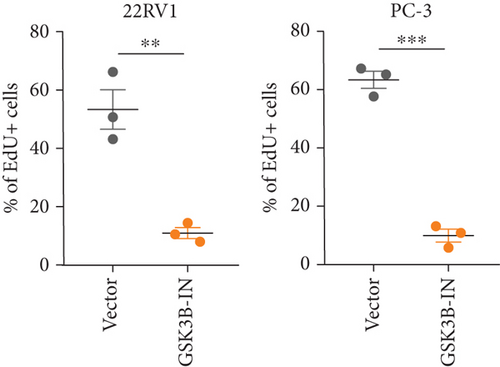
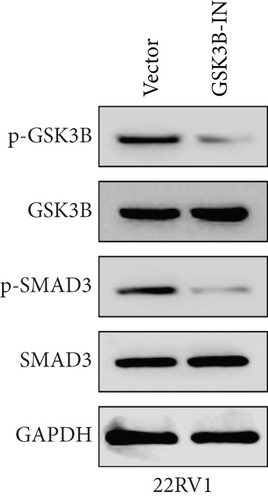
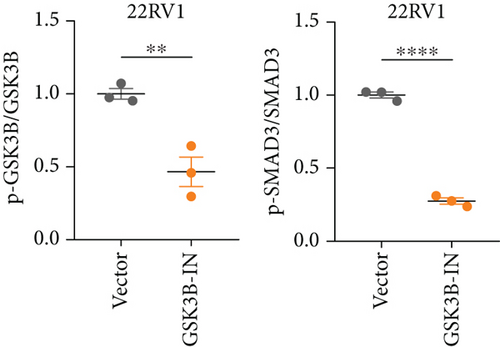
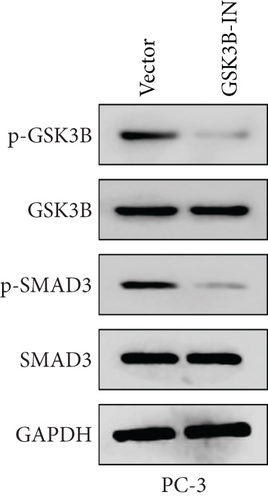
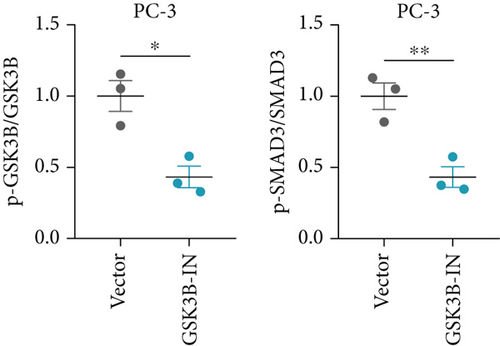
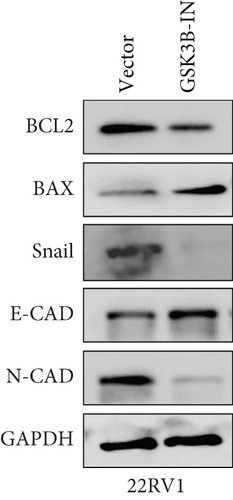
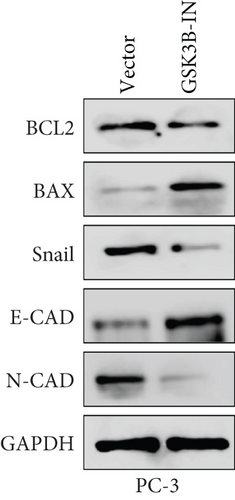
We used inhibitor for in-vitro GSK3B intervention (GSK3B-IN) assay; the viability of 22RV1 and PC-3 cells was significantly inhibited after 24 and 36 h of culture in the GSK3B-IN group (p < 0.05, Figure 6a,b), and the cell invasion and proliferation activities were also inhibited (Figures 6c, 6d, 6e, and 6f). Meanwhile, we also examined the effect of GSK3B inhibition on p-GSK3B and p-SMAD3 expression. GSK3B inhibition significantly suppressed the levels of p-SMAD3, BCL2, Snail, and N-CAD (Figures 7a, 7b, 7c, and 7d) but promoted the expression of BAX and E-CAD in 22RV1 and PC-3 cells after GSK3B-IN interference (Figures 8a, 8b, 8c, and 8d).



3.5. EPHB1 and GSK3B Expression Promoted Macrophage M2 Polarization
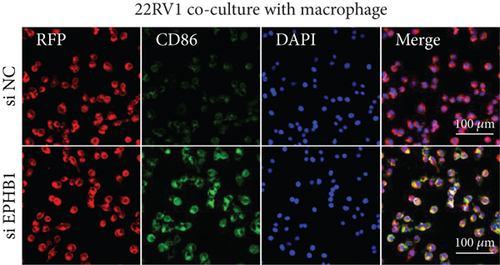
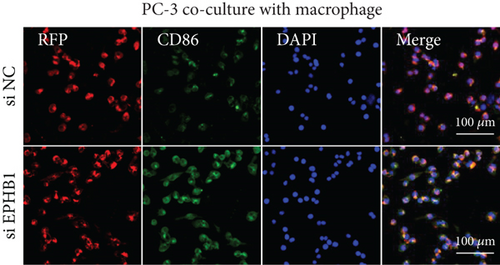
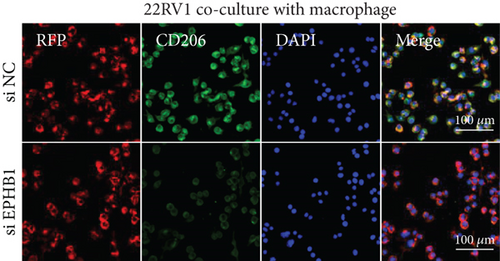
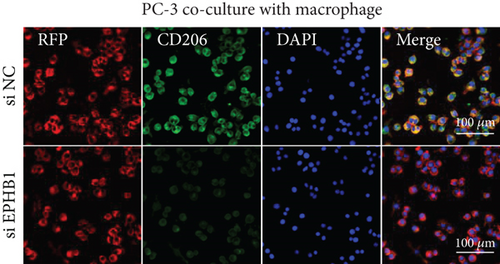
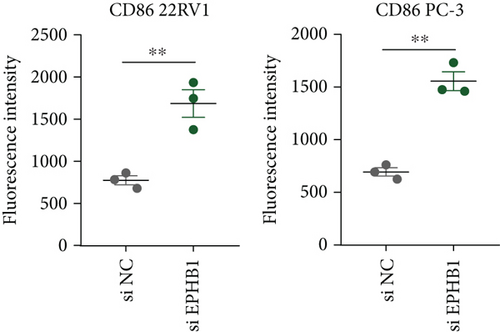
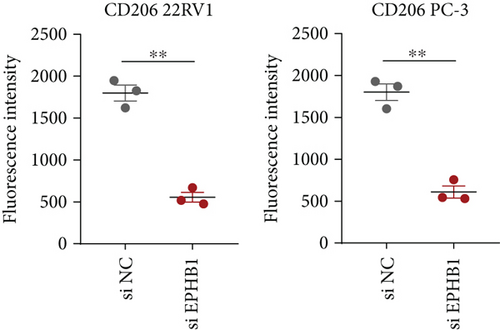
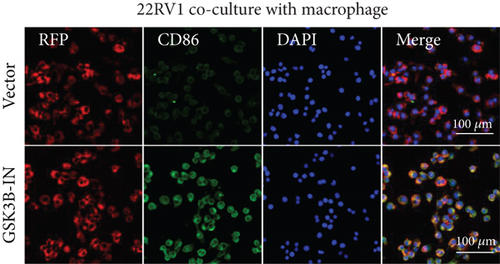
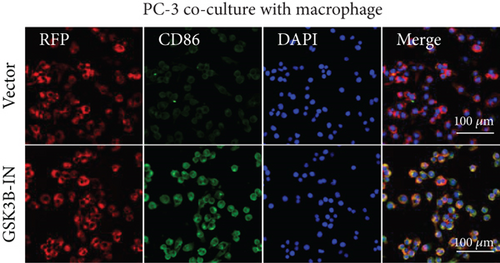
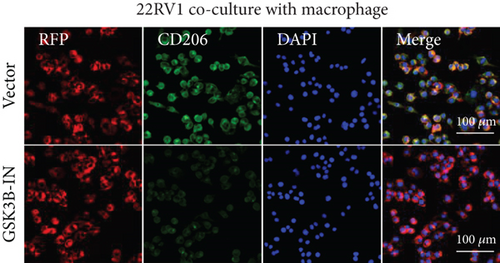
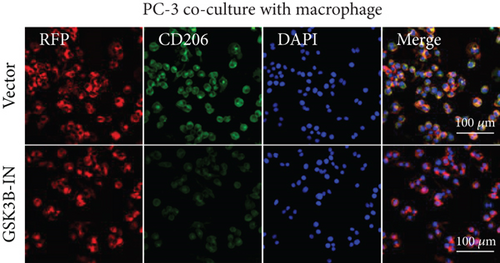
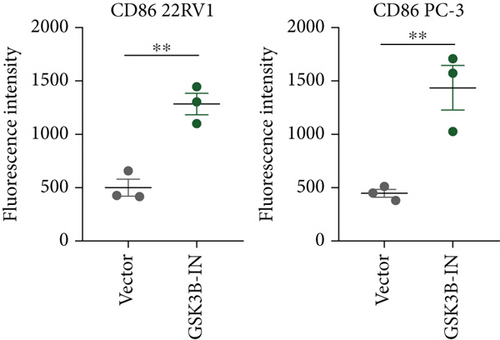
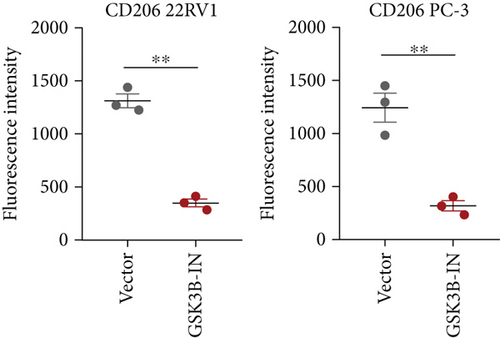
After the coculture of 22RV1/PC-3 cells and macrophages, we found that 22RV1 cells reduced the number of macrophages expressing the CD86 marker, whereas 22RV1 cells with si-EPHB1 upregulated the percentage of CD86+ macrophages (Figure 9a). Consistently, the cells of PC-3 cocultured with macrophages showed similar results (Figure 9b). In addition, we found that 22RV1/PC-3 cells cocultured with macrophages upregulated the percentage of CD206+ macrophages and that tumor cells with si-EPHB1 inhibited the percentage of CD206+ macrophages (Figure 9c,d). These findings suggest that the tumor cells induced macrophage polarization to the M2 type (CD206 marker), while si-EPHB1 silencing in tumor cells mediated M1 macrophage polarization (CD86 marker) (Figure 9e,f). At the same time, consistent results were observed in the GSK3B-IN groups in that GSK3B downregulation mediated macrophage M1 polarization (CD86 marker) in tumor cells (Figures 10a, 10b, 10c, 10d, 10e, and 10f).
3.6. Immune Infiltration Features in the High- and Low-Risk Groups
A comparison of the differences in tumor microenvironment (TME) revealed that the immune, stromal, and ESTIMATE scores were significantly higher in the low-risk group (p < 0.05, Figure S6A), indicating fewer stromal and immune components in the high-risk group. The CIBERSORT algorithm revealed significantly low levels of CD4 memory resting T cells and high levels of T cell regulatory cells (Tregs), activated NK cells, and M2 macrophage infiltration in the high-risk group (p < 0.05, Figure S6B). In addition, ssGSEA data demonstrated that the enrichment scores of most immune cells, such as activated B cells, effector memory CD8 T cells, memory B cells, regulatory T cells, and neutrophils, were significantly higher in the low-risk group (Figure S6C). The immune checkpoint genes BTLA, CD27, CD28, CTLA4, VTCN1, SIRPA, and LGALS9 were highly expressed in the low-risk group (p < 0.05; Figure S6D), indicating that low-risk patients may benefit from immune checkpoint blocking therapy. TMB analysis showed that high-risk patients had significantly higher TMB scores (p < 0.05; Figure S6E), indicating that these patients were more sensitive to immunotherapy.
4. Discussion
PRAD is a common male malignancy with unfavorable treatment outcomes, especially in advanced patients who progress to castration-resistant PRAD (resistant to chemotherapy, radiotherapy, and ADT treatment) [39]. Currently, molecular markers have served as promising risk stratification tools for the prognostic and immune treatment response assessment [40, 41]. In this study, a prognostic risk score model was developed for PRAD. Specifically, we examined the function of the highly mutant gene EPHB1 and observed that overexpression of EPHB1 in PRAD cells upregulated the expression of antiapoptotic and invasion markers BCL2, Snail, and N-CAD proteins and promoted cell viability, proliferation, and invasion. Meanwhile, EPHB1 protein interaction with GSK3B protein enhanced the phosphorylation levels of GSK3B and SMAD3, while the knockdown of GSK3B reduced the phosphorylation of SMAD3. Based on these findings, it can be concluded that EPHB1 played a crucial role in activating the EPHB1-GSK3B-SMAD3 pathway to support PRAD progression. To the best of our knowledge, this may be a novel cancer-promoting signaling pathway in PRAD that has not been previously reported. Our findings provide a basic reference for understanding the mechanism of PRAD progression.
In our model, SLC5A8 upregulation reduced patients’ risk, but the upregulation of HOXC4 and PAQR6 increased patients’ risk, indicating their potential as molecular targets for gene therapy. SLC5A8 is a tumor-suppressive transporter in cervical cancer (CC), and its overexpression suppresses proliferation and induces apoptosis by inhibiting Wnt signaling [42] and arresting HeLa cells at the G1 phase [43]. Overexpression of SLC5A8 mediates apoptosis induction for the antitumor response in liver cancer [44]. The findings of Luo et al. are similar to our findings. They also found that the transcription factor Homeobox C4 (HOXC4) is a clinical biomarker for aggressive PRAD and that abnormal upregulation of HOXC4 aggravates PRAD progression [45]. PAQR6 is significantly upregulated in PRAD tissues and is closely associated with a higher pathological stage of the tumor, ratio of free-prostate-specific antigen/total-PSA, Gleason score, and shorter OS [46]. These findings support our findings that changes in the RiskScore were consistent with gene functions, and these model genes can be considered as potential target genes for PRAD therapy.
EPHB1 was the gene with the highest mutation frequency in high-risk patients, and high EPHB1 in the PRAD cells was closely associated with poor prognosis. We also observed that EPHB1 mediated cancer-promoting traits underlying PRAD progression. EPHB1 is a member of the receptor tyrosine kinases that mediate the Eph receptor and ligand signaling transduction to regulate cell migration, differentiation, adherence, apoptosis, and proliferation in cancer [47]. For example, SMAD2 activated by TGF-β signaling upregulates the expression of EPHB1, which further promotes epithelial–mesenchymal transition (EMT) by elevating CDH2 expression in lung cancer [48]. GSK3B encodes a serine–threonine kinase involved in stress and apoptotic pathways. Xu et al. showed that GSK3B, downregulated by miR-132-3p, enhances etoposide-induced cell apoptosis in breast cancer [49] and that upregulated SMAD3 promotes the expression of androgen receptor (AR), resulting in the development of CRPC [50]. To date, only a few studies have focused on the expression of EPHB1, GSK3B, and SMAD3 in PRAD. Our study demonstrated that downregulation of EPHB1 and GSK3B suppressed the phosphorylation of GSK3B protein and SMAD3 protein, respectively, and that EPHB1 played a crucial role in activating EPHB1-GSK3B-SMAD3 signaling and affecting PRAD progression.
As crucial components of the TME, tumor-infiltrating immune cells participate in PRAD progression and affect tumor treatment response [51]. According to antitumor immunity, PRAD is considered as “cold tumor” with tumor suppression defects, low immunological infiltration, and low antigen activation in a suppressive TME [52], whereas some specific TILs may accelerate the development [53]. ESTIMATE analysis revealed that high-risk PRAD patients with lower immune and stromal scores lacked immune-active components; however, Tregs, NK cell activation, and macrophage M2 infiltration were significantly higher in the high-risk group. High levels of Tregs in biopsy samples of PRAD have been observed to block autoreactive T cells for antitumor responses [54]. M2 macrophages normally have an immunosuppressive function that inhibits antitumor T cell activity and stimulates tumor angiogenesis [55]. The current study found that the knockdown of EPHB1 or inhibition of GSK3B promoted the fluorescence intensity of CD86 but reduced that of CD206 in PRAD cells cocultured with macrophages, indicating that EPHB1 and GSK3B were key risk factors for promoting PRAD progression. In addition, high NK cell activity could delay the castration-resistant progression of PRAD [56]; some reports have also shown its protumorigenic traits in a highly immunosuppressive TME because of functional plasticity [57]. Overall, Tregs and M2 macrophages contributed to the immunosuppressive TME in PRAD.
In addition, we also found that high-risk PRAD patients were associated with activated proliferation pathways, including the cell cycle, DNA duplication, and meiosis, which may be explained by the effect of EPHB1-GSK3B-SMAD3 signaling pathway activation on promoting tumor cell viability, invasion, and proliferative activity, macrophage M2 polarization, and inhibition of the expression of antiapoptotic proteins. Overall, this study reports a novel EPHB1-GSK3B-SMAD3 pathway and emphasizes its importance in PRAD progression. However, this study has some limitations. First, this study was mainly based on public databases for bioinformatics analysis and functional validation at the cellular level, and protein level expression validation of key molecules such as EPHB1, GSK3B, and p-SMAD3 has not yet been performed by clinical PRAD tissue samples, which lacks direct evidence support at the clinical sample level. Therefore, we will further collect primary and metastatic tissues from patients to assess the expression and localization of EPHB1 and its related pathway proteins by immunohistochemistry and immunofluorescence, in order to further validate their expression patterns and relevance in the clinicopathological state. In addition, although we found that EPHB1 interacts with GSK3B and that GSK3B knockdown affects the phosphorylation status of SMAD3, no direct evidence has been provided to confirm SMAD3 as a direct substrate of GSK3B. In the future, in vitro kinase assays, mutant construction, and mass spectrometry identification will be used to further clarify the direct regulatory relationship in the EPHB1-GSK3B-SMAD3 pathway. Finally, immune microenvironment regulation has only been initially observed through the coculture system of macrophages and PRAD cells with M1/M2 polarization, and a comprehensive analysis of immune cell profiles is still lacking, and the involvement of key inflammatory factors or immune killer cells has not been assessed. Single-cell RNA sequencing and spatial transcriptome technology will be introduced in the follow-up, combined with tumor tissue immune infiltration mapping, to systematically assess the remodeling effect of the EPHB1 pathway on the tumor immune microenvironment and to further clarify its effect on immune cells.
5. Conclusion
This study constructed a RiskScore and nomogram model with high classification efficiency and prediction accuracy based on apoptotic features in PRAD. EPHB1 is the gene with the highest mutation frequency and is highly expressed in high-risk PRAD patients, whereas the knockdown of EPHB1 inhibited cell viability, proliferation, invasion, and antiapoptotic activity. Meanwhile, EPHB1 protein interacted with GSK3B and further affected the phosphorylation of SMAD3; notably, EPHB1 and GSK3B functioned crucially in macrophage M2 polarization. In conclusion, this study emphasizes the significance of EPHB1-GSK3B-SMAD3 signaling in PRAD progression and provides a new theoretical basis and experimental support for future studies on the molecular mechanism of PRAD and the development of clinical treatment strategies for cancer.
Nomenclature
-
- PRAD
-
- prostate adenocarcinoma
-
- WGCNA
-
- weighted gene coexpression network analysis
-
- DEGs
-
- differentially expressed genes
-
- RT
-
- radiation therapy
-
- ADT
-
- androgen deprivation therapy
-
- TCGA
-
- The Cancer Genome Atlas
-
- MSigDB
-
- Molecular Signatures Database
-
- GSEA
-
- gene set enrichment analysis
-
- TILs
-
- tumor-infiltrating lymphocytes
-
- TMB
-
- tumor mutation burden
-
- KM
-
- Kaplan–Meier
-
- ROC
-
- receiver operating characteristic curve
-
- AUC
-
- area under curve
Ethics Statement
The authors have nothing to report.
Consent
The authors have nothing to report.
Conflicts of Interest
The authors declare no conflicts of interest.
Author Contributions
All authors contributed to the present work: B.X. and S.L. designed the study, and K.Y. acquired the data. K.Y. and B.X. improved the figure quality. S.L. and K.Y. drafted the manuscript. B.X. and S.L. revised the manuscript. All the authors have read and approved the manuscript.
Funding
This study was supported by a grant from the National Natural Science Foundation of China (Grant Number: 82203428).
Acknowledgments
The authors have nothing to report.
Supporting Information
Additional supporting information can be found online in the Supporting Information section.
Open Research
Data Availability Statement
The datasets generated and/or analyzed during the current study are available at MSigDB (https://www.gsea-msigdb.org/gsea/msigdb/).


