The Regulative Effect and Mechanism in a MetS Mice Model of Functional Components in Freeze-Dried Powder from Phyllanthus emblica L. Fruit
Abstract
The medicinal plant Phyllanthus emblica Linn. has been recognized for its health-beneficial properties and has a long history of cultivation in ancient China and India. However, its effects and main mechanism in high-fat diet (HFD)-induced metabolic syndrome (MetS) have not been revealed yet. According to our findings, emblica fruit powder (EFP) through the freeze-drying process was able to modulate the composition of the intestinal microbiota, with a significant increase in the beneficial bacteria genera Lactobacillus and Turicibacter. In addition, fecal metabolite profiling revealed that 20 metabolites were deferentially expressed, which were mainly organic acids, amino acids, and their derivatives. They are primarily enriched in the biological process of lipid metabolism, including the metabolism process of cholic acid, glycerophospholipid, and α-linoleic acid. Subsequent qPCR testing of the liver tissue suggested that the regulatory effects of EFP in HFD mice may stem from its influence on the expression levels of over 20 key genes involved in host metabolic processes. In conclusion, EFP is able to alleviate the MetS caused by HFD, and this positive impact may be partially through the regulation of the “gut-liver axis.” Consequently, EFP holds potential as a functional food ingredient for the prevention and management of MetS.
1. Introduction
Metabolic syndrome (MetS) is characterized by a bunch of metabolic risk factors, including obesity, unbalanced blood lipids, hypertension, and insulin resistance, which has caused special attention in public health management [1]. If these risk factors are ignored without treatment, they will often develop into larger metabolic defects such as type-II diabetes and NAFLD, as well as severe cardiovascular diseases [2]. Some kinds of nutrition plans are proven to have major positive regulatory effects on this syndrome, and physical exercise also has a synergistic effect [3–5]. The Mediterranean diet and plant-based diet showed improved health in MetS patients [6]. Its mechanism is related to the composition of the diet, which is relatively low in carbohydrates and cholesterol but rich in unsaturated fatty acids and phytochemicals. They exert a direct regulative effect on the human metabolism; in addition, they also have an impact on the gut microorganism, which can further lead to the variation of metabolites. Evidence showed that a series of processes enable the gut microbiota to be linked to and interact with host metabolism, such as defected gut barrier function, the ejection of bile acid, the use of antibiotics, and the shift of metabolites of the total microorganism [7]. The “gut-centric theory” of MetS started to be mentioned in a wide number of studies on both animals and humans, showing that long-term high-fat diet consumption causes defects in the intestinal barrier, and these defects thus facilitate the transfer of intestinal contents into the host circulation.
Phyllanthus emblica Linn. is one of the most ancient medicine and food herbs, both in China and India. The study suggested that its fruit contains tannins, vitamin C, alkaloids, phenolic compounds, and several kinds of organic acids, such as gallic acid, ellagic acid, citric acid, and chebulagic acid, as well as polysaccharides such as pectin [8]. It also includes flavonoids such as quercetin and kaempferol rhamnopyranoside. Phytochemicals are complicated in the fruit, and many components are functional factors in the regulative action in vivo [9–11]. In addition, these functional factors have been demonstrated to have health-regulating effects in animal models, and many of them even possess the ability to affect gut microorganisms to ultimately balance the metabolism of the host [12, 13].
Vacuum freeze-drying technology achieves drying purposes by using the sublimation property of water under low temperature and high vacuum conditions. Vacuum freeze-drying has almost zero damage to proteins and vitamins A and D and only 5% loss of water-soluble vitamins such as vitamin C, thus preserving nutrients in food to the greatest extent [14]. It is often challenging to dehydrate fruits with waxy impermeable skin, such as Phyllanthus emblica L., which is also a delicate fruit containing natural antioxidants, polyphenols, and lots of organic acids. The adoption of this technology for the preparation of freeze-dried fruit powder can retain its nutrients and flavor to the greatest extent, prolong its storage life, and expand its market as an ingredient in the pharmaceutical or functional food industries.
However, no previous data are available on the functional components of the vacuum freeze-drying fruit powder, its regulative effect in the Mets model, or its underlying mechanism. To the best of our knowledge, the effects and mechanisms of the functional components in this fruit have not been explained. Therefore, this paper will focus on these questions with the hope of providing a scientific foundation for the future application of Phyllanthus emblica L. fruit in the health food industry.
2. Materials and Methods
2.1. The Production of Freeze-Dried Fruit Powder
Fresh fruits, picked in Shantou Lvsheng Fruit Co., Ltd., China, with no drying shrinkage, no browning, no mechanical damage, no rot, and no deterioration, were selected and washed using drinking water. The cores were removed with a pitter, and then each fruit was cut into four equal parts. The cleaned pulps were then neatly placed on the freeze-dried bin tray, sealed with plastic wrap, and then sent for a 12-h prefreeze at −40°C. After the prefreezing process, the whole tray together with the fruit pulp was taken out and put into the freeze-drying bin of the machine (LGJ-30fd, Beijing Yaxing Instruments Co. Ltd., China) for a freeze-drying process for 8 hours. The temperatures of the cold trap and the heating plate were set to −40°C and 60°C, respectively, and the vacuum degree was set to 65 Pa. The freeze-dried pulps were further taken out for a high-speed smash using a crusher (RS-FS1612, Roystar Co., Ltd., China) and immediately transferred into a vacuum bag. After the vacuum process, using an automatic vacuum package machine (ZK-8828, Siemens Co., Ltd., Germany), the emblica fruit powder (EFP) was prepared, ready for the detection of water-soluble functional components and feeding experiments.
2.2. HPLC Detection of Water-Soluble Functional Components
To detect the functional components in the freeze-dried fruit powder, the HPLC-MS method was introduced. Accurately weighed 1.0000 g of fruit powder was mixed with 10 mL of methanol, and ultrasound was performed for 10 min. The filtering process was followed, and the filtrate was then transferred to the rotary evaporator. The left solution was further dissolved with methanol, transferred to a 25-mL bottle, and stored at a low temperature for later use. 0.5 mg/mL of standard solutions of gallic acid, epigallocatechin, caffeic acid, catechin gallate, chebulagic acid, and ellagic acid (all purchased from the Agilent online store and ≥98%) dissolved in methanol were prepared for qualitative identification.
2.3. Animals and Treatments
Male C57BL/6J mice, approximately one month old and weighting about 20 g, were purchased from Hunan SJA Laboratory Animal Co., Ltd. (Changsha, China). The animals were maintained under a half-day light-dark cycle at controlled temperature (22 ± 2°C) and humidity (55 ± 5%). Mice had free access to food. After a week of acclimation, they were separated into three groups according to the random number method: Con (laboratory standard diet, 69% carbohydrates, 20% protein, and 10% fat), HFD (high-fat diet, 54.5% carbohydrates, 19.5% protein, and 24% fat), and HFD + EFP (high-fat diet and intragastrically administrated with 1000 mg/kg of EFP solution daily). Each group received an equal volume of water daily. Body weight was measured weekly. In the 13th week, an oral glucose tolerance test was conducted. By the 14th week, body functions had stabilized, fecal samples were collected, and the mice were sacrificed for the blood and tissue collection. Mice were fasted for 12 h before being sacrificed but had free access to water. The study was approved by the Ethics Committee of Hanshan Normal University (Nr. 2024030806). The laboratory diet and HFD diet were the same in our previous study [15]. In addition, after the fecal sample collection, the dissection process and the handle of the organ and blood sample were also the same as the study.
2.4. Glucose Tolerance Test (OGTT) and Biochemical Assays
At the 13th week, the mice were first injected intragastrically with glucose (2 g kg−1, BW). Blood was then gathered from the tail vein at different times (0, 30, 60, 90, and 120 min) after glucose gavage and analyzed for glucose levels by a blood glucose meter (Roche Diabetes Care GmbH, Germany). Blood was collected from anesthetized mice by ophthalmic drainage and placed in a 4°C refrigerator. Whole blood was centrifuged (4°C, 3100 rpm) for 15 minutes, and the supernatant was used for subsequent studies. The blood serum was further detected for triglyceride (TG), total cholesterol (TC), high-density lipoprotein cholesterol (HDL-C), and low-density lipoprotein cholesterol (LDL-C) levels using the corresponding kit (Nanjing Jiancheng Bioengineering Institute, Nanjing, Jiangsu, China), and serum insulin was measured using the insulin ELISA kit (Shanghai Jianglai Co., Ltd., Shanghai, China). Insulin resistance assessment (HOMA-IR) was performed according to the universal formula, which could be calculated as follows: fasting insulin level (mIU/L) × fasting blood glucose level (mmol/L)/22.5.
2.5. Histopathological Analysis
Liver and adipose tissues after drying and immobilizing process were sectioned into a thick piece and embedded after fixation in 4% (v/v) paraformaldehyde solution; adipose tissues were stained with hematoxylin and eosin (H & E), and liver tissues were stained with oil red O. Images were accessed from a microscopy imaging system.
2.6. 16s rRNA Sequencing
The total DNA of the gut microbiota was extracted using an Omega Bio-tek DNA isolation kit (Norcross, United States). Its concentration was determined by a Nanodrop instrument (Thermo Fisher Scientific, United States), and its integrity was assessed by electrophoresis on 2% agar gel. The two universal primers (5′ ACTCCTACGGGAGGCAGCAG3′ and 5′GGACTACHVGGGTWTCTAAT3′) were used for amplifying the V3-V4 regions of the bacterial 16S rRNA gene using ABI Gene Amp 9700 (Thermo Fisher Scientific, United States). PE reads sequenced by Nextseq 500 (Illumina, United States) were first handled based on overlap, and the data were controlled and filtered. The analysis of the OTU cluster and species taxonomic was performed after the samples were distinguished. Multiple diversity index analyses could be conducted based on OTU cluster analysis. All the data were analyzed using the online tool of the Majorbio cloud platform (https://cloud.majorbio.com/page/tools/).
2.7. Untargeted Metabolomics Profiling
After precisely weighing 50 mg of fecal samples, the metabolites were extracted using an 80% (v/v) methanol/water solution, with an internal standard solution. The extracts were then subjected to ultrasonic tissue fragmentation and centrifugation. Equal quantities of each sample were mixed to create the quality control sample (QC). All prepared samples as well as the QC sample were injected for LC-MS analysis using the UHPLC-Q Exactive system (Thermo Fisher Scientific, America). The mass spectrometric data were collected using a Thermo UHPLC-Q Exactive Mass Spectrometer equipped with an electrospray ionization (ESI) source operating in either positive or negative ion mode. Data acquisition was performed in the data dependent acquisition (DDA) mode. The raw LC/MS data were preprocessed using the Progenesis QI (Waters Corporation, Milford, USA) software. Metabolites identification and search were conducted primarily through the HMDB (https://www.hmdb.ca/), METLIN (https://metlin.scripps.edu/), and Majorbio databases. Subsequent bioinformatic analysis of the collected data was performed on the Majorbio cloud platform [16]. Metabolites with VIP ≥1.0 and p value ≤0.05 were considered significantly altered.
2.8. Hepatic Gene Expression Analysis
The total RNA was extracted using Trizol reagent, and the concentration and the quality of RNA were determined. The cDNA was then reverse-transcribed by using the total RNA as a template. The primer sequences are shown in Table 1. The qPCR conditions were set as follows: initial denaturation at 95°C for 5 minutes, followed by 39 cycles of denaturation at 95°C for 10 seconds, annealing at 56°C for 10 seconds, and extension at 72°C for 30 seconds. β-actin was used as the internal control gene, and the relative expression levels were expressed by 2−ΔΔCt.
| Gene name | Sense (5′-3′) | Antisense (5′-3′) |
|---|---|---|
| LPL | TTGTAGTAGACTGGTTGTATCGGGC | AAATCAGCGTCATCAGGAGAAAG |
| SIRT1 | CGAGGTCCATATACTTTTGTTCAG | GCGTCATATCATCCAGCTCAG |
| Acot13 | CAGGGCTGAGTGGATGATCG | GCAGACGTGGGACCAAAGAAG |
| Slc2a5 | GGCCTTCAGCTCCTCCTCCTC | TTCTCAGCCTCATCCTCCTTCCG |
| Gck | AGGCACGAAGACATAGACAAGG | TCTCGGAGAAGTCCCACGAT |
| Lpin1 | GGAGCTGCGAGAATGGAAAG | GCCTTCCTCCTCCTTTTCCT |
| Fasn | GGAGGTTGCTTGGAAGAG | CTGGATGTGATCGAATGCT |
| Pklr | CCCGAGATACGCACTGGAG | CGACCTGGGTGATATTGTGGT |
| Ppp1r3g | AGTCAGGGGACTCTGGATCAA | CACAGCGAGAAGTGGAAACG |
| Elovl5 | GGTGGCTGTTCTTCCAGATT | CCCTTC AGGTTC GGTCTTTCC |
| Fads1 | TCAGTCTTTGGCACCTCGAC | TCCTTGCGGAAGCAGTTAGG |
| Fads2 | GGACTTCGTGGGCAAGTTCT | CAGTGCCGAAGTACGAGAGG |
| SIRT4 | GGTCCTCTGCTTGGATTGTG | CCTCGGTGAGAAAGACATCG |
| Akt2 | ACGTGGTGAATACATCAAGACC | GGGCCTCTCCTTATACCCAAT |
| PPARα | GAGCTGCAAGATTCAGAAGAAG | GAATCTTTCAGGTCGTGTTCAC |
| Cyp1b1 | CACCAGCCTTAGTGCAGACAG | GAGGACCACGGTTTCCGTTG |
| Cyp2f2 | GGACCCAAACCTCTCCCAATC | CCGTGAACACCGACCCATAC |
2.9. Statistical Analysis
The statistical analysis of the whole study was conducted with SPSS Statistics (version 26.0). Data were expressed as the mean ± SD. Differences between the two groups were analyzed by an independent Student’s t-test. Statistical significance was evaluated by one-way analysis of variance (one-way ANOVA). A two-tailed p value <0.05 was considered statistically significant. The GraphPad Prism 8 software (GraphPad software, La Jolla, CA, USA) was used for drawing graphs and other analyses.
3. Results
3.1. Water-Soluble Functional Components in EFP
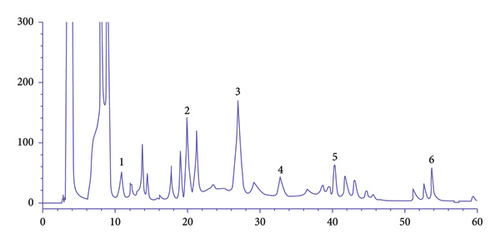
In order to identify the functional components in the freeze-dried fruit powder, the HPLC method was introduced, and the TIC diagram was shown in Figure 1. Six major components were identified using the standard substances, namely gallic acid, epigallocatechin, caffeic acid, catechin gallate, chebulagic acid, and ellagic acid, respectively. It can be seen clearly that the water-soluble functions are all capable of exerting a beneficial regulative effect on the metabolism of the body. In conclusion, it is quite wasteful to evaluate the balance effect of one single composition of EFP on metabolism, and it is thus more efficient to use the emblica fruit powder as a whole in practice.
3.2. Effect of EFP on the Body Weight and Mets-Related Phenotypes
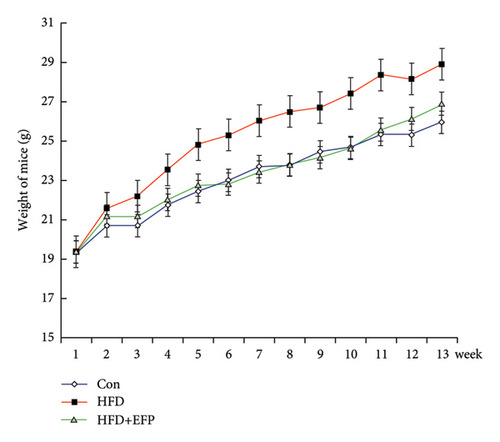
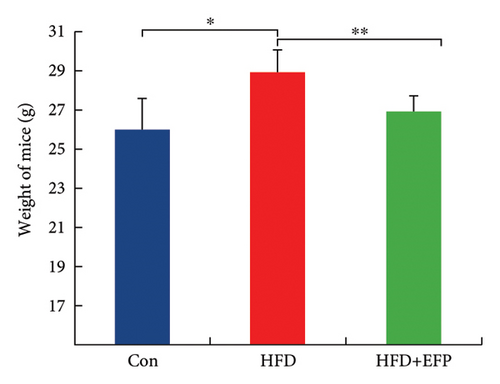
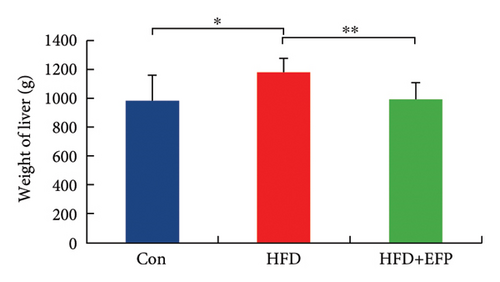
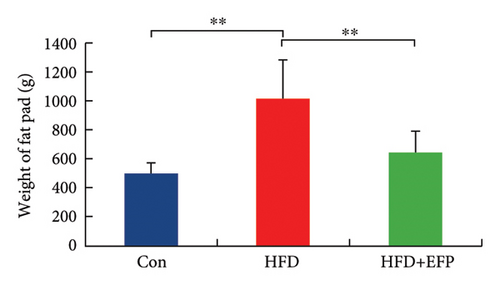
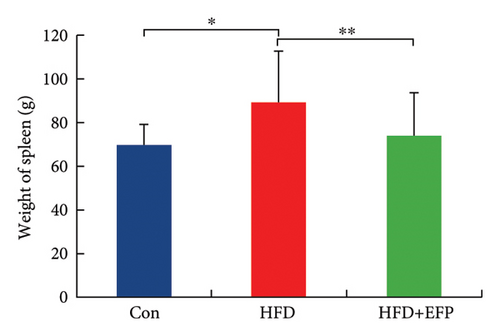
All three groups of mice exhibited an upward trend in body weight throughout the 12-week feeding period, and the body weight of HFD mice increased the fastest among the three groups, whereas the consumption of EFP could slow down this trend (Figure 2(a)). HFD led to a significant increase not only in the size but also in the weight of the liver, abdominal fat pad, and spleen compared to those of the Con group (p < 0.05). However, compared with the HFD group, mice in the HFD + EFP group showed considerable reductions in the size of the liver, abdominal fat pad, and spleen (Figures 2(b), 2(c), and 2(d)) and a significant reduction in body weight, liver weight, abdominal fat pad weight, and spleen weight (p < 0.01).


3.3. EFP Balanced the Serum Lipid Level and Ameliorated Tissue Damage
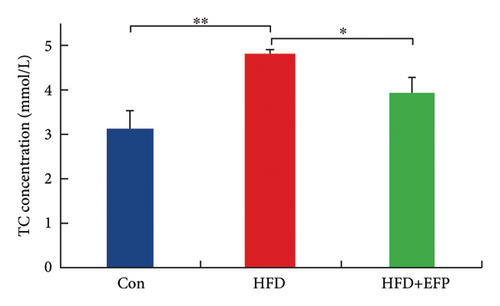
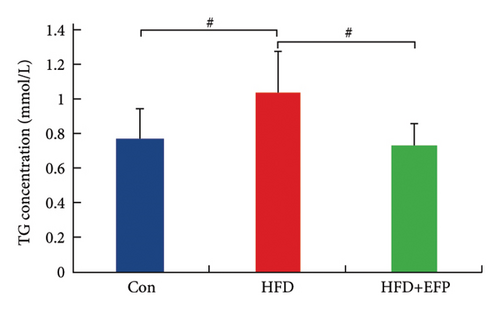
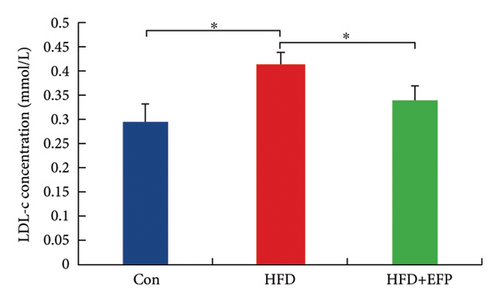
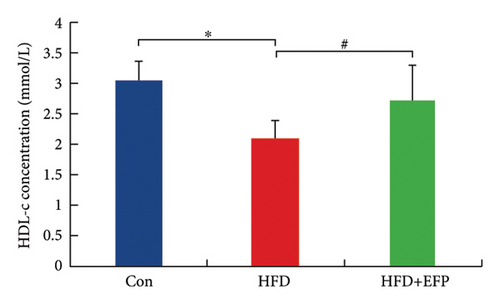
After the sacrifice of mice, the levels of serum lipids were tested. Levels of TC (4.77 ± 0.12 mmol/L) and LDL-C (0.405 ± 0.032 mmol/L) in the HFD group were significantly higher than the Con group (p < 0.01 and p < 0.05, respectively), and EFP intake significantly reduced their levels to 3.88 ± 0.38 mmol/L, 0.73 ± 0.13 mmol/L, and 0.34 ± 0.024 mmol/L, respectively (all p < 0.05). EFP also exerts a positive regulatory effect on TG and HDL-C; however, it is not statistically significant. The results, as shown in Figures 3(a), 3(b), 3(c), and 3(d), indicated that EFP intake leads to a reversal of high-fat diet-induced abnormal serum lipid levels. From H & E staining images (Figure 3(e)), normal liver cells are uniform in size, have abundant cytoplasm, are nearly round, have central nucleus, and have no lipid droplet accumulation. However, the hepatic cells of HFD mice showed significant changes, which are markedly enlarged and have large numbers of lipid droplets in the cytoplasm. The fusion of the lipid droplets led to displacement or even disappearance of the nucleus, and hyper-pigmentation occurred in some parts of the section. Moreover, the oil-red O-stained picture of the HFD group mice showed clear fatty degeneration of the liver in the cytoplasm of hepatocytes (Figure 3(g)). In normal mice, there was almost no accumulation of lipid droplets in the liver, whereas HFD-fed mice showed a significant increase in lipid drops and red plaques, and those of the HFD + EFP group mice achieved a dramatic reduction in the number and size of lipid droplets and red plaques. In contrast to the Con group, a high-fat diet caused more noticeable epididymal fat deposition, while EFP therapy dramatically decreased the size of retroperitoneal adipose tissue (Figure 3(f)). To sum up, EFP treatment clearly improved plasma lipid distribution and ameliorated HFD-induced tissue damage.


3.4. EFP Improved the Glucose Metabolism Disorder
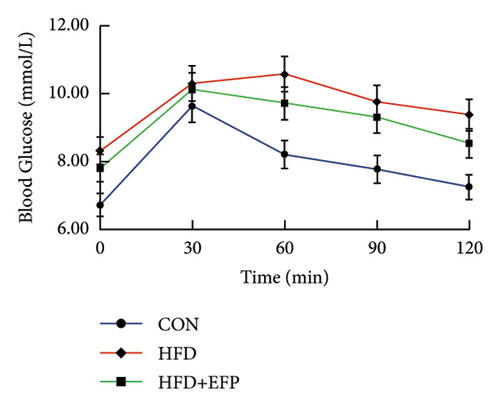
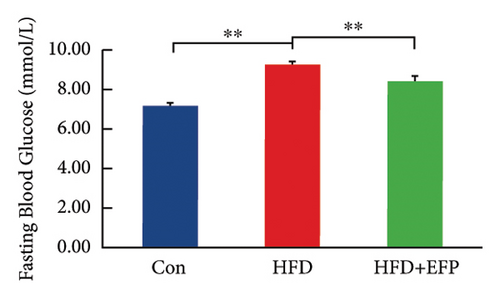
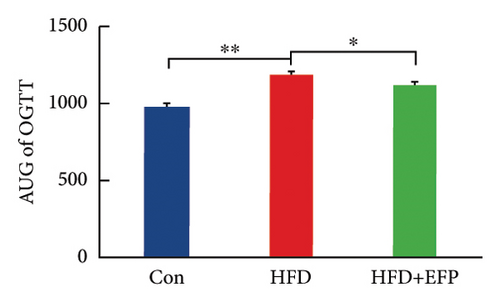
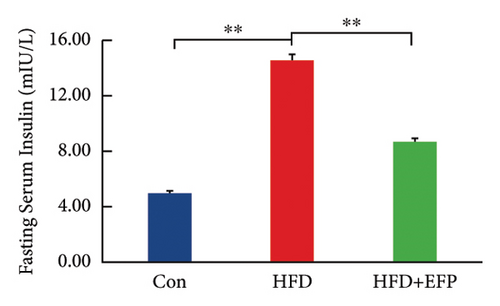
To investigate the effect of EFP on glucose tolerance, an OGTT test was performed. The blood glucose levels during the experiment and at the end of the experiment, the AUC of OGTT, the fasting insulin level, and the HOMA-IR of HFD mice are all significantly higher than the mice of the Con group. The significant increase in the AUC of HFD mice indicates that HFD mice develop glucose intolerance, and the significant increase in HOMA-IR indicates that they develop obvious insulin resistance. When compared with the HFD group, the glucose tolerance was better in the HFD + EFP group. Fasting blood glucose, the area under the curve (AUC) of OGTT, and fasting serum insulin were visibly reduced in the HFD + EFP group (p < 0.05) (Figures 4(b) and 4(d)). In addition, the fasting blood and the HOMA-IR index were significantly lower after EFP treatment compared with the HFD group (both p < 0.01) (Figures 4(d) and 4(e)). The above results showed that EFP modified the impaired glucose tolerance caused by the high-fat diet.

3.5. EFP Regulated the Composition of the Gut Microbiota
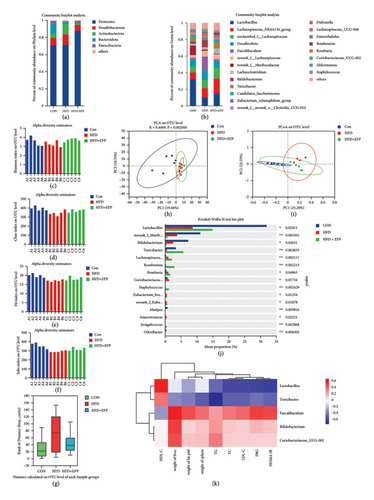
16s rRNA sequencing was performed to evaluate alterations of gut microbiota caused by HFD and EFP. The ratio of Firmicutes and Bacteroides was significantly increased after consumption of HFD; however, HFD + EFP exerted a weak impact on this ratio (Figure 5(a)). Compared with the Con group, mice in the HFD group showed a significant decrease in Shannon, Chao, Pd, and Sobs indexes, which were essentially restored after EFP intervention, which indicated that HFD resulted in a decrease in the diversity of the gut microbiota of the mice, and EFP intake could indeed reverse this trend and increase the diversity of gut microbiota to a certain degree (see Figures 5(c), 5(d), 5(e), and 5(f)). This conclusion could be further proved by the distance calculation result (Figure 5(g)). Principal component analysis (PCA) revealed that PC1 and PC2 were shown to explain 19.66% and 10.55% of the variance, respectively (Figure 5(h)). Principal coordinate analysis (PCoA) revealed that PC1 and PC2 were shown to explain 25.28% and 22.55% of the variance, respectively (Figure 5(i)). As shown in the two images, the composition of the microbiota on the OTU level of the HFD + EFP group was close to the CON group along both the PC1 and PC2 directions and relatively far from the HFD group, which indicated that HFD significantly altered the intestinal microbiota composition, and EFP intervention could regulate this shift. The relative abundance analysis further revealed the changes of dominant taxa at the phylum and genus levels, which also proved the function of EFP. HFD caused a significant increase in the abundance of Faecalibaculum and Coriobacteriaceae_UCG-002 and its decrease in Lactobacillus and Turicibacter, while EFP intake can significantly reverse this trend on the genus level (Figures 5(b) and 5(j)). In order to further determine the relationship between the relative abundance of differentially existing OTUs of the gut microbiome and significant changes in biochemical indexes of mice, Spearman correlation analyses were performed. Lactobacillus and Turicibacter were positively correlated with serum HDL-C and negatively correlated with other indexes. Faecalibaculum, Bifidobacterium, and Coriobacteriaceae were negatively correlated with serum HDL-C and positively correlated with other indexes (Figure 5(k)). It showed that HFD-caused composition change of gut microbiota is closely linked to abnormal physiological measures of MetS, and the regulative effect of EFP is partially through its regulation of gut microbiota.
3.6. EFP Modulated Metabolites of Gut Microbiota
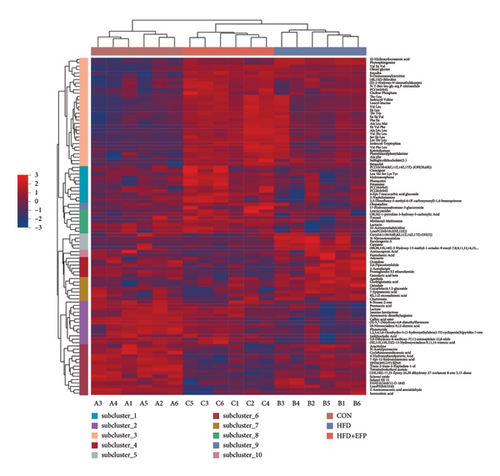
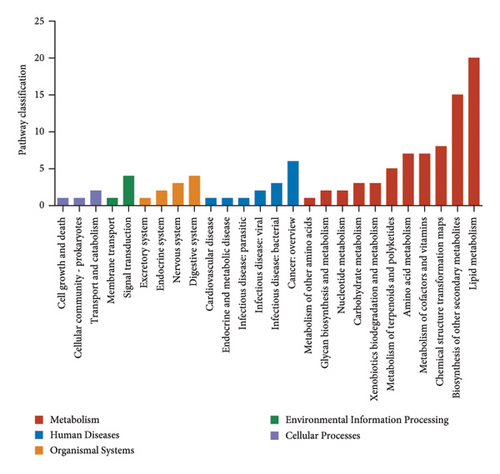
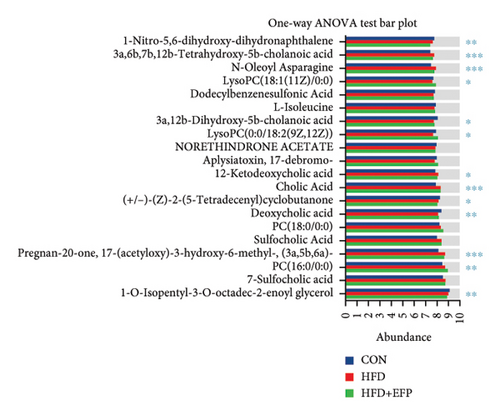
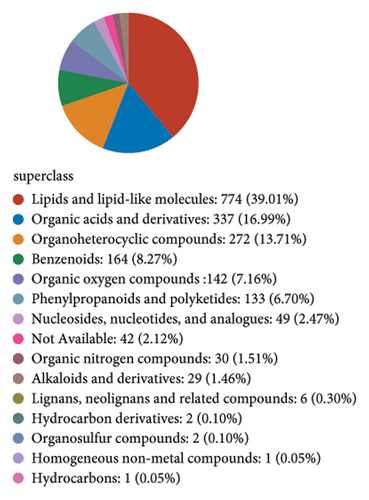
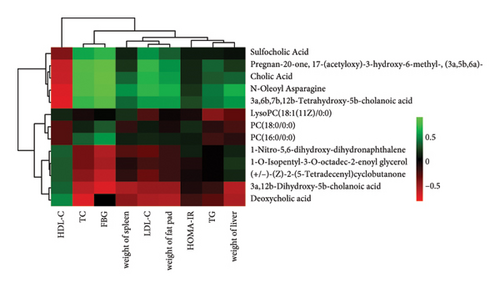
In order to explore the variation of metabolites caused by the modulative effect of EFP on the composition change of gut microorganisms, semiquantitative metabonomic analysis was performed using the UHPLC-MS/MS method. Results showed that 90 kinds of metabolites of microorganisms were selected as VIPs, which were down-regulated by HFD and up-regulated by EFP or vice versa. These VIPs are mostly peptides and organic acids (Figure 6(a)). In the aspect of the highest expressed level, 20 differentially expressed metabolites were further identified, which included several kinds of amino acids and their derivatives, such as L-isoleucine and N-Oleoyl Asparagine, and several kinds of important intermediate products of lipids metabolism, such as cholic acid and 5 kinds of its derivatives (Figure 6(d)). The identified differentially expressed metabolites were categorized and counted according to the chemical classification attribution information. As shown in Figure 6(e), the content of lipids and lipid-like molecules accounted for the largest part among all metabolites (39.14%), organic acids and their derivatives took the second highest place at 21.52%, and organoheterocyclic compounds were the third highest, with a percentage of 12.66%. Go analysis further indicated that differentially expressed metabolites exert the most impact on the body metabolism, especially lipid metabolism (Figure 6(b)), and KEGG analysis found that the differentially expressed metabolites enriched in the pathways of choline acid metabolism, glycerophospholipid metabolism, alpha-Linolenic acid metabolism, as well as many biosynthesis processes, such as steroid (Figure 6(c)). Spearman correlation analysis was used to evaluate the association between the differential metabolites and biochemical parameters. Sulfocholic acid was positively correlated with serum HDL-C and negatively correlated with other indexes. 3a,12b-Dihydroxy-5b-cholanoic acid and deoxycholic acid were negatively correlated with serum HDL-C and positively correlated with other indexes. These results further revealed how the EFP exerted an impact on the HFD-induced MetS through the balancing of gut microbiota and their metabolites.

3.7. EFP Regulated Hepatic Metabolism-Related Genes
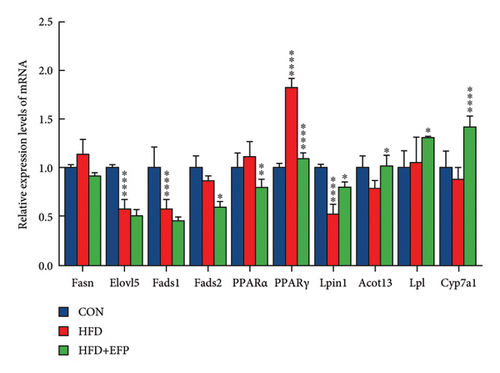
A qPCR test was conducted to investigate the mechanism of the regulative effect of EFP in the hosts consuming HFD diet. The findings indicated that the expression levels of Fad2, PPARα, and PPARγ were significantly down-regulated in the EFP group compared to those of the HFD group, while those of Cyp7a1, LPL, Lpin1, and Acot13 were significantly up-regulated by the consumption of EFP (see Figure 5(a)). The expression levels of Sirt4 and Akt2 were significantly down-regulated in the EFP group compared to those of the HFD mice, while those of Pklr, Gck, Ppp1r3g, and Akt2 were significantly up-regulated by EFP (Figure 5(b)). These results suggested that EFP may ameliorate metabolism disorders in mice by regulating the expression of dozens of significant genes involved in the signaling pathways of lipid and glucose metabolism.
4. Discussion
Globally, there is a growing interest in the study of metabolic syndrome, which is recognized as a disorder of developmental origin. Other than reprogramming treatment, many functional substances were reported as therapeutic supplements later in life, such as resveratrol, a phenolic compound from the stilbene family [17, 18]. Studies have shown that the Phyllanthus Emblica L. extract can be used for antiobesity and lipid-lowering agents [13, 19]. However, the potential association between Phyllanthus Emblica L. and gut microbiota regarding its anti-MetS effect has not been recognized so far.
In the present study, EFP intervention effectively inhibited weight gain and lipid accumulation, balanced blood lipids, improved impaired glucose tolerance, and balanced gut flora dysbiosis in HFD-caused MetS mice. Metabolic syndrome is a condition of metabolism characterized by a cluster of metabolism problems that encompasses obesity, diabetes, hyperglycemia, and excess body fat. According to our findings, EFP intervention improved glucose and lipid metabolism in HFD mice. This is consistent with previous researches related to emblica [20, 21]. The differences lie in the fact that one study used a water-soluble extract of P. emblica L. to test its effect on clinical indicators in patients with MetS, while another research found that the aqueous extract of P. emblica L. fruit had a hepatoprotective effect on NAFLD. Furthermore, both of these two studies adopted the water-soluble extract of the fruit in their experiments, but their experiments did not address the extract’s impact on the gut microbiota.
Several reports indicated that a high-fat diet affects the gut microbiota, often leading to metabolic diseases. Reduced diversity of the microbiota has been observed in mice consuming a high-fat, high-sugar diet [22]. It was also reported that the HFD caused a reduction in the abundance of Lactobacillus, Faecalibaculum, and Blautia [23]. Our experiment demonstrated that EFP consumption recovered the diversity of gut microorganisms and significantly altered the microbial composition of the gastrointestinal tract at two representative taxonomic levels (both phylum and genus). This result is consistent with many other functional foods containing tannins or polyphenols. By modulating intestinal bacteria associated with mucosal barrier dysfunction, short-chain fatty acids, and organic acid-producing microflora, polyphenols modify the ecology of the intestinal microflora [24].
Lactobacillus is a common clinical probiotic that produces SCFAs, enhances the epithelial barrier function, modulates the immune response, and is widely used in the prevention of obesity and the treatment of intestinal dysbiosis [25]. Clostridia_UCG_014 promotes the formation of acetate and sucrose, and its metabolites ameliorate lipopolysaccharide-induced acute liver injury [26]. In our experiment, both probiotics showed a significant decrease in the high-fat group and an increase after the EFP intervention. The spore forming bacteria, predominantly of the Clostridiaceae and Turicibacteraceae families, exert an effect on host intestinal motility. Specific bacteria in the gut microbiota, including Turicibacter, are capable to coevolve with other bacteria to induce host production of 5-HT. In turn, they can sense host-derived 5-HT to achieve the promotion of their competitive colonization in the gut. This is consistent with our experimental results. Coriobacteriaceae UCG-002 produces phenol and p-cresol, and it can reduce insulin resistance and ameliorate hepatic steatosis [27]. Relative to the HFD group, the relative abundance of Lachnospiraceae_NK4A136_group increased in the EEP group of mice. This group produces SCFAs, which are negatively correlated with several metabolic diseases [28]. In our study, the relative level of Faecalibaculum was notably higher in HFD mice but was significantly reduced by feeding EFP. This finding contradicts previous studies and raises a very interesting question. A possible explanation for this discrepancy may be the difference of our feeding environment, and it may also be related to the concentration of EFP we used. Similar results were observed in the study of Gong et al. [29], where the optimal concentration of capsaicin (CPA) treatment increased Faecalitalea, but the low concentration of CPA treatment decreased its abundance. Our results of decreased abundance of Faecalitalea may be due to the relative low concentration of EEP; additionally, Figure 5(b) shows a slight increase in Faecalibaculum abundance relative to the CON group. The exact reason for this question may need further in-depth investigation. Another study found that HFD causes the most profound increase of five Gram-negative bacteria genera compared to the normal diet, contributing to endotoxin production, macrophage infiltration, and excessive depletion of primordial follicles in the ovaries [30]. According to our findings, Akkermansia was significantly lower in the EFP group of mice compared to the HFD group, and this is consistent with another study: the enrichment of Akkermansia leads to intestinal barrier damage [28].
Gut microbial disorders can be attributed to microbial-mediated alterations of the host metabolome, and microorganisms can regulate host metabolism directly or indirectly through their metabolites (Baliga & Dsouza, 2011). Therefore, in order to explore the changes in metabolites induced by the regulatory effect of EFP on the composition shift of gut microorganisms, we conducted a semiquantitative metabolomics analysis using UHPLC-MS/MS. From our results, differentially expressed metabolites are enriched in the pathways related to choline acid metabolism, glycerophospholipid metabolism, alpha-linolenic acid metabolism, as well as many biosynthesis processes such as steroid biosynthesis. Cholic acid, deoxycholic acid, sulfocholic acid, 3a,12b-dihydroxy-5b-cholanoic acid, and 3a,6b,7b,12b-tetrahydroxy-5b-cholanoic acid all belong to the bile acids, and these bile acids were up-regulated following EFP treatment in our experiment. Bile acids are well recognized for their role in regulating bile flow and lipid secretion, promoting the excretion, absorption, and transport of fat and cholesterol in the intestine and liver, and regulating lipid metabolism [31]. The expression of several glycerophospholipids was down-regulated after EFP treatment, such as PC (18 : 0/0 : 0), LysoPC (18 : 1(11Z)/0 : 0), and PC (16 : 0/0 : 0). Phospholipids are critical components of the cellular lipid bilayer and play significant roles in metabolism and signaling. Some studies have found that the consumption of diacylglycerol (DAG) oils rich in alpha-linolenic acid (ALA) can prevent or control obesity [32]. Alpha-linolenic acid is the main representative precursor fatty acid of the omega-3 family and may differentially affect body fat through mechanisms of adipogenesis, lipid homeostasis, and systemic inflammation [33]. The obvious increase in levels of glycerophospholipids, PC, PE, and total bile acids in the liver and cecum of HFD mice suggested a significant effect of these components on the development of obesity. [34].
Our qPCR experiments revealed that EFP significantly altered expression of genes associated with lipid synthesis and catabolism in the mouse liver. The genes Fasn, Fad1, and Fads2 are critical for fatty acid synthesis. Under the action of LPL, TG is hydrolyzed into fatty acids and monoglycerides [10, 35]. As shown in Figure 7(a), compared to the HFD group, the expression of Fasn, Fad1, and Fad2 were down-regulated in the HFD + EEP group mice. This indicates that EFP reduces lipid synthesis and absorption by inhibiting the expression of the Fasn, Fad1, and Fad2 genes, thereby reducing lipid content. As shown in our study (Figure 7(a)), the HFD + EFP group exhibited increased expression of Cyp7α1, Acot13, Lpl, and Lpin1, which are associated with fatty acid oxidation and cholesterol metabolism. Cyp7α1 catalyzes the conversion of cholesterol to bile acids in the liver, thereby reducing cholesterol levels in the liver. Lpin1 and Lpl promote fatty acid β-oxidation and leptin release, and they reduce hepatic lipid droplets [36]. Therefore, it can be inferred that the high expression of Cyp7α1, Acot13, Lpl, and Lpin1 reduces fat accumulation. PPARα and PPARγ modulate lipid metabolism and insulin sensitivity, and their expression levels reflect the body’s response to lipid overload or its improvement [15]. A high-fat diet increases the fatty acid load in the liver and other tissues, often accompanied by insulin resistance. To accelerate fatty acid oxidation and clearance and improve insulin sensitivity, the expression of PPARα and PPARγ increases. However, in the HFD + EFP group, lipid metabolism improved, and EFP reduced oxidative stress and inflammation, thereby improving insulin sensitivity and reducing the need for overexpression of PPARα and PPARγ. Additionally, changes in Akt2 were consistent with this pattern; Akt2 is a core participant in insulin signaling, and its expression changes indicate changes in insulin sensitivity and glucose uptake. These changes suggest that EFP can restore insulin signaling by modulating the expression of PPARα, PPARγ, and Akt2.
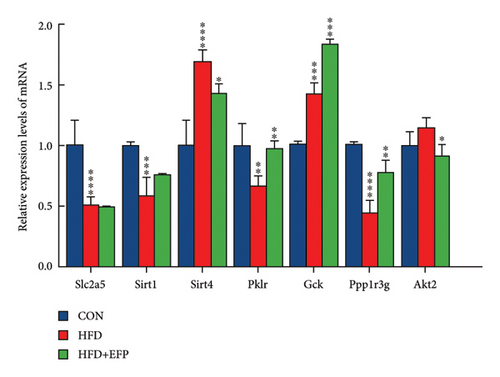
Obesity is frequently associated with elevated blood glucose levels and insulin resistance. We found that the blood glucose levels in the HFD mice were abnormal, whereas those in the EFP-treated mice showed improvement. At the molecular level, several genes related to glucose metabolism are closely associated with blood glucose levels. Gck, Slc2a5, and Pklr play important roles in the regulation of the glucose metabolism pathway. The knockdown of Slc2a5 inhibits adipocyte differentiation and reduces epididymal white adipose tissue. Gck regulates glucose metabolism in the liver and promotes glucose utilization. Pklr is involved in the pyruvate metabolism pathway. The knockdown of Pklr in the NAFLD animal model led to the reduction of the liver TG content [37]. Ppp1r3g regulates glucose metabolism and glycogen synthesis, and its expression level reflects the body’s ability to effectively manage glucose [38]. Sirt1 and Sirt4 are involved in metabolic regulation and mitochondrial function [39]. Changes in their expression indicate shifts in cellular energy balance and metabolic health [19].
Phyllanthus emblica L. significantly ameliorates lipid metabolism disorders induced by a high-fat diet through various molecular mechanisms, including the activation of the SIRT1 signaling pathway and the regulation of key genes involved in lipid and glucose metabolism. These mechanisms collectively enhance fatty acid oxidation, decrease lipid accumulation, and enhance insulin sensitivity, thereby demonstrating its lipid-lowering efficacy.
It is hypothesized that complete foods, such as the “nutritional dark matter,” or functional components, were part of the environment in which humans evolved. As a result, the metabolome is thought to be far more complex and potentially advantageous than even highly processed, nutritionally enhanced foods. For instance, garlic, a medicinal plant with a long history, has more than 2000 known compounds; only about 37 compounds of these are known to be beneficial to health. To reap the benefits of whole garlic, interactions with some or all of the other chemicals can be just as significant [40]. Components that are accessible to the microbiota, such as polyphenols and carbohydrates, support a greater diversity of gut microbes, a more abundant supply of probiotics, and more controlled production of metabolites, such as SCFAs and secondary bile acids. Furthermore, the synergistic actions of nutrients within the food matrix often contribute to this intestinal regulation. Many vegetables and fruits possess the ability to balance the composition of gut microbiota or even function as prebiotics in many disease models, such as Bitter melon, Broccoli, and many kinds of whole grains such as Qing Ke and Oat [41]. In our study, we first reported the regulatory effect of P. emblica L. fruit powder in a HFD-induced metabolism syndrome mouse model. EFP, as a food ingredient, contains a variety of nutrients that can synergistically participate in intestinal regulation, balance intestinal flora, and improve metabolic syndrome.
5. Conclusion
Our results suggest that the Phyllanthus emblica L. fruit powder has an inhibitory effect on HFD-induced metabolic syndrome in mice, including dyslipidemia, glucose tolerance, and weight gain, and this action may be partially attributed to its modulation of the gut microbiota and their metabolites and ultimately balancing the expression of host hepatic genes involved in lipids and glucose metabolism. In conclusion, EFP has the potential to target gut microbes and affect “gut-liver axis” of the host, and therefore EFP can be potentially utilized in the functional food for the prevention and control of metabolic syndrome and its characterized symptoms, such as obesity, hyperglycemia, and hyperlipidemia.
Conflicts of Interest
The authors declare that they have no conflicts of interest.
Acknowledgments
The authors gratefully acknowledge Shantou Lvsheng fruit Co. Ltd. (Shantou, China) for providing samples for this study. This research was funded by the Chaozhou Branch of Chemistry and Chemical Engineering Guangdong Laboratory, grant number “HJL202202B009”; the Guangdong Provincial Key Laboratory of Functional Substances in Medicinal Edible Resources and Healthcare Products, grant number “2021B1212040015”; the Key project of Department of Education of Guangdong Province, grant number “2022ZDZX4030”; Guangdong Science and Technology Plan Project, grant number “2024A1515010278”; and the Collaborative Innovation Research Center for Nutrition and Functional Food, grant number “22006”.
Open Research
Data Availability
The data that support the findings of this study are available from the corresponding author upon reasonable request.


