Geographical Discrimination of Hulless Barley Based on Quality Traits, Volatiles, and Metabolomic Profiling Combined with Chemometrics
Abstract
The geographical traceability of food products is crucial for quality assurance and consumer confidence. The chemical profile and taste quality of hulless barley vary considerably across different production areas, making the determination of its geographical origin and the identification of relevant geographical biomarkers essential. In this study, the quality traits, volatile compounds, and metabolites of 20 hulless barley cultivars from four primary producing areas were investigated. Multivariate analysis showed that there were significant differences in hulless barley from different regions (p < 0.05). The orthogonal partial least squares discriminant analysis (OPLS-DA) models exhibited good performance in terms of origin discrimination, identifying 27 volatiles and 86 metabolites that could be used as candidate markers for separation. Redundancy analysis (RDA) and correlation matrix analysis revealed that numerous candidate markers were closely related to soil chemical and climate parameters. The results demonstrate that quality traits, volatile compounds, and metabolites can be used to effectively distinguish the geographical origins of hulless barley, thereby confirming that there is a robust link between metabolite expression and environmental factors. This work highlights that chemical profiling, combined with chemometric techniques (the application of statistical and mathematical methods to chemical data), provides a valuable tool for the geographical discrimination of hulless barley.
1. Introduction
Barley (Hordeum vulgare L.) is one of the earliest domesticated grains in the world and is highly varied in its characteristics. It is grown globally and accounts for 12% of total grain cultivation, ranking fourth among cereal grains after wheat, rice, and maize [1, 2]. Hulless barley (Hordeum vulgare L. var. nudum Hook. f.) is a cultivar of barley that produces naked grains [3]. Hulless barley is valued globally for its significant nutritional value, including β-glucans, phenolic compounds, amino acids, various vitamins, trace elements, and dietary fiber [4–7]. It is not only widely used as a human staple food, such as in noodles, steamed bread, nutrition powder, and beer, but also used as animal feed [8]. China, which is rich in hulless barley genetic resources, accounts for 77% of the world’s total collection [9]. In China, hulless barley is mainly distributed in the Qinghai-Tibet Plateau, which covers the provinces of Tibet, Qinghai, Gansu, Sichuan, and Yunnan [10, 11]. Numerous reports have suggested that the chemical composition of different cultivars of hulless barley with different geographical origins varies greatly [2, 12]. Moza et al. found that hulless barley cultivars growing at high altitudes (1200–3500 m) in India had higher β-glucan, arabinoxylan, ferulic acid, and total anthocyanin contents than those at low altitudes (97–126 m) [13]. Shen et al. showed the presence of significant differences in phenolic compound content and antioxidant activities among three typical Chinese hulless barley varieties [2]. Ge et al. revealed that black hulless barley varieties contained the highest values of total phenolic acids, while white varieties were richest in total flavonoid content [5]. Zhang et al. demonstrated the existence of significant differences in nutrients and mineral elements in highland barley from five cities in Tibet [12]. Zhao et al. further found that due to the influence of environmental factors such as altitude, precipitation, and temperature, the nutrient and mineral contents in highland barley samples varied significantly across different areas [14]. Therefore, the chemical composition of hulless barley varies considerably among cultivars from different origins, and these variations are partially related to the different cultivation soil and climate conditions.
In recent years, the identification of geographical origins has become one of the latest and most important problems in the food industry. Many reports have shown that traceability technology can identify agricultural products from different geographical origins [15]. Comparative metabolomics can serve as a promising strategy for the authentication of food products [16, 17]. Metabonomic/metabolomic studies typically involve the analysis of large numbers of samples for the detection of biomarkers, and there is confidence in the analytical data generated by these methods, such as GC-MS and HPLC-MS [18]. Dong et al. focused on the volatile compound composition of brewing barley using SPME combined with GC/MS [19]. Cramer et al. identified volatile compounds of barley powder and analyzed the variation in volatile compound profiles among different types and varieties of barley in Washington [20]. To the best of our knowledge, the volatile composition of hulless barley from different origins has not been systematically investigated previously. Zhang et al. indicated that the origin traceability of hulless barley can be achieved by measuring the nutrients and mineral elements within the Tibet Autonomous Region [12]. LC-MS-based nontargeted metabolomics can chromatographically separate a mixture of small molecules (50–1500 Da), which can be subsequently identified by mass spectrometry (MS), and it can identify hundreds of endogenous metabolites simultaneously. Using this approach (LC-MS) coupled with multivariate statistical analysis can unveil the complexity and variability of a broad range of metabolites [21–23]. Origin-based hulless barley is highly favored for its specific nutritional composition and quality attributes, which are significantly influenced by geographical location. These geographical differences further affect the reactions processing of hulless barley and impact the sensory qualities of its derived food products, thus leading to variations in their economic values [24]. Therefore, the geographical identification of hulless barley samples is essential for ensuring food safety, significantly enhancing the edible value and improving cultivation methods [12]. However, despite the abundance of hulless barley resources, how their chemical composition varies across different geographical origins as well as its relationship with environmental factors remains unclear, especially outside the Tibet Autonomous Region. Therefore, conducting multi-angle geographical analyses of hulless barley based on metabolomic profiling is crucial for exploring the mechanisms of quality differences among regions from a new perspective.
To acquire global metabolite profiles and discriminate the geographical origins of hulless barley, we integrated the grain quality traits, volatiles, and metabolites of hulless barley and identified the potential of these indices, combined with chemometrics, to classify hulless barley samples. This is a comprehensive investigation of the chemical composition of hulless barley that can provide reliable data, especially for geographical discrimination.
2. Materials and Methods
2.1. Sample Collection and Preparation
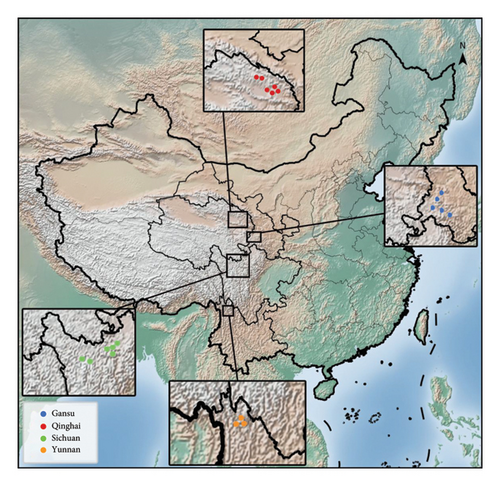
We collected 20 hulless barley cultivars, all of which were the predominant cultivars in their production regions, along with corresponding soil samples (at a 0–20 cm depth) from the major production regions of China (except the Tibet Autonomous Region), including Gansu, Qinghai, Yunnan, and Sichuan. The geographical locations of the sampling sites are shown in Figure 1, and detailed collection information can be found in Supplementary Table S1. Three parallel samples were acquired from each collection site and stored at −20°C until further analysis. Before further analysis, the hulless barley samples were ground in a ball mill for later use.
2.2. Determination of Grain Quality Traits
In this study, we measured and analyzed 16 quality traits. We determined grain quality using an Infratec NIRS grain analyzer (NIRS DS 2500 FOSS, Switzerland), and then we measured the thousand-grain weight and length-to-width ratio of grains using an automatic seed test system (TUOPU, TPKZ-1). Grain color (L∗, brightness; a∗, redness; b∗, yellowness) was determined by scanning with a color difference meter (Konica Minolta CM-5), and we used the dual-wavelength method to determine the amylose and amylopectin content in the seeds [25]. The starch content was determined by summing the amylose and amylopectin contents, and we measured the moisture content using the direct drying method [26]. The high-temperature incineration method was used to measure the ash content [27], while we determined the crude protein content using the Kjeldhal method with a factor of 5.83 [28]. The crude fat content was determined using the petroleum ether extract method [28], the β-glucan content was determined using the McCleary enzymic method for barley [29], and the total flavonoid contents were determined via a colorimetric method using rutin as the standard [30]. We determined the bulk density by weighing the amount of hulless barley grains required to fill a 500 mL container and reported the resulting value in g/L [31].
2.3. Determination of Soil Nutrients and Mineral Elements
The contents of fourteen nutrients and mineral elements in the soil samples were then determined. We measured the soil pH using a pH meter and determined the organic matter content through potassium dichromate titration. Total soil N was determined using the semi-micro Kjeldahl method [32], available N was determined through alkali-hydrolyzable diffusion [33], total P was determined using sodium hydroxide fusion [34], and available P was determined through extraction with a 0.50 mol/L sodium bicarbonate solution [35]. Using atomic absorption spectroscopy (AAS), we then determined the total K following decomposition with NaOH solution and available K after extraction with ammonium acetate [12]. We also analyzed Ca and Mg through AAS following extraction with 0.01 M SrCl2 and preparation as outlined by Joslin and Wolfe [36]. Available Fe, Mn, Zn, and Cu were determined through AAS following diethylenetriamine penta-acetic acid (DTPA) extraction [37].
2.4. Volatile Analysis by HS-SPME-GC-MS
To isolate the volatile compounds of hulless barley, the headspace solid-phase micro-extraction (SPME) technique was employed, which was achieved using a CTC Trinity automatic sampler. For this study, 100 mg (±1%) hulless barley powder was weighed into 20 mL SPME vials, and the sample vials were kept in a water bath at 50°C with oscillation (250 rpm) for 15 min. The SPME fiber was then exposed to the headspace (about 1 cm above the liquid surface) of the hulless barley powder sample for 30 min.
GC-MS analysis was conducted on a GC system (7890B, Agilent Technologies, Santa Clara, CA, USA) coupled with a mass spectrometer (5977B, Agilent Technologies, Santa Clara, CA, USA). The volatiles were separated using a DB-wax capillary column (30 m × 0.25 mm, 0.25 μm film thickness, Agilent Technologies, USA). Helium was used as a carrier gas at a flow rate of 1.0 mL/min. The GC inlet was set in splitless mode. The column oven temperature was maintained at 40°C for 5 min, then increased to 220°C at a rate of 5°C/min, increased to 250°C at a rate of 20°C/min, and held for 2.5 min. The temperatures of the injection port, ion source, and quadrupole were set at 260, 230, and 150°C, respectively. All mass spectra were acquired using the electron ionization (EI) mode at 70 eV. The mass range was between m/z 20 and 400. The identities of the volatiles were confirmed by searching the National Institute of Standards and Technology (NIST) MS Spectral Database (Washington, DC, USA), and substances with a match higher than 80% were selected.
2.5. Nontargeted Metabolomics Analysis by UPLC-MS/MS
In a 2 mL EP tube, 200 mg (±1%) of the sample was accurately weighed, and 0.6 mL of 2-chlorophenylalanine (4 ppm) methanol (−20°C) was added. The samples were vortexed for 30 s, ultrasonicated for 15 min, and centrifuged at 12,000 rpm for 10 min at 25°C. The supernatant was subsequently filtered through a 0.22 μm pore membrane to obtain the prepared samples for UPLC-MS/MS. Then, 20 μL filtrate from each sample was mixed for the quality control (QC) samples. These QC samples were used to monitor deviations in the analytical results from these pool mixtures and compared to errors caused by the analytical instrument itself [38].
The nontargeted metabolomics analysis of hulless barley was completed on a Thermo Ultimate 3000 system with an ACQUITY UPLC HSS T3 (2.1 × 150 mm, 1.7 μm) column with the following parameters: autosampler temperature of 8°C, a flow rate of 0.25 mL/min, column oven temperature of 40°C, and sample size of 2 μL. The mobile phase consisted of solvent A (0.1% aqueous formic acid) and solvent B (0.1% acetonitrile formic acid) in phase positive ion mode and solvent C (5 mM ammonium formate in water) and solvent D (acetonitrile) in negative ion mode. The gradient program was 0.3 mL/min, and an increasing linear gradient of solvent B (v/v) was used as follows: 0–1 min, 2% B/D; 1–9 min, 2–50% B/D; 9–12 min, 50–98% B/D; 12–13.5 min, 98% B/D; 13.5–14 min, 98–2% B/D; and 14–20 min, 2% B-positive model (14–17 min, 2% D-negative mode).
The MS experiments were executed on a Thermo Q Exactive Focus with an electrospray ionization (ESI) system with spray voltages of 3.8 kV and −2.5 kV in the positive and negative modes, respectively. The capillary temperature was 325°C, and the analyzer scanned over a mass range of m/z 81–1000 for a full scan at a mass resolution of 70,000. Data-dependent acquisition (DDA) MS/MS experiments were performed with an HCD scan. The collision voltage was set to 30 eV, and dynamic exclusion was implemented to remove some unnecessary information in MS/MS spectra [39].
The raw data were translated into mzXML format using soft Proteo Wizard. Metabolic feature detection, chromatographic matching, and alignment of all metabolite peaks in the LC/MS data were handled using XCMS software. Finally, all mass spectrum peak areas were integrated and used for statistical analysis. The MS/MS spectra were used to identify the metabolites through comparison with authentic samples and data. The Human Metabolome Database (HMDB), Metlin, Massbank, mzClound, and Lipid Maps were used for annotation [40].
2.6. Multivariate Statistical Analysis
Three replicates were completed for all experiments. Statistical analyses of the experimental data, including means, standard deviations, and variance (ANOVA, p ≤ 0.05), were calculated using the SPSS 22.0 package for Windows. In this experiment, the data were subjected to autoscaling and mean centering and were scaled to unit variance (UV) before multivariate statistical analysis to obtain more reliable and intuitive results. PCA and OPLS-DA of the data of 20 hulless barley cultivars were performed using SIMCA version 14.0 (Umetrics) to determine the differences corresponding to the geographical variation of hulless barley. Variable importance in the projection (VIP) for each element was calculated based on the established OPLS-DA model [41]. Detrended correspondence analysis (DCA) and redundancy analysis (RDA) were performed using Genescloud, an online platform for data analysis (https://www.genescloud.cn). Significantly differentially abundant parameters between groups were determined using VIP scores >1 (or >1.2) and an ANOVA p ≤ 0.05.
3. Results
3.1. Analysis of Grain Quality Traits of Hulless Barley Samples from Four Regions
In this study, the detection results of bulk density, hardness, thousand-grain weight, and other data were used as 16 quality trait indices for hulless barley (Supplementary Table S2). To compare the differences in grain quality traits associated with different geographical origins of hulless barley, the 16 quality trait indices from the four different geographical regions are summarized in Table 1. As shown in Table 1, except for length-to-width ratio, ash, moisture, and fat, the contents of the other 12 grain quality traits were not significantly different (p > 0.05) among the four geographical groups.
| Quality traits | Gansu | Qinghai | Yunnan | Sichuan |
|---|---|---|---|---|
| Bulk density (g/L) | 717.05 ± 7.46a | 714.76 ± 15.15a | 787.96 ± 19.58a | 756.36 ± 46.83a |
| Hardness | 58.19 ± 3.79a | 58.04 ± 4.69a | 60.82 ± 4.54a | 55.36 ± 10.15a |
| Thousand-grain weight (g) | 42.75 ± 9.35a | 46.39 ± 7.96a | 41.89 ± 3.78a | 42.14 ± 6.96a |
| Length-to-width ratio | 2.17 ± 0.06a | 1.95 ± 0.09b | 1.87 ± 0.1b | 2.01 ± 0.11b |
| Starch (%) | 55.08 ± 2.29a | 52.04 ± 4.46a | 47.93 ± 2.88a | 51.67 ± 8.31a |
| Amylopectin (%) | 42.38 ± 1.36a | 39.54 ± 3.04a | 37.39 ± 2.45a | 39.02 ± 6.03a |
| Amylose (%) | 12.70 ± 1.07a | 12.49 ± 1.52a | 10.55 ± 1.16a | 12.65 ± 2.30a |
| Total flavonoids (%) | 0.21 ± 0.04a | 0.25 ± 0.05a | 0.25 ± 0.05a | 0.26 ± 0.05a |
| β-Glucan (%) | 3.94 ± 0.93a | 3.57 ± 0.64a | 4.91 ± 1.10a | 4.28 ± 1.23a |
| Crude protein (%) | 11.64 ± 0.92a | 12.07 ± 1.47a | 13.47 ± 3.41a | 12.45 ± 2.45a |
| Ash (%) | 1.88 ± 0.18ab | 2.12 ± 0.10ab | 1.73 ± 0.15b | 2.32 ± 0.61a |
| Moisture (%) | 13.28 ± 0.33a | 12.92 ± 0.63ab | 12.43 ± 0.23b | 13.12 ± 0.47ab |
| Fat (%) | 1.9 ± 0.22b | 2.27 ± 0.15a | 2.13 ± 0.21ab | 2.1 ± 0.41ab |
| L∗ (brightness) | 50.28 ± 2.28a | 49.83 ± 6.32a | 46.47 ± 1.19a | 48.73 ± 6.96a |
| a∗ (redness) | 6.92 ± 1.57a | 6.59 ± 1.05a | 6.32 ± 3.72a | 7.54 ± 2.26a |
| b∗ (yellowness) | 20.76 ± 2.80a | 20.78 ± 4.83a | 19.00 ± 4.32a | 21.15 ± 7.01a |
- Note. All values are expressed as the mean ± standard deviation. Different letters in the same row represent significant differences at p < 0.05.
PCA and OPLS-DA were applied to compare and visualize the differences in quality traits among the samples originating from different regions. The PCA model (R2X = 0.81 and Q2 = 0.322), built on 5 PCs, revealed a clear separation of hulless barley cultivars but not a clear separation between the cultivars from one province and those from other provinces (Figure 2(a)). In this study, two principal components, PC1 and PC2, were extracted, and their contribution rates were 30.4% and 24.2%, respectively, with a cumulative contribution rate reaching 54.5%.


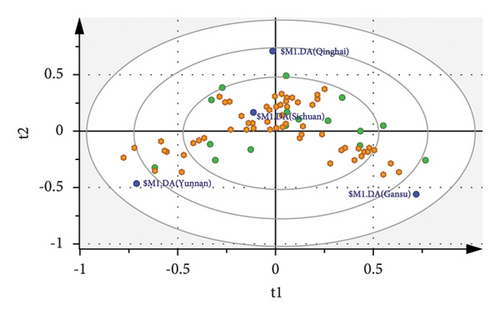
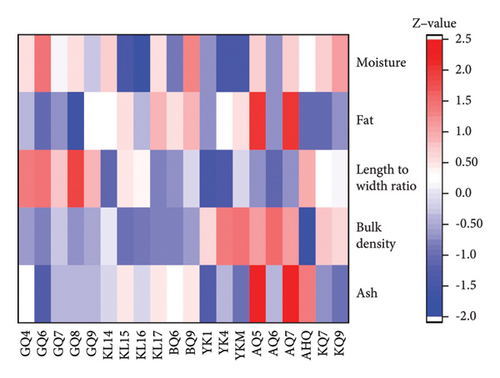
OPLS-DA was performed to improve the clustering and evaluate the grain quality trait differences among the four hulless barley groups, which were built using a total of 8 X-variates (R2X = 0.91, R2Y = 0.794, Q2 = 0.706; Figure 2(b)). Analysis models with Q2 > 0.7 were considered to have significant predictability [42]. The 200 permutation tests were performed for the further validation of our model (Supplementary Figure S1). The Y-intercept of the R2 and Q2 values obtained via the permutation tests were 0.149 and −0.401, respectively, indicating that our model was not overfitted. Hulless barley samples from Yunnan and Gansu were clearly separated, whereas the Qinghai and Sichuan groups somewhat overlapped. The corresponding loading plot (Figure 2(c)) was used to illustrate how this sorting was achieved [43]. Five quality traits, namely ash content, bulk density, length-to-width ratio, fat content, and moisture, were found to have VIP scores >1 and p < 0.05 (Figure 2(d)). Compared with the results of the ANOVA test in Table 1, only one more index (bulk density) was added. A higher quantity of ash and fat was present in AQ5 and AQ7 from the Sichuan samples. A higher bulk density was present in YKM and AQ6 from Yunnan and Sichuan, respectively. A higher length-to-width ratio was present in GQ8 from Gansu. Higher moisture was present in GQ6 from Gansu.
Hulless barley food rich in nutrients is becoming increasingly popular with consumers. Therefore, it is important to distinguish the geographical origin of hulless barley. Multivariate analysis of agronomic and quality characteristics can result in meaningful genotype groupings [44]. In this study, significant geographical differences were observed in four grain quality traits of hulless barley samples across four provinces (p < 0.05), and the OPLS-DA model diagram showed that samples from different regions were classified to a certain extent (Q2 > 0.7). Five grain quality traits, namely ash content, bulk density, length-to-width ratio, fat content, and moisture, had the highest importance values and could be regarded as the characteristic quality traits responsible for the geographical origin group separation of the samples. Our study further indicated that environmental effects were important for the variations that occurred in chemical content, and grain quality traits were able to be used for the geographical discrimination of hulless barley.
3.2. Comparison of Volatile Profile of Hulless Barley Samples from Four Regions
Volatile analysis can comprehensively study the overall flavor and aroma characteristics of food [45]. After HS-SPME-GC-MS analysis, 193 volatiles were detected in hulless barley cultivars (Supplementary Table S3), including alcohols (29), aldehydes (10), ketones (13), esters (22), acids (6), ether (2), alkanes (48), alkenes (14), benzenes (29), phenols (3), furans (2), and others (15). A comparison of the total ion peak areas of each metabolite type showed that alkanes and alcohols were the major quantitative constituents for the hulless barley volatiles, followed by benzenes and ethers. This was consistent with the conclusion by Cramer et al. that alcohols were the main quantitative constituents of barley volatiles [20]. Some of these types of compounds have been previously reported in various barley resources, including alcohols, aldehydes, ketones, organic acids, aromatic compounds, and furans [19, 20], but more volatile metabolites than those previously reported were identified in our study.
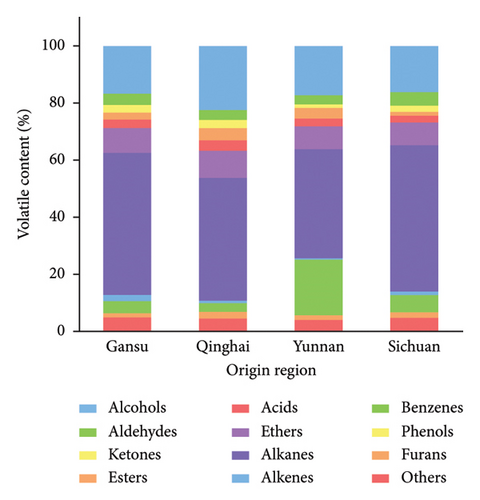
Comparative analysis revealed that hulless barley cultivated in Yunnan had the most volatiles, followed by Sichuan, Qinghai, and Gansu, as evidenced by the content of detected volatiles (Supplementary Table S4). These types of volatile compounds were contained in four groups of hulless barley cultivars of different origins, but the relative content of each compound varied greatly from one cultivating area to another (Figure 3(a)). The alkane, benzene, and alcohol percentages in hulless barley were highest in Sichuan, Yunnan, and Qinghai, respectively, compared to those from other areas.
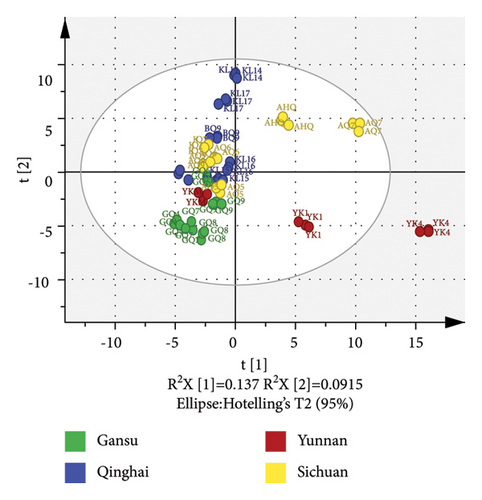
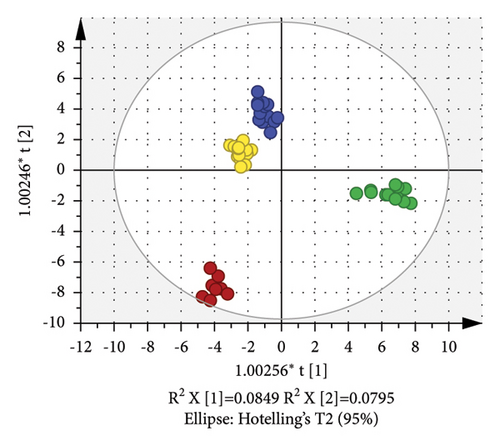
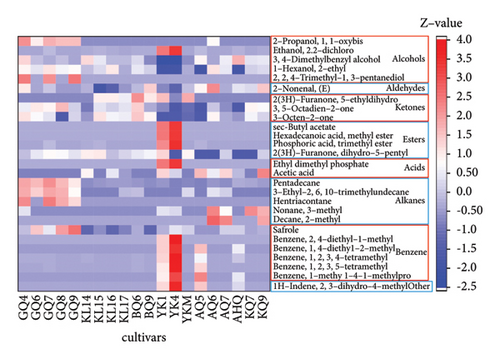
PCA (R2X = 0.932 and Q2 = 0.62) of the volatiles, built on 19 PCs, revealed some overlap between the four groups of different origins, suggesting the relatively poor classification ability of this PCA model in hulless barley cultivars (Figure 3(b)). The cumulative contribution rate of the two principal components PC1 and PC2 only reached 22.9% (PC1 = 13.7% and PC2 = 9.2%). OPLS-DA was applied to evaluate the volatile differences among the four hulless barley groups. Figure 3(c) displays the OPLS-DA score plot built by 7 X-variates, showing that the hulless barley samples were clustered into four distinct groups according to their geographic origins. Moreover, the Y-intercept of R2 and Q2 obtained via the 200 permutation tests were 0.379 and −0.704, respectively, indicating that our model had excellent fitness and stable predictive ability and was not overfitted (Supplementary Figure S2). The OPLS-DA model in the volatile analysis (R2X = 0.517, R2Y = 0.981, and Q2 = 0.956) revealed an excellent ability to discriminate. We also calculated the VIP scores of the volatiles based on the OPLS-DA model, and 27 compounds with VIP scores >1.2 and ANOVA p values <0.05 are listed in Figure 3(d). These compounds were considered the most important markers responsible for group separation. As shown in Figure 3(d), the main difference between the Yunnan samples (especially YK4 and YK1) and others was the high content of certain esters and benzene. The content of safroles and some alkanes in most Gansu hulless barley cultivars was significantly higher than in other regions.
Recently, an untargeted analytical approach combined with chemometrics using volatiles was described for verifying the botanical origin of crops, primarily in rice and wheat [46–49]. In this study, we thoroughly investigated all of the volatile compounds in hulless barley and identified the metabolic differences between hulless barley cultivars of different origins. Our results revealed that the volatile components of hulless barley could be classified according to their origins based on OPLS-DA (Q2 > 0.9). The differences in volatile components could be influenced by the geographical locations, growing conditions, and genotypes of hulless barley. Previous reports showed a geographical discrimination method that combined mineral elements with volatile compounds of rice [50]. This work suggests that GC-MS-based volatile profiling combined with multivariate statistics could be used as a supporting tool for the partial differentiation of hulless barley from different cultivation areas.
3.3. Comparison of Metabolome Profiles of Hulless Barley Samples from Four Regions
In addition to quality traits and volatile composition, an LC-MS-based nontargeted metabolomics analysis coupled with multivariate analysis was applied to investigate the global chemical profile and authenticate the geographical origin of hulless barley samples. In total, 551 metabolites were detected (Supplementary Table S5 and Supplementary Figure S3) and could be classified into several classes of chemicals, including carboxylic acids and derivatives (84), fatty acyls (71), organooxygen compounds (64), benzene and substituted derivatives (40), flavonoids (27), indoles and derivatives (24), phenols (22), steroids and steroid derivatives (19), prenol lipids (15), organonitrogen compounds (14), hydroxy acids and derivatives (13), keto acids and derivatives (13), pyridines and derivatives (11), cinnamic acids and derivatives (10), and others (124). Comparative analysis of the total ion peak areas of each metabolite type revealed that the hulless barley cultivated in Gansu was the most abundant in metabolites, followed by Yunnan, Qinghai, and Sichuan, as evidenced by the contents of the detected metabolites.
The ratio of each metabolite type (Figure 4(a)) showed that the types of metabolites in the hulless barley of the four origin regions were similar, but the content of many metabolites was different, which indicates the significant differences in the metabolite levels of the four origins. Carboxylic acids and derivatives, fatty acyls, organooxygen compounds, and organonitrogen compounds were the major quantitative constituents of hulless barley metabolites. The proportion of cinnamic acids and derivatives in Qinghai hulless barley was higher than that in the other three provinces.
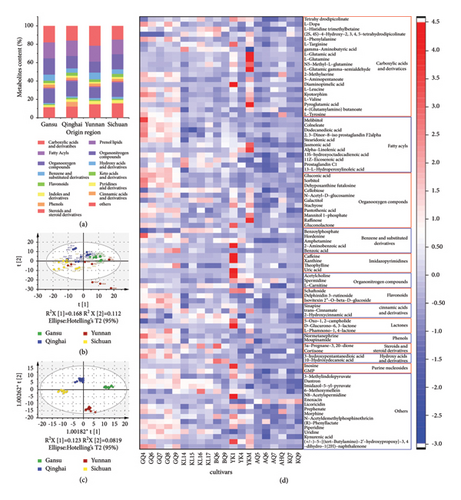
The PCA of peak areas obtained from chromatographic fingerprints, built on 10 PCs (R2X = 0.69 and Q2 = 0.434), showed that these samples from Gansu province could be clustered; however, the other three provinces could not achieve good classification performance (Figure 4(b)). The cumulative contribution rate of the two principal components PC1 and PC2 only reached 28.0% (PC1 = 16.8% and PC2 = 11.2%). OPLS-DA models built by 8 X-variates (R2X = 0.581, R2Y = 0.984, and Q2 = 0.925) were observed for further discrimination of the four groups (Figure 4(c)). The reliability of the OPLS-DA model was verified by 200 permutation tests (Y-intercepts of R2 and Q2 were 0.651 and −0.637, respectively), indicating that the model was not overfitted and had high reliability (Supplementary Figure S4). Similarly, the results of the metabolome profile OPLS-DA model indicated that the four hulless barley groups were distinctly separated from each other. A metabolic fingerprint is similar to the plant phenotype and is highly sensitive to exogenous factors, such as growing location, climate, or soil composition [51]. Consistent with a previous report on a multivariate statistical analysis of hulless barley with nutrient and mineral element data that had a strong discrimination result with the geographical origin [12], OPLS-DA of the metabolome profile also showed excellent visualization for geographical origins.
The significance of metabolites was evaluated by calculating a p value <0.05 for ANOVA and a VIP score >1.2 for the OPLS-DA model. A total of 86 differentially abundant metabolites were selected and determined as candidate markers for the differentiation of four hulless barley groups (Figure 4(d)).
To obtain more distinct separation of the samples and determine the metabolites contributing to the discrimination, PCA and OPLS-DA were used on the LC-MS dataset. High predictability and a strong goodness of fit of the OPLS-DA models were observed for comparisons between hulless barley samples of different origins (Q2 > 0.9). Our previous research showed that the metabolic profiles of five hulless barley cultivars with different seed coat colors could be effectively discriminated [52]. The present study further indicated that each group of different geographical origins had a relatively distinct metabolic profile. Different from the conclusion that flavonoids were the main differential metabolites for the different colored varieties, selected metabolites, including carboxylic acids and their derivatives (20 out of 86, 23%), fatty acyls (11 out of 86, 13%), and organooxygen compounds (11 out of 86, 13%), were to be determined as potential biomarkers for the geographical discrimination of hulless barley. The accumulation of these characteristic compounds might be more easily affected by soil, climate, and other environmental factors. Based on metabolomic profiling combined with chemometrics, a reliable method has been provided for differentiating hulless barley according to geographical origin.
3.4. Correlation Analysis between Metabolites and Environmental Factors
We then investigated 14 nutrients and mineral elements in soil samples corresponding to the hulless barley cultivars (Supplementary Table S6). The ANOVA results indicated the presence of significant differences between soil samples from different regions in most variables, except for Mn and available K (p < 0.05), as shown in Table 2. Specifically, soils from Gansu showed the highest mean concentrations of total N, available K, and organic matter, as well as the highest pH value; the Qinghai samples showed the highest mean contents of available P, K, Mg, hydrolyzable N, and Ca, and the lowest mean contents of Cu and Zn; and the Yunnan samples showed the highest mean level of total P, Fe, Cu, and Zn, and the lowest mean level of Mg, available K, and pH. In contrast, the values of total P, total N, available P, Fe, K, hydrolyzable N, Ca, and organic matter were lowest in the Sichuan samples. These results suggest significant variations in soil nutrient mineral compositions among different regions. Similar findings were obtained by Zhang et al., who observed differences among soils from five regions in the Tibet Autonomous Region [12].
| Nutrient | Gansu | Qinghai | Yunnan | Sichuan |
|---|---|---|---|---|
| pH | 8.08 ± 0.22a | 8.05 ± 0.09a | 6.28 ± 0.63b | 7.99 ± 0.42a |
| Organic matter (g/kg) | 29.75 ± 4.54a | 25.33 ± 4.45b | 48.17 ± 19.68a | 16.93 ± 5.90c |
| Total N (g/kg) | 1.99 ± 0.31a | 0.17 ± 0.03bc | 0.26 ± 0.10b | 0.15 ± 0.03c |
| Hydrolyzable N (mg/kg) | 96.55 ± 19.76ab | 101.26 ± 24.43a | 92.34 ± 17.88ab | 84.43 ± 18.46b |
| Total P (g/kg) | 0.61 ± 0.08c | 0.86 ± 0.07b | 0.94 ± 0.05a | 0.58 ± 0.08c |
| Available P (mg/kg) | 24.78 ± 7.00b | 44.09 ± 6.70a | 41.27 ± 8.82a | 13.41 ± 2.90c |
| Total K (g/kg) | 21.67 ± 1.81b | 22.97 ± 1.64a | 19.13 ± 2.02c | 18.56 ± 1.35c |
| Available K (mg/kg) | 199.60 ± 58.47a | 142.89 ± 23.84b | 141.67 ± 44.31b | 144.28 ± 57.3b |
| Ca (g/kg) | 8.08 ± 0.99ab | 13.37 ± 1.21a | 2.92 ± 1.59ab | 6.58 ± 3.65b |
| Mg (g/kg) | 1.26 ± 0.16b | 1.49 ± 0.25a | 0.75 ± 0.12c | 1.21 ± 0.40b |
| Fe (mg/kg) | 42.34 ± 5.55bc | 47.03 ± 8.910b | 1191.33 ± 764.11a | 34.28 ± 16.02c |
| Mn (mg/kg) | 10.02 ± 1.85a | 12.95 ± 1.34a | 35.19 ± 22.64a | 14.01 ± 6.83a |
| Zn (mg/kg) | 68.33 ± 6.01b | 66.00 ± 9.95c | 77.78 ± 13.52a | 67.61 ± 5.79bc |
| Cu (mg/kg) | 24.20 ± 3.43b | 21.61 ± 3.82b | 29.56 ± 5.29a | 22.61 ± 1.82b |
- Note. All values are expressed as the mean ± standard deviation. Different letters in the same row represent significant differences at p < 0.05.
The heterogeneity in the mineral composition of soils from different geographic origins could give rise to differences in the chemical composition of plants from different origins [53]. RDA based on the 118 screened candidate markers (including 5 grain quality traits, 27 volatile compounds, and 86 metabolites) of hulless barley and environmental factors was carried out to further investigate the factors driving the variations in chemical composition among plants from different regions. The DCA results showed that the maximum gradient length of the four axes was 1.22 (<3), indicating that RDA is suitable for use in further data analysis. According to the RDA results (Figure 5), the eigenvalues of axis 1 and axis 2 were 55.42% and 22.75%, respectively. Together, these eigenvalues explained 78.17% of the total variance in the hulless barley. Furthermore, three environmental factors explained 82.2% (total N), 69.7% (organic matter), and 45.5% (rainfall) of the variation in the hulless barley, respectively (P < 0.01). The first axis was most negatively correlated with total N (r = −0.90) and most positively related with rainfall (r = 0.65). The second axis was strongly negatively correlated with organic matter, with a correlation coefficient of −0.81.
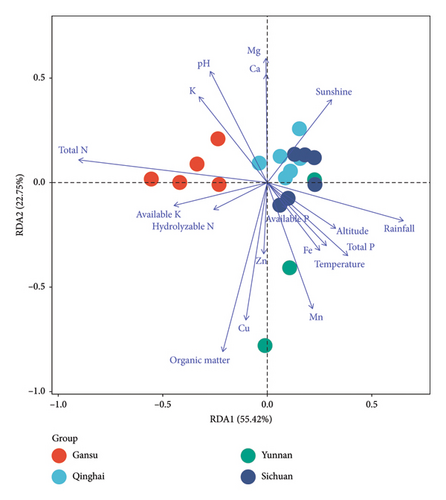
To validate the selected candidate markers mentioned above, the interdependence between various candidate markers and environmental factors was evaluated through correlation analysis between the 118 screened candidate markers (including 5 grain quality traits, 27 volatiles, and 86 metabolites) of hulless barley and environmental factors (Supplementary Table S7). Numerous significant correlations were found between candidate markers of hulless barley and soil chemical and climate parameters. Among the screened biomarkers, 50 candidate markers showed significant correlations with the climate factor rainfall, and 45 of them had negative correlations (P < 0.05). Many plants have been found to respond to water stress challenges by adapting their metabolic repertoire [17]. These negative correlations suggest that under low annual rainfall conditions, water stress is conducive to the accumulation of certain bioactive phytochemicals in hulless barley. The values of 52, 35, 30, and 27 candidate markers were significantly positively related to the contents of total N, organic matter, Fe, and Mn in soil, respectively (P < 0.05). Moreover, there were significant correlations between 40 candidate markers and soil pH, 29 of which were negative (P < 0.05).
Among environmental factors, nitrogen is one of the nutrient elements that most easily affects plant growth [14]. Soil organic matter contains various nutrients needed by plants and has significant geographical characteristics [54], while Fe greatly influences the contents of total flavonoids, total saponins, and polysaccharides in some plants [55]. It has also been reported that soil pH values significantly influence the elemental profiles in plant samples [53]. Earlier studies have only speculated on the effects of environmental factors when assessing the relationship between metabolite differences and cultivation origin [53, 56]. Our results supported this and confirmed a robust link between environmental factors in the regions of cultivation and several important metabolites. The link between the composition of hulless barley metabolites and the environmental characteristics of its region of origin proves that an approach based on quality traits, volatiles, and metabolomic profiling has the potential to discriminate hulless barley from different geographical regions.
4. Conclusions
In the present study, quality traits, nontargeted volatiles, and metabolomics analysis were successfully utilized to determine the chemical fingerprints of various hulless barley samples collected from Gansu, Qinghai, Yunnan, and Sichuan, China. This study detected 16 grain quality traits, 193 volatiles, and 551 metabolites and provides a comprehensive investigation of the metabolic profiling of hulless barley. Metabolic pathway analyses showed that the contents of quality traits, volatiles, and metabolites in the groups were significantly different among the four geographical origins and could effectively identify hulless barley samples from different origins. The OPLS-DA models of nontargeted volatile and metabolomic analysis led to better results for origin discrimination than the quality trait data. In addition, 27 volatiles and 86 metabolites could be used as candidate markers for chemometric analysis, which could provide more accurate data for hulless barley origin traceability. The RDA results and correlation analysis showed numerous significant correlations between these metabolites in hulless barley and environmental factors. The findings of this research provided a reliable method for the discrimination of hulless barley according to geographical origin based on metabolomic profiling combined with chemometrics. The metabolomics analysis of hulless barley cultivars provides a new direction for the study and determination of the geographical origin traceability of hulless barley.
Conflicts of Interest
The authors declare that they have no conflicts of interest.
Authors’ Contributions
Lijing Liang was involved in conceptualization, methodology, and formal analysis and wrote the original draft. Junjie Jia was involved in conceptualization and methodology. Ling Li investigated the study and was involved in formal analysis. Liqiang Zhang reviewed and edited the study. Long Ma developed software and was involved in formal analysis. Songtao Wang collected resources. Zongyun Feng developed methodology and supervised the study.
Acknowledgments
This research was supported by funds from the International Science and Technology Cooperation in Sichuan Province of China (Grant no. 2021YFH0113), the Double Support Program for Discipline Construction of Sichuan Agricultural University in China, the Sichuan Science and Technology Project (2021ZYD0102), and the Luzhou Science and Technology Program.
Open Research
Data Availability
The data used to support the study are included in the article.


