Applying a Cerebellar Model Articulation Controller Neural Network to a Photovoltaic Power Generation System Fault Diagnosis
Abstract
This study employed a cerebellar model articulation controller (CMAC) neural network to conduct fault diagnoses on photovoltaic power generation systems. We composed a module array using 9 series and 2 parallel connections of SHARP NT-R5E3E 175 W photovoltaic modules. In addition, we used data that were outputted under various fault conditions as the training samples for the CMAC and used this model to conduct the module array fault diagnosis after completing the training. The results of the training process and simulations indicate that the method proposed in this study requires fewer number of training times compared to other methods. In addition to significantly increasing the accuracy rate of the fault diagnosis, this model features a short training duration because the training process only tunes the weights of the exited memory addresses. Therefore, the fault diagnosis is rapid, and the detection tolerance of the diagnosis system is enhanced.
1. Introduction
Photovoltaic power generation system is one of the renewable energy sources, which produces less pollution. To enhance their power generation efficiency, the proposed system was installed in vast and boundless spaces without a shadow. However, when the system operation time increased, the power could be reduced because of module aging. In addition, prolonged outdoor use of the system can result in module faults from natural disasters. Faults in one of the modules in photovoltaic power generation systems significantly decrease the output power of the system [1–4]. Furthermore, photovoltaic power module faults are difficult to determine and detect by sight, and manual, individual inspection of the modules is time consuming.
Therefore, fault diagnosis techniques for photovoltaic systems not only increase maintenance efficiency and enhance system power generation reliability, but also effectively decrease operation costs. Currently, photovoltaic science applications and technology (PVSAT) projects for fault diagnosis are being explored in Germany, The Netherlands, and Switzerland [5, 6]. These projects primarily focus on establishing a self-fault detection system for grid-connected systems to detect system errors and analyze their causes. However, the development of grid-connected photovoltaic systems relies on meteorological satellites to transmit atmospheric data, and the reference data are measured by ground weather stations as the atmospheric parameters for simulation analyses, further enhancing the overall recognition rate. Regarding the stand-alone systems, adopting this fault detection system is costly, resulting in limited application range and reduced practicality. In addition, experts have proposed employing high frequency reaction measurement [7] and time domain reflectometry (TDR) methods [8] to conduct fault diagnoses. By identifying the reflected feedback signal, the diagnosis method discriminates whether a fault has occurred in the reported area. However, this diagnosis technique relies on additional measurement equipments, such as a network analyzer. Furthermore, the techniques applied in both methods require detailed calculations of the conducting wire length within the photovoltaic power module. Therefore, system maintenance personnel must possess sufficient knowledge related to photovoltaic power generation systems. To apply fault diagnosis to large-scale versions of these systems, the accuracy of the wire length calculation must be ensured; otherwise, module fault areas can be misjudged. Therefore, applying this fault diagnosis technique does not significantly enhance system maintenance convenience. Chouder and Silvestre [9] used the fact that whether the calculated system power loss is a fixed value or a value occurring in a short period as a criterion to determine possible fault types. However, the cause of the fault and whether the fault point occurred on the side of the direct or alternating current cannot be accurately determined. Researchers have previously proposed a simple system performance model [10] to perform fault diagnoses for photovoltaic systems; however, this model was based on statistics of the power output of the power conditioner and categorized system faults into only three types: (1) ideal operating conditions, (2) normal operating conditions, and (3) actual operating conditions where possible faults and additional power loss may occur. Therefore, this simplified method does not significantly save maintenance labor. Vergura et al. [11] employed statistical methods to determine the number of power conditioner faults by referencing the power generation amount of the power conditioner’s alternating current side. However, the most prevalent object in the photovoltaic power generation system with faults that cannot be determined visually is the photovoltaic module, rather than the power conditioner. Therefore, the effects of this method regarding the reduction of maintenance labor are limited.
Based on these mentioned facts, we used the CMAC to conduct fault diagnoses for the module arrays of photovoltaic power generation systems to increase the efficiency and accuracy of fault diagnosis and reduce system maintenance labor. In fault diagnoses, the CMAC application exhibits an excellent accuracy rate, high detection tolerance, and a multi-fault diagnosis function. The framework and diagnosis steps of the CMAC-based fault diagnosis proposed in this study sampled data from existing photovoltaic systems as the information for conducting training. After the training was complete, the system was equipped with a suitable memory weight to conduct fault diagnoses on the test data.
2. Retrieval of Fault Data from the Photovoltaic Power Generation System
Solar Pro packaged software is a photovoltaic power system analysis simulation software developed by Laplace System Co., Ltd. [12]. Solar Pro can establish the module types, model numbers, and installation angles of photovoltaic power generation systems and can simulate the P-V and I-V curves of shaded or faulted photovoltaic power generation systems. Furthermore, this software can simulate system power generation situations ranging from one day, one month to one year. Figure 1 shows the P-V and I-V curves of a 3.15 kW photovoltaic power generation system simulated by Solar Pro under 1,000 W/m2 sunlight irradiation and a module temperature of 25°C. Figure 1 shows that, in addition to indicating the maximum power point voltage, maximum power point current, and maximum power under a particular irradiation and module temperature, Solar Pro can indicate the open-circuit voltage (Voc) and the short-circuit current (Isc) of a system.
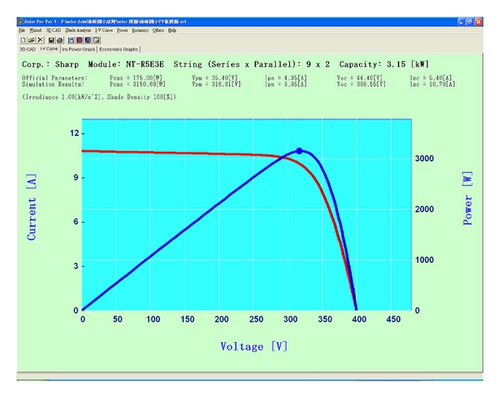
Figure 2 shows the I-V and P-V curves of the SHARP NT-R5E3E photovoltaic module datasheet under irradiation between 200 and 1,000 W/m2 with a PV module surface temperature of 25°C. Figure 3 shows the simulated I-V and P-V curves of the SHARP NT-R5E3E photovoltaic power module using the Solar Pro photovoltaic power system analysis and simulation software under an irradiation between 200 and 1,000 W/m2 and a PV module surface temperature at 25°C. By comparing Figures 2 and 3, we observed that the simulation results of Solar Pro are identical to those of the datasheet, confirming that the characteristic curve simulated by Solar Pro was identical to the performance curve of the actual module and the power generation data.
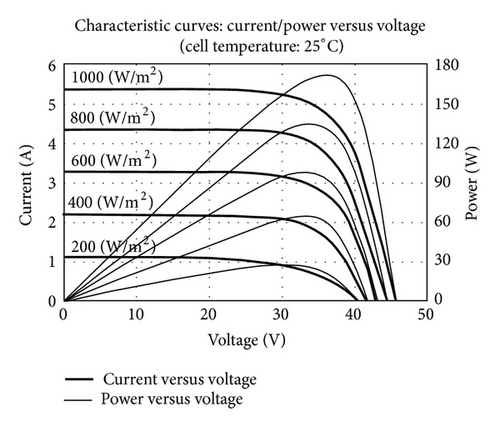
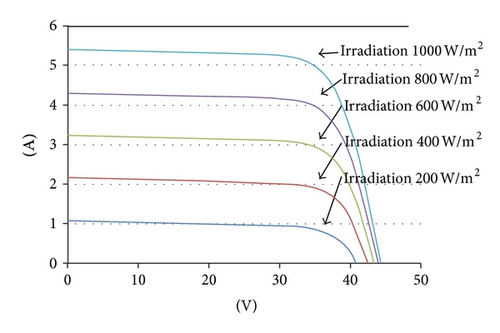
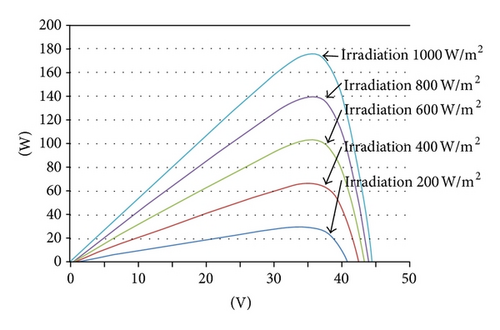
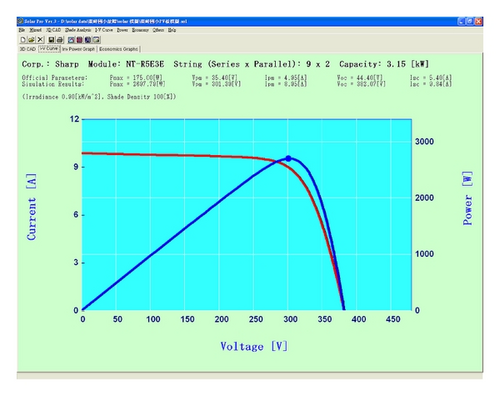
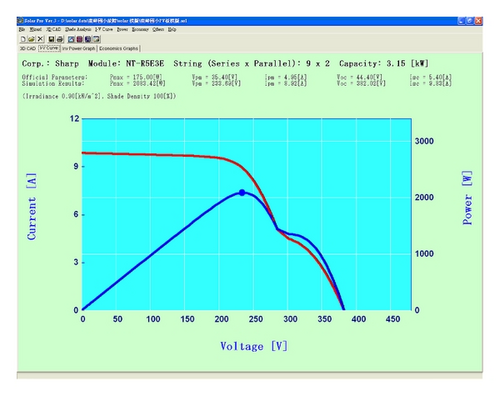
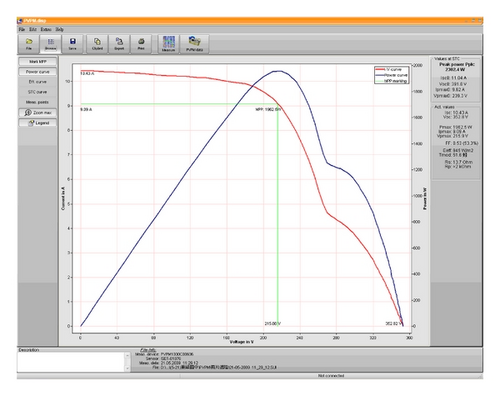
Figure 4 shows the P-V and I-V simulation curve of the 3.15 kW photovoltaic power generation system composed using NT-R5E3E photovoltaic power modules featuring 9 series and 2 parallel connections under 900 W/m2 irradiation and a PV module surface temperature at 51.6°C. Figure 5 shows the simulated I-V and P-V curves of a series of photovoltaic power module arrays when two modules were shaded, and the irradiation and PV module surface temperature were identical to those shown in Figure 4. From the information shown in Figure 5, we observed that when the photovoltaic power modules were shaded, the I-V curve was not smooth, and multiple peaks occurred in the P-V curve. Figure 6 shows the measurement results obtained under 945 W/m2 and a PV module surface temperature of 51.6°C, when two modules in a photovoltaic power module array were shaded. We observed that, when the photovoltaic power generation system was shaded, the actually measured I-V curve altered, and multiple peaks occurred in the P-V curve. Figures 5 and 6 show that the simulation and measurement results exhibited an excellent match, verifying that the I-V and P-V curves of a photovoltaic power generation system change, when a photovoltaic power module is shaded or faulted. In addition, the voltage, current, and power of the maximum power point can be altered. Therefore, we selected the voltage, current, and power of the maximum power point and open-circuit voltage as the characteristics for the fault diagnosis to examine the photovoltaic power generation system’s fault conditions and types.
3. The Theory Regarding Cerebellar Model Articulation Controllers (CMACs)
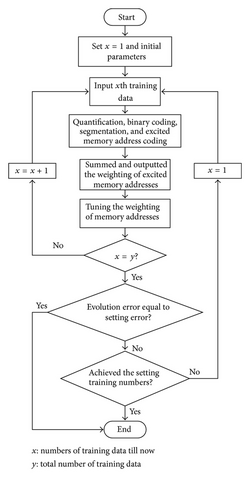
The CMAC theory was proposed by Albus in the 1970s [13] to imitate the neurological structure of the human cerebellum for achieving rapid learning and reactions. The CMAC stimulates related memory based on the varying sizes and levels of received input signals. Therefore, memory that is stimulated by relative input signals is approximated. There is no multilayer memory algorithmic framework for articulating controller frameworks. Conversely, memory cells are directly used to store mapping relationships between the input and output signals. The CMAC possesses substantial memory capacity, but the memory stimulated by each input signal can only be a minimal unit. Therefore, not all of the memory is used. This characteristic is identical to the structure of the human cerebellum. Although the human cerebellum has a large memory capacity, it uses a minimal portion of the memory that regards specific input signals. During the CMAC mapping process, each memory address stores a weight. When a set of input signals is inputted, a set of memory addresses is excited through a combination of quantification, coding, and segmentation addresses. Thereafter, the output for this set of input signals can be mapped by summing the weights within a set of excited memory addresses. By comparing the obtained output value to an ideal output value and averagely distributing the output values based on the size of the error value into a set of segmentation memory addresses for tuning, the training process for the data set is completed. The CMAC, similar to other neural networks, is divided into a training stage and a diagnosis stage [14]. A detailed description of the learning and training stage is provided below. The flowchart of the CMAC training process is shown in Figure 7.
3.1. Quantification
In (1), x represents the quantified input, Qmax denotes the maximum quantization level, ceil(·) is the maximum integer instruction, and [xmin , xmax ] indicates the minimum and maximum values of the training sample. Numerous quantification levels are delineated by the equidistance between the maximum and minimum values of all of the input data. Quantification levels with a high resolution produce comparatively precise quantification codes, although they require additional memory spaces [15].
3.2. Excited Address Coding
Performing coding on the quantified values involves the hypotheses of, the following quantification: (1) a set of input signals exhibits quantification levels of 5, 10, 8, and 12; (2) the quantization levels are converted to a binary code of 0101b, 1010b, 1000b, and 1100b; and (3) a series of binary codes are combined for coding. Therefore, a 16-bit coding of 1100100010100101b is acquired.
By grouping the obtained coding 3 bits per group, 6 groups are established. By sequentially coding the least significant bit to the most significant bit, 6 segmentation addresses are obtained: a1 = 101b = 5, a2 = 100b = 4, a3 = 010b = 2, a4 = 100b = 4, a5 = 100b = 4, and a6 = 001b = 1. Based on the correspondence of these decimal values to the relative memory addresses and from hypothesizing that the preliminary weight of all memory is 0, the summed memory weight of the first stimulation is 0.
3.3. Weight Tuning
In (2), ai represents the strobe memory address and β denotes the learning constant (with a value between 0 and 1). Assuming that all fault types only have one set of training samples, β can be directly established as 1. The β value of more than one sample of data is typically slightly less than 1. Yd represents the target value (set as 1 in this study), Y indicates the actual output value, and A* is the number of segmentation memory addresses. This formula evenly distributes weight values that require learning to separate memory addresses.
3.4. Detection Tolerance
The CMAC proposed in this study exhibited excellent anti-interference. For example, if a 16-bit original code (1100100010100101b) coded in Section 3.2 is interfered and converted into (110110001010-0101b), the excited addresses, that is, (a6, a5, a4, a3, a2, a1), convert from (1, 4, 4, 2, 4, 5) to (1, 5, 4, 2, 4, 5). Except for a5, which exhibited an error, the other parts possessed normal outputs, thereby exhibiting tolerance. If expanded, the number of groups can be distributed and stored in additional addresses, resulting in a low error detection influential level on the adjacent bits, further enhancing accuracy.
4. Diagnosis Framework Establishment
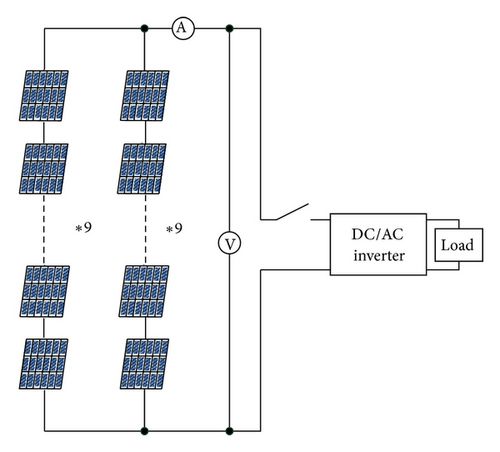
To perform a fault diagnosis of the photovoltaic power generation system proposed in this study, the present irradiation and PV module temperature of the photovoltaic power generation system are required. Inputting this data, combined with the retrieved characteristic data of the photovoltaic power generation system (e.g., the maximum power, (Pm), maximum power point voltage (Vpm), maximum power point current (Ipm), and open-circuit voltage (Voc) during operation) into the CMAC, determines whether the photovoltaic power generation system is operating normally or is faulted. Figure 8 shows the framework of the CMAC fault diagnosis method proposed in this study. The input signals of this framework were the four detection signals mentioned. The CMAC fault diagnosis framework contained 10 weighted output values, representing the 10 fault types. Therefore, a total of 10 trained memory layers exist. The memory address number of each layer consisted of 2-bit groups. In this study, we used 4 bits per group for a total of four groups. Therefore, each layer had 64 memory addresses. Following input value quantification, grouping, excited address coding, and summing all of the weight values of the excited addresses, a weighted output value was obtained. The diagnosed system used photovoltaic power modules featuring 9 series and 2 parallel connections. The connections are shown in Figure 9.

4.1. Fault Type
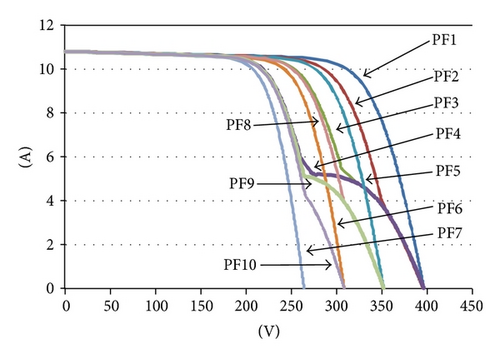
This study divided the faults of the photovoltaic power generation system into 10 types (under identical irradiation and PV module temperatures), as listed in Table 1. Figure 10 shows the I-V and P-V characteristic curves of the photovoltaic power generation system that were simulated based on the various fault types in Table 1 and under a PV module temperature of 31°C and 1,000 W/m2 irradiation.
| Fault type | Fault condition |
|---|---|
| PF1 | Operating normally. |
| PF2 | Faults occurring in one module in one circuit branch. |
| PF3 | Faults occurring in two modules in one circuit branch. |
| PF4 | Faults occurring in three modules in one circuit branch. |
| PF5 | Faults occurring in one module in both circuit branches. |
| PF6 | Faults occurring in two modules in both circuit branches. |
| PF7 | Faults occurring in three modules in both circuit branches. |
| PF8 | Faults occurring in one module in one circuit branch, as well as in two modules in the other circuit branch. |
| PF9 | Faults occurring in one module in one circuit branch, as well as in three modules in the other circuit branch. |
| PF10 | Faults occurring in two modules in one circuit branch, as well as in three modules in the other circuit branch. |

4.2. Diagnosis Process
The CMAC fault diagnosis process of the photovoltaic power generation system proposed in this study is given below.
Step 1. Conducting the initialization of the relevant parameters, as shown in Table 2 the maximum power Pm, maximum power point voltage Vpm, maximum power point current Ipm, and open-circuit voltage Voc were used as input signals to conduct quantification procedure.
| Total types of input | 4 |
| Total types of output | 10 |
| Quantification levels | 16 |
| Number of bits per group | 4 |
| Number of clusters | 4 |
| Learning constant (β) | 0.9 |
| Number of training times | 5 |
Step 2. Following quantification, the quantified values were converted into binary codes and combined. Thereafter, the combined codes were grouped. This study distributed 4 bits per group, and there were 4 groups.
Step 3. The grouped codes were used to search for corresponding memory addresses, and the weighted value within the memory was summed. This study used a 10-layer memory space. Therefore, memory that had identical addresses in the 10 layers is excited, resulting in 10 outputs.
Step 4. The weight values of the 10 outputs are determined. The greater a weight value or the closer a weight value approximates to 1, the greater fault probability rate it exhibits.
5. Test Results
Irradiation and temperature can change over time. Therefore, the potential PV module temperatures and irradiation ranges within one day were divided into 21 types. Irradiations between 300 and 1,000 W/m2 were divided every 100 W/m2, and PV module surface temperature between 31 and 60°C was further separated every 10°C into three subintervals. These categorizations are listed in Table 3. We obtained 200 data sets for each interval as the training data for photovoltaic power generation system fault diagnosis. A total of 4,200 sets of training data were retrieved from 21 intervals. We used 20 data sets as the test data based on the data obtained from the categorizations in Table 3 (300–1000 W/m2 irradiation and temperature intervals of 31–40, 41–50, and 51–60°C). Tables 4 and 6 contain detailed lists of the test data. The test data comprised the operating maximum power Pm, maximum power point voltage Vpm, maximum power point current Ipm, and open-circuit voltage Voc of the photovoltaic power array module, which were acquired by inputting the parameters (i.e., irradiation, PV module temperature, and a number of selected fault modules) into Solar Pro for simulation. In addition, operating voltage, current, power, and open-circuit voltage are four critical characteristics in photovoltaic power generation system fault diagnosis. Tables 5 and 7 show the diagnosis results of the fault diagnosis method proposed in this study. The tables show observations of the fault types that can be accurately diagnosed using the method proposed in this study. In addition, the proposed fault diagnosis method does not only diagnose the main fault type of the PV system, but also can diagnose that the possibilities of other fault types have been revealed by the output weights. For example, in Table 5, the output weight index of PF4 is 1.0 in tested number 7, which means that the PV system has a 100% possibility on fault type PF4. And the tested number 7 has the lowest possibility for PF7, because its output weight index is 0.14 (or minimum). This information will be useful to find the hidden fault of the tested object for a maintenance engineer.
| Irradiation | Module temperature |
|---|---|
| 301–400 W/m2 | 31–40°C |
| 41–50°C | |
| 51–60°C | |
| 401–500 W/m2 | 31–40°C |
| 41–50°C | |
| 51–60°C | |
| 501–600 W/m2 | 31–40°C |
| 41–50°C | |
| 51–60°C | |
| 601–700 W/m2 | 31–40°C |
| 41–50°C | |
| 51–60°C | |
| 701–800 W/m2 | 31–40°C |
| 41–50°C | |
| 51–60°C | |
| 801–900 W/m2 | 31–40°C |
| 41–50°C | |
| 51–60°C | |
| 901–1000 W/m2 | 31–40°C |
| 41–50°C | |
| 51–60°C |
| Test no. | Pm (W) | Vpm (V) | Ipm (A) | Voc (V) | Temperature (°C) | Irradiation (W/m2) | Known fault type |
|---|---|---|---|---|---|---|---|
| 1 | 869.43 | 310.84 | 2.8 | 372.56 | 31.5 | 300 | PF1 |
| 2 | 1195.23 | 313.34 | 3.81 | 377.94 | 32.5 | 400 | PF1 |
| 3 | 1399.53 | 289.25 | 4.84 | 381.82 | 33.5 | 500 | PF2 |
| 4 | 1695.32 | 290.62 | 5.83 | 384.93 | 34.5 | 600 | PF2 |
| 5 | 1758.35 | 255.11 | 6.89 | 387.41 | 35.5 | 700 | PF3 |
| 6 | 2013.52 | 256.87 | 7.84 | 389.52 | 36.5 | 800 | PF3 |
| 7 | 1949.64 | 219.32 | 8.89 | 391.26 | 37.5 | 900 | PF4 |
| 8 | 2164.02 | 217.65 | 9.94 | 392.78 | 38.5 | 1000 | PF4 |
| 9 | 761.64 | 268.98 | 2.83 | 326.78 | 39.5 | 300 | PF5 |
| 10 | 1064.23 | 277.81 | 3.83 | 336.43 | 31.5 | 400 | PF5 |
| 11 | 1183.78 | 244.95 | 4.83 | 297.45 | 32.5 | 500 | PF6 |
| 12 | 1433.72 | 246.19 | 5.82 | 299.85 | 33.5 | 600 | PF6 |
| 13 | 1441.41 | 209.59 | 6.88 | 258.68 | 34.5 | 700 | PF7 |
| 14 | 1650.25 | 207.82 | 7.94 | 260.08 | 35.5 | 800 | PF7 |
| 15 | 2251.15 | 251.19 | 8.96 | 348.29 | 36.5 | 900 | PF8 |
| 16 | 2498.68 | 253.42 | 9.86 | 349.63 | 37.5 | 1000 | PF8 |
| 17 | 602.75 | 211.32 | 2.85 | 327.28 | 38.5 | 300 | PF9 |
| 18 | 826.64 | 212.81 | 3.88 | 332.09 | 39.5 | 400 | PF9 |
| 19 | 1057.41 | 216.95 | 4.87 | 297.84 | 31.5 | 500 | PF10 |
| 20 | 1281.44 | 218.22 | 5.87 | 300.23 | 32.5 | 600 | PF10 |
| Test no. | Output weight for various fault types | Known fault type | Diagnosed results | |||||||||
|---|---|---|---|---|---|---|---|---|---|---|---|---|
| PF1 | PF2 | PF3 | PF4 | PF5 | PF6 | PF7 | PF8 | PF9 | PF10 | |||
| 1 | 1 | 0.6 | 0.55 | 0.58 | 0.29 | 0.19 | 0.23 | 0.24 | 0.1 | 0.2 | PF1 | PF1 |
| 2 | 1 | 0.6 | 0.66 | 0.61 | 0.23 | 0.23 | 0.2 | 0.28 | 0.22 | 0.23 | PF1 | PF1 |
| 3 | 0.5 | 0.97 | 0.59 | 0.65 | 0.31 | 0.21 | 0.22 | 0.23 | 0.23 | 0.2 | PF2 | PF2 |
| 4 | 0.5 | 0.99 | 0.6 | 0.5 | 0.25 | 0.27 | 0.2 | 0.25 | 0.14 | 0.19 | PF2 | PF2 |
| 5 | 0.5 | 0.66 | 1 | 0.55 | 0.14 | 0.18 | 0.2 | 0.65 | 0.18 | 0.14 | PF3 | PF3 |
| 6 | 0.44 | 0.66 | 1 | 0.42 | 0.09 | 0 | 0.05 | 0.58 | 0.09 | 0.1 | PF3 | PF3 |
| 7 | 0.5 | 0.61 | 0.76 | 1 | 0.16 | 0.23 | 0.14 | 0.25 | 0.57 | 0.52 | PF4 | PF4 |
| 8 | 0.87 | 0.84 | 0.83 | 0.99 | 0.5 | 0.59 | 0.46 | 0.47 | 0.63 | 0.53 | PF4 | PF4 |
| 9 | 0.16 | 0.2 | 0.11 | 0.12 | 1 | 0.19 | 0.23 | 0.47 | 0.33 | 0.27 | PF5 | PF5 |
| 10 | 0.16 | 0.2 | 0.22 | 0.15 | 1 | 0.23 | 0.2 | 0.58 | 0.51 | 0.23 | PF5 | PF5 |
| 11 | 0.33 | 0.24 | 0.14 | 0.19 | 0.31 | 1 | 0.22 | 0.23 | 0.23 | 0.46 | PF6 | PF6 |
| 12 | 0.16 | 0.22 | 0.18 | 0.14 | 0.25 | 1 | 0.2 | 0.36 | 0.14 | 0.45 | PF6 | PF6 |
| 13 | 0.16 | 0.19 | 0.22 | 0.18 | 0.14 | 0.42 | 1 | 0.18 | 0.18 | 0.14 | PF7 | PF7 |
| 14 | 0.09 | 0.22 | 0.13 | 0.18 | 0.13 | 0.41 | 1 | 0.08 | 0.11 | 0.08 | PF7 | PF7 |
| 15 | 0.14 | 0.32 | 0.51 | 0.17 | 0.58 | 0.12 | 0.14 | 1 | 0.6 | 0.11 | PF8 | PF8 |
| 16 | 0.5 | 0.58 | 0.66 | 0.55 | 0.09 | 0.51 | 0.46 | 1 | 0.01 | 0.43 | PF8 | PF8 |
| 17 | 0 | 0 | 0.1 | 0.54 | 0.25 | 0 | 0.39 | 0.23 | 1 | 0.51 | PF9 | PF9 |
| 18 | 0.16 | 0.2 | 0.22 | 0.53 | 0.5 | 0.23 | 0.41 | 0.58 | 1 | 0.71 | PF9 | PF9 |
| 19 | 0.16 | 0.24 | 0.14 | 0.53 | 0.53 | 0.52 | 0.34 | 0.23 | 0.65 | 1 | PF10 | PF10 |
| 20 | 0.16 | 0.22 | 0.18 | 0.64 | 0.25 | 0.59 | 0.2 | 0.25 | 0.74 | 1 | PF10 | PF10 |
| Test no. | Pm (W) | Vpm (V) | Ipm (A) | Voc (V) | Temperature (°C) | Irradiation (W/m2) | Known fault type |
|---|---|---|---|---|---|---|---|
| 1 | 834.4 | 293.69 | 2.84 | 358.83 | 51.5 | 300 | PF1 |
| 2 | 1146.19 | 297.99 | 3.85 | 364.3 | 52.5 | 400 | PF1 |
| 3 | 1343.63 | 274.46 | 4.9 | 368.22 | 53.5 | 500 | PF2 |
| 4 | 1627.07 | 275.99 | 5.9 | 371.31 | 54.5 | 600 | PF2 |
| 5 | 1689.67 | 244.75 | 6.9 | 373.75 | 55.5 | 700 | PF3 |
| 6 | 1934.57 | 243.17 | 7.96 | 375.79 | 56.5 | 800 | PF3 |
| 7 | 1872.46 | 210.42 | 8.9 | 377.46 | 57.5 | 900 | PF4 |
| 8 | 2077.41 | 208.71 | 9.95 | 378.86 | 58.5 | 1000 | PF4 |
| 9 | 726.03 | 255.95 | 2.84 | 312.88 | 59.5 | 300 | PF5 |
| 10 | 1021.06 | 263.33 | 3.88 | 324.53 | 51.5 | 400 | PF5 |
| 11 | 1134.87 | 231.04 | 4.91 | 287.06 | 52.5 | 500 | PF6 |
| 12 | 1374.59 | 232.48 | 5.91 | 289.46 | 53.5 | 600 | PF6 |
| 13 | 1380.6 | 200.41 | 6.89 | 249.74 | 54.5 | 700 | PF7 |
| 14 | 1580.05 | 198.79 | 7.95 | 251.09 | 55.5 | 800 | PF7 |
| 15 | 2158.96 | 241.32 | 8.95 | 336.22 | 56.5 | 900 | PF8 |
| 16 | 2393.71 | 239.48 | 10 | 337.47 | 57.5 | 1000 | PF8 |
| 17 | 577.06 | 200.23 | 2.88 | 313.59 | 58.5 | 300 | PF9 |
| 18 | 791.4 | 203.64 | 3.89 | 318.54 | 59.5 | 400 | PF9 |
| 19 | 1017.84 | 208.04 | 4.89 | 287.63 | 51.5 | 500 | PF10 |
| 20 | 1232.58 | 209.42 | 5.89 | 290.01 | 52.5 | 600 | PF10 |
| Test no. | Output weight for various fault types | Known fault type | Diagnosed results | |||||||||
|---|---|---|---|---|---|---|---|---|---|---|---|---|
| PF1 | PF2 | PF3 | PF4 | PF5 | PF6 | PF7 | PF8 | PF9 | PF10 | |||
| 1 | 1 | 0.66 | 0.62 | 0.67 | 0.34 | 0.28 | 0.23 | 0.26 | 0.2 | 0.28 | PF1 | PF1 |
| 2 | 1 | 0.64 | 0.65 | 0.66 | 0.34 | 0.37 | 0.2 | 0.32 | 0.22 | 0.26 | PF1 | PF1 |
| 3 | 0.5 | 1 | 0.67 | 0.66 | 0.24 | 0.24 | 0.32 | 0.22 | 0.25 | 0.22 | PF2 | PF2 |
| 4 | 0.5 | 1 | 0.6 | 0.6 | 0.28 | 0.26 | 0.22 | 0.24 | 0.22 | 0.27 | PF2 | PF2 |
| 5 | 0.61 | 0.66 | 0.99 | 0.66 | 0.25 | 0.28 | 0.23 | 0.71 | 0.28 | 0.22 | PF3 | PF3 |
| 6 | 0.5 | 0.89 | 1 | 0.66 | 0.19 | 0.14 | 0.14 | 0.68 | 0.15 | 0.08 | PF3 | PF3 |
| 7 | 0.5 | 0.63 | 0.62 | 1 | 0.22 | 0.35 | 0.15 | 0.44 | 0.66 | 0.64 | PF4 | PF4 |
| 8 | 0.41 | 0.58 | 0.57 | 1 | 0.17 | 0.55 | 0.31 | 0.37 | 0.66 | 0.68 | PF4 | PF4 |
| 9 | 0.16 | 0.22 | 0.19 | 0.1 | 1 | 0.28 | 0.23 | 0.44 | 0.44 | 0.28 | PF5 | PF5 |
| 10 | 0.16 | 0.32 | 0.23 | 0.19 | 0.98 | 0.37 | 0.2 | 0.52 | 0.4 | 0.26 | PF5 | PF5 |
| 11 | 0.33 | 0.24 | 0.19 | 0.22 | 0.24 | 1 | 0.32 | 0.43 | 0.25 | 0.58 | PF6 | PF6 |
| 12 | 0.15 | 0.22 | 0.18 | 0.17 | 0.28 | 1 | 0.22 | 0.35 | 0.22 | 0.59 | PF6 | PF6 |
| 13 | 0.12 | 0.19 | 0.19 | 0.22 | 0.25 | 0.56 | 1 | 0.28 | 0.28 | 0.22 | PF7 | PF7 |
| 14 | 0.12 | 0.22 | 0.12 | 0.22 | 0.19 | 0.37 | 1 | 0.19 | 0.15 | 0.08 | PF7 | PF7 |
| 15 | 0.12 | 0.28 | 0.52 | 0.11 | 0.6 | 0.18 | 0.15 | 1 | 0.48 | 0.15 | PF8 | PF8 |
| 16 | 0.02 | 0.26 | 0.55 | 0.19 | 0.84 | 0.4 | 0.12 | 1 | 0.53 | 0.15 | PF8 | PF8 |
| 17 | 0 | 0 | 0 | 0.52 | 0.2 | 0 | 0.18 | 0.17 | 1 | 0.56 | PF9 | PF9 |
| 18 | 0.16 | 0.2 | 0.23 | 0.52 | 0.61 | 0.37 | 0.2 | 0.55 | 1 | 0.81 | PF9 | PF9 |
| 19 | 0.16 | 0.42 | 0.19 | 0.55 | 0.38 | 0.59 | 0.32 | 0.22 | 0.7 | 1 | PF10 | PF10 |
| 20 | 0.15 | 0.22 | 0.18 | 0.57 | 0.28 | 0.54 | 0.22 | 0.24 | 0.72 | 1 | PF10 | PF10 |
Furthermore, to verify the anti-interference ability of the proposed fault diagnosis framework, we altered the test samples, situating (1) a 5% maximum power reduction, (2) a 10% maximum power point voltage increase, (3) a 20% maximum power point current decrease, and (4) a 10% open-circuit voltage increase, and the data that contained additional errors are, respectively, listed in Tables 8 and 10. Based on the detection results in Tables 9 and 11, after adding the errors, the proposed fault diagnosis system still can correctly detect the fault types all of the data sets. Although the output weight values of various fault types for each test data have been changed in Tables 9 and 11 due to error interference, the most possibility occurrence on fault type is unaltered. Furthermore, the order of possibility occurrence on fault type for each test data is almost one and all as shown in Tables 5 and 7 (without error addition). Therefore, whether an error or error interference was added did not influence the proposed method’s ability to correctly detect the fault types of the test data.
| Test no. | Pm (W) | Vpm (V) | Ipm (A) | Voc (V) | Temperature (°C) | Irradiation (W/m2) | Known fault type |
|---|---|---|---|---|---|---|---|
| 1 | 825.96 * | 341.92 * | 2.8 | 372.56 | 31.5 | 300 | PF1 |
| 2 | 1195.23 | 313.34 | 3.04 * | 415.73 * | 32.5 | 400 | PF1 |
| 3 | 1399.53 | 289.25 | 3.87 * | 420 * | 33.5 | 500 | PF2 |
| 4 | 1695.32 | 319.68 * | 5.83 | 423.42 * | 34.5 | 600 | PF2 |
| 5 | 1670.43 * | 255.11 | 5.51 * | 387.41 | 35.5 | 700 | PF3 |
| 6 | 2013.52 | 282.55 * | 6.27 * | 389.52 | 36.5 | 800 | PF3 |
| 7 | 1949.64 | 219.32 | 7.11 * | 430.38 * | 37.5 | 900 | PF4 |
| 8 | 2055.82 * | 217.65 | 7.95 * | 392.78 | 38.5 | 1000 | PF4 |
| 9 | 761.64 | 295.88 * | 2.83 | 359.45 * | 39.5 | 300 | PF5 |
| 10 | 1011.02 * | 305.59 * | 3.83 | 336.43 | 31.5 | 400 | PF5 |
| 11 | 1124.59 * | 244.95 | 4.83 | 327.19 * | 32.5 | 500 | PF6 |
| 12 | 1362.03 * | 270.81 * | 5.82 | 299.85 | 33.5 | 600 | PF6 |
| 13 | 1441.41 | 209.59 | 5.5 * | 284.55 * | 34.5 | 700 | PF7 |
| 14 | 1567.73 * | 228.6 * | 7.94 | 260.08 | 35.5 | 800 | PF7 |
| 15 | 2251.15 | 276.31 * | 7.16 * | 348.29 | 36.5 | 900 | PF8 |
| 16 | 2373.74 * | 253.42 | 9.86 | 384.59 * | 37.5 | 1000 | PF8 |
| 17 | 602.75 | 232.45 * | 2.28 * | 327.28 | 38.5 | 300 | PF9 |
| 18 | 785.31 * | 234.09 * | 3.88 | 332.09 | 39.5 | 400 | PF9 |
| 19 | 1057.41 | 238.64 * | 4.87 | 327.62 * | 31.5 | 500 | PF10 |
| 20 | 1281.44 | 218.22 | 4.69 * | 330.25 * | 32.5 | 600 | PF10 |
| Variance | −5% | +10% | −20% | +10% | |||
- *Indicates the addition of variance in the test data.
| Test no. | Output weight for various fault types | Known fault type | Diagnosed results | |||||||||
|---|---|---|---|---|---|---|---|---|---|---|---|---|
| PF1 | PF2 | PF3 | PF4 | PF5 | PF6 | PF7 | PF8 | PF9 | PF10 | |||
| 1 | 0.83 | 0.6 | 0.55 | 0.74 | 0.29 | 0.19 | 0.23 | 0.24 | 0.32 | 0.5 | PF1 | PF1 |
| 2 | 0.83 | 0.4 | 0.44 | 0.46 | 0 | 0 | 0 | 0 | 0 | 0 | PF1 | PF1 |
| 3 | 0.33 | 0.73 | 0.63 | 0.6 | 0 | 0 | 0 | 0 | 0.24 | 0.17 | PF2 | PF2 |
| 4 | 0.77 | 0.83 | 0.6 | 0.5 | 0.25 | 0.27 | 0.2 | 0.25 | 0.14 | 0.19 | PF2 | PF2 |
| 5 | 0.33 | 0.61 | 0.67 | 0.36 | 0.27 | 0.18 | 0 | 0.36 | 0 | 0 | PF3 | PF3 |
| 6 | 0.36 | 0.63 | 0.66 | 0.42 | 0.33 | 0 | 0.21 | 0.25 | 0 | 0 | PF3 | PF3 |
| 7 | 0.35 | 0.45 | 0.62 | 0.82 | 0 | 0.1 | 0.1 | 0.13 | 0.39 | 0.41 | PF4 | PF4 |
| 8 | 0.74 | 0.76 | 0.66 | 0.83 | 0.37 | 0.38 | 0.65 | 0.38 | 0.36 | 0.24 | PF4 | PF4 |
| 9 | 0.16 | 0.2 | 0.11 | 0.12 | 0.58 | 0.19 | 0.23 | 0.24 | 0.1 | 0.27 | PF5 | PF5 |
| 10 | 0.5 | 0.2 | 0.22 | 0.15 | 0.6 | 0.2 | 0.5 | 0.51 | 0.23 | 0.2 | PF5 | PF5 |
| 11 | 0.16 | 0.24 | 0.14 | 0.19 | 0.47 | 0.62 | 0.22 | 0.45 | 0.48 | 0.2 | PF6 | PF6 |
| 12 | 0.16 | 0.22 | 0.18 | 0.14 | 0.56 | 0.69 | 0.2 | 0.25 | 0.14 | 0.45 | PF6 | PF6 |
| 13 | 0 | 0 | 0 | 0 | 0.09 | 0.24 | 0.5 | 0 | 0 | 0 | PF7 | PF7 |
| 14 | 0.09 | 0.22 | 0.13 | 0.18 | 0.13 | 0.17 | 0.52 | 0.08 | 0.11 | 0.08 | PF7 | PF7 |
| 15 | 0 | 0.16 | 0.14 | 0 | 0.56 | 0 | 0.1 | 0.67 | 0.42 | 0 | PF8 | PF8 |
| 16 | 0.43 | 0.55 | 0.47 | 0.46 | 0.61 | 0.5 | 0.73 | 0.91 | 0.74 | 0.77 | PF8 | PF8 |
| 17 | 0 | 0 | 0 | 0.14 | 0.25 | 0 | 0.38 | 0.23 | 0.54 | 0.27 | PF9 | PF9 |
| 18 | 0.16 | 0.4 | 0.22 | 0.15 | 0.61 | 0.23 | 0.41 | 0.58 | 0.62 | 0.23 | PF9 | PF9 |
| 19 | 0.16 | 0.24 | 0.14 | 0.27 | 0.41 | 0.47 | 0.34 | 0.45 | 0.58 | 0.84 | PF10 | PF10 |
| 20 | 0 | 0 | 0 | 0.5 | 0.34 | 0 | 0 | 0.2 | 0.57 | 0.78 | PF10 | PF10 |
| Test no. | Pm (W) | Vpm (V) | Ipm (A) | Voc (V) | Temperature (°C) | Irradiation (W/m2) | Known fault type |
|---|---|---|---|---|---|---|---|
| 1 | 792.68 * | 323.06 * | 2.84 | 358.83 | 51.5 | 300 | PF1 |
| 2 | 1146.19 | 327.78 * | 3.08 * | 364.3 | 52.5 | 400 | PF1 |
| 3 | 1276.44 * | 301.9* | 4.9 | 368.22 | 53.5 | 500 | PF2 |
| 4 | 1545.71 * | 275.99 | 5.9 | 408.44 * | 54.5 | 600 | PF2 |
| 5 | 1689.67 | 269.22 * | 5.52 * | 373.75 | 55.5 | 700 | PF3 |
| 6 | 1837.84 * | 243.17 | 7.96 | 413.36 * | 56.5 | 800 | PF3 |
| 7 | 1872.46 | 231.46 * | 7.12 * | 377.46 | 57.5 | 900 | PF4 |
| 8 | 1973.53 * | 229.58 * | 9.95 | 378.86 | 58.5 | 1000 | PF4 |
| 9 | 726.03 | 255.95 | 2.27 * | 344.16 * | 59.5 | 300 | PF5 |
| 10 | 1021.06 | 289.66 * | 3.88 | 356.98 * | 51.5 | 400 | PF5 |
| 11 | 1078.12 * | 231.04 | 3.92 * | 287.06 | 52.5 | 500 | PF6 |
| 12 | 1305.86 * | 255.72 * | 5.91 | 289.46 | 53.5 | 600 | PF6 |
| 13 | 1380.6 | 200.41 | 5.51 * | 274.71 * | 54.5 | 700 | PF7 |
| 14 | 1580.05 | 218.66 * | 6.36 * | 251.09 | 55.5 | 800 | PF7 |
| 15 | 2051.01 * | 241.32 | 8.95 | 369.84 * | 56.5 | 900 | PF8 |
| 16 | 2393.71 | 239.48 | 8 * | 371.21 * | 57.5 | 1000 | PF8 |
| 17 | 577.06 | 220.25 * | 2.3 * | 313.59 | 58.5 | 300 | PF9 |
| 18 | 751.83 * | 224 * | 3.89 | 318.54 | 59.5 | 400 | PF9 |
| 19 | 1017.84 | 228.84 * | 3.91 * | 287.63 | 51.5 | 500 | PF10 |
| 20 | 1232.58 | 209.42 | 4.71 * | 319.01 * | 52.5 | 600 | PF10 |
| Variance | −5% | +10% | −20% | +10% | |||
- *Indicates the addition of variance in the test data.
| Test no. | Output weight for various fault type | Known fault type | Diagnosed results | |||||||||
|---|---|---|---|---|---|---|---|---|---|---|---|---|
| PF1 | PF2 | PF3 | PF4 | PF5 | PF6 | PF7 | PF8 | PF9 | PF10 | |||
| 1 | 0.83 | 0.66 | 0.62 | 0.68 | 0.34 | 0.28 | 0.23 | 0.26 | 0.43 | 0.54 | PF1 | PF1 |
| 2 | 0.83 | 0.43 | 0.42 | 0.47 | 0 | 0 | 0 | 0 | 0 | 0 | PF1 | PF1 |
| 3 | 0.66 | 0.83 | 0.67 | 0.66 | 0.34 | 0.24 | 0.32 | 0.22 | 0.25 | 0.22 | PF2 | PF2 |
| 4 | 0.5 | 0.89 | 0.6 | 0.6 | 0.4 | 0.26 | 0.22 | 0.24 | 0.22 | 0.27 | PF2 | PF2 |
| 5 | 0.49 | 0.47 | 0.56 | 0.44 | 0.31 | 0 | 0.11 | 0.17 | 0 | 0 | PF3 | PF3 |
| 6 | 0.5 | 0.66 | 0.87 | 0.66 | 0.4 | 0.39 | 0.14 | 0.49 | 0.15 | 0.08 | PF3 | PF3 |
| 7 | 0.37 | 0.48 | 0.47 | 0.66 | 0 | 0.46 | 0 | 0.25 | 0.24 | 0.24 | PF4 | PF4 |
| 8 | 0.41 | 0.58 | 0.57 | 0.8 | 0.17 | 0.77 | 0.31 | 0.37 | 0.39 | 0.41 | PF4 | PF4 |
| 9 | 0 | 0 | 0 | 0 | 0.44 | 0 | 0.2 | 0 | 0 | 0 | PF5 | PF5 |
| 10 | 0.53 | 0.64 | 0.65 | 0.66 | 0.83 | 0.37 | 0.2 | 32 | 0.22 | 0.26 | PF5 | PF5 |
| 11 | 0 | 0 | 0.12 | 0.12 | 0 | 0.64 | 0 | 42 | 0.19 | 0.45 | PF6 | PF6 |
| 12 | 0.15 | 0.22 | 0.18 | 0.17 | 0.54 | 0.82 | 0.22 | 0.24 | 0.22 | 0.59 | PF6 | PF6 |
| 13 | 0 | 0 | 0 | 0 | 0 | 0.28 | 0.5 | 0 | 0 | 0 | PF7 | PF7 |
| 14 | 0 | 0 | 0 | 0 | 0 | 0.37 | 0.59 | 0 | 0 | 0 | PF7 | PF7 |
| 15 | 0.5 | 0.63 | 0.47 | 0.56 | 0.22 | 0.27 | 0.15 | 0.85 | 0.12 | 0.15 | PF8 | PF8 |
| 16 | 0.38 | 0.64 | 0.47 | 0.41 | 0.27 | 0.14 | 0.09 | 0.87 | 0 | 0.05 | PF8 | PF8 |
| 17 | 0 | 0 | 0 | 0.13 | 0.2 | 0.18 | 0.38 | 0.17 | 0.46 | 0.28 | PF9 | PF9 |
| 18 | 0.16 | 0.43 | 0.23 | 0.19 | 0.45 | 0.45 | 0.55 | 0.41 | 0.75 | 0.26 | PF9 | PF9 |
| 19 | 0 | 0.17 | 0.12 | 0.22 | 0.14 | 0.57 | 0 | 0.42 | 0.33 | 0.64 | PF10 | PF10 |
| 20 | 0 | 0 | 0 | 0.39 | 0.22 | 0 | 0.25 | 0.29 | 0.43 | 0.75 | PF10 | PF10 |
6. Conclusion
This study proposed a photovoltaic power generation system fault diagnosis method based on the CMAC. Following training, the CMAC diagnosis framework conducts fault diagnoses on the data of operating photovoltaic power module arrays. The CMAC can associate, summarize, and possesses the characteristic of similar input signals exciting similar memory. Therefore, it exhibits an excellent classification accuracy rate. Furthermore, the CMAC can automatically associate and output the most probable fault type based on the similarity of the test data and specific fault patterns. Despite the presence of additional noise interference in the test data, the diagnosis results verified the accuracy and robustness of the diagnosis framework. In addition, the reduced amount of used memory, increased learning speed, and enhanced tolerance further verifies the CMAC’s superior performance.
Conflict of Interests
The authors of the paper declare that there is no conflict of interests with any of the commercial identities mentioned in the paper.
Acknowledgment
This work was supported by the National Science Council, Taiwan, under Grant NSC 101–2221-E-167-030.


