Performance of Grid-Connected Photovoltaic System in Two Sites in Kuwait
Abstract
This paper presents an assessment of the electricity generated by photovoltaic (PV) grid-connected systems in Kuwait. Three years of meteorological data are provided for two main sites in Kuwait, namely, Al-Wafra and Mutla. These data and a PV grid-connected system mathematical model are used to assist a 100 kWp grid-connected PV system proposed for both sites. The proposed systems show high energy productivity whereas the annual capacity factors for Mutla and Al-Wafra are 22.25% and 21.6%, respectively. Meanwhile the annual yield factors for Mutla and Al-Wafra are 1861 kWh/kWp/year and 1922.7 kWh/kWp/year, respectively. On the other hand the cost of the energy generated by both systems is about 0.1 USD/kWh which is very close to the price of the energy sold by the Ministry of Electricity and Water (MEW). Furthermore the invested money is recovered during the assumed life cycle time whereas the payback period for both sites is about 15 years. This work contains worthwhile technical information for those who are interested in PV technology investment in Kuwait.
1. Introduction
Based on the fact that PV systems are clean, environment friendly, and secure energy sources, PV system installation has played an important role worldwide. However, the drawback of PV systems is the high capital cost as compared to conventional energy sources. Therefore, many research works are carried out currently focusing on optimization of PV systems [1]. Grid-connected PV systems can be divided into two parts: building integrated PV systems (BiPV) and distribution generation PV (DGPV) systems. BiPV systems usually supply a specific load and inject the excess energy to the grid. On the other hand the DGPV systems inject the whole produced energy to the grid without feeding any local load. The grid-connected systems can consist of a PV array only as an energy source, or anther energy source can be in cooperation with the PV array such as wind turbine, diesel system, or a storage unit [2].
PV system size and performance strongly depend on metrological variables such as solar energy, wind speed, and ambient temperature and, therefore, to optimize a PV system, extensive studies related to the metrological variables have to be done [3]. The importance of the meteorological data in sizing PV systems lies in the fact that the PV modules output energy strongly depends on the available solar energy and the ambient temperature, while the wind turbines (in case of hybrid PV/Wind systems) output power is a function of the available wind speed.
The performance of a PV module strongly depends on the sun light conditions. Standard sunlight conditions on a clear day are assumed to be 1000 watt of solar energy per square meter and it is sometimes called “one sun” or a “peak sun.” Less than one sun will reduce the current output of a PV module by a proportional amount [1]. Furthermore, cell temperature, Tc, is an important factor in determining the performance of PV cells. The increase in cell temperature decreases PV module’s voltage linearly, while increasing cell temperature increases PV module’s current. The effect of cell temperature on PV modules performance depends on PV cells manufacturing. However, increasing cell temperature by 1 Celsius, C, degree decreases PV modules voltage by 0.085–0.123 V. On the other hand, increasing cell temperature by 1 C increases PV modules current by 0.0026–0.0032 A [1]. Based on this, increasing cell temperature by 1 C degree decreases PV module’s power by 0.5-0.6%. In general, most of PV modules are being tested at 25 C degrees; thus, a different output power is expected when PV modules are working under different climate conditions. As for wind speed, the wind turbine output energy depends on the amount of wind power which hits the blades of a wind turbine. Therefore, to predict the energy produced by a wind turbine located in a specific location, a comprehensive study of the wind speed characteristic for this location must be done.
In general, the most common optimization methodology that is followed by the researchers starts by defining a specific area, and then a time series data for solar energy, ambient temperature, and wind (in case of hybrid PV/wind system) must be obtained. After that, the calculation of optimum tilt angle is conducted by modeling the solar energy on a tilt surface. Then based on the nature of the PV system (standalone, grid, or hybrid) the calculation of system energy sources (PV array battery, wind turbine, and diesel generator) optimum capacity is done. Finally, the size of the inverter in the PV system is calculated optimally.
However, according to a World Bank report published in 2010, the electricity production (MWh) in Kuwait was reported at 57082 GWh in 2010 [4]. This energy is totally generated by fossil fuel (64.4% oil sources and 35.7% natural gas), while the alternative energy sources including solar, wind, hydro-, and nuclear ones are not used at all [5]. Based on this, the Kuwaiti government has set recently the most ambitious target for using renewable energy in the Gulf region. The new Kuwaiti government renewable energy policy aims to generate 10% of its electricity from sustainable sources by 2020. The Kuwaiti government is trying to free up oil for export and expand its generation capacity to support increased tourism, manufacturing, and home building in a $112-billion development program. However, renewable energy is a new subject for Kuwait, and that is why there is a lack of information regarding the suitability of renewable energy sources for Kuwait’s weather [6].
Kuwait is a desert country with high numbers of sun shining hour per day and, therefore, the use of PV grid-connected systems for electricity generation is promising at this country. Based on this, the main objective of this paper is to assist the electricity generated by PV grid-connected systems located at two main sites in Kuwait, namely, Al-Wafra and Mutla. This assessment—which is done using technical and economical criteria—provides worthwhile information for those who are interested in PV system installation at Kuwait. This work is done based on real meteorological data for the period 2009–2011. These data are provided by the Kuwait National Meteorological Network (KNMN) at KISR.
2. Solar Energy Potential in the Selected Sites
In this paper weather profiles for two sites located in Kuwait, namely, Mutla and Al-Wafra are analyzed. Mutla is located at latitude N 29° 22′ 54′′ and longitude 47° 37′ 50′′. Meanwhile Al-Wafra is located at latitude: 28° 37′ 01′′ and longitude 48° 00′ 29′′. The analyzed weather profiles contain solar radiation and ambient temperature data for three years (2009–2011). Figure 1 shows the mean hourly solar radiation for both sites. From the figure, both sites have almost the same solar radiation profile whereas it reaches the maximum value (1000 W/m2) in the summer time (June–August) while the minimum mean value is usually happening in the winter time (November–February). However both sites are desert sites with high clearness index along the year and, therefore, most of global solar radiation recorded consisted of direct solar radiation. On the other hand, Figure 2 shows the ambient temperature profile for both sites. The ambient temperature for both sites is in the range of 10–50°C with peak value in the summer time and minimum value in the winter time.
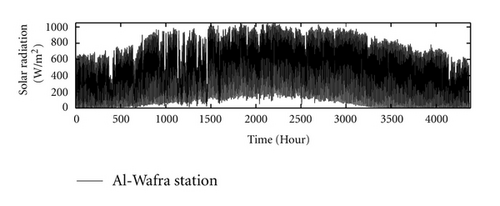
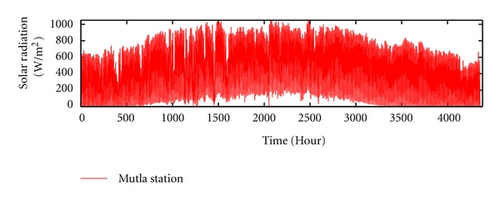
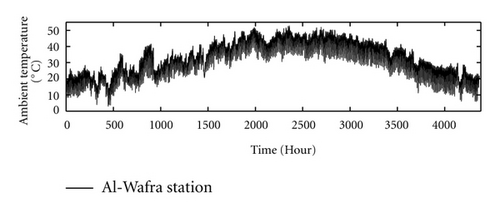
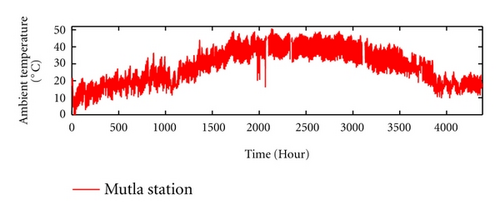
Table 1 shows the monthly mean daily solar radiation and ambient temperature for Al-Wafra and Mutla sites. The average ambient temperature for both sites is 28.78°C, and 30.8°C, respectively. On the other hand the average solar radiation for Mutla site is 476 W/m2. This means that the annual mean daily solar energy received at this site is 5.712 kWh/m2 (the peak sunshine hours is 5.7). As for Al-Wafra, the annual mean daily solar radiation is 481 W/m2 which leads to that the annual mean daily solar energy is 5.772 kWh/m2 (the peak sunshine hours is 5.8). Based on this, both sites have high solar energy potential and it is expected that PV systems productivity will be high as compared to other renewable energy alternatives.
| Month | Mutla station | Al-Wafra station | ||
|---|---|---|---|---|
| Solar radiation | Temperature | Solar radiation | Temperature | |
| JAN | 319 (W/m2) | 14.3 (°C) | 326 (W/m2) | 14.7 (°C) |
| FEB | 325 (W/m2) | 19.4 (°C) | 351 (W/m2) | 19.9 (°C) |
| MAR | 446 (W/m2) | 23.1 (°C) | 494 (W/m2) | 23.4 (°C) |
| APR | 484 (W/m2) | 28.6 (°C) | 473 (W/m2) | 24.9 (°C) |
| MAY | 512 (W/m2) | 37.8 (°C) | 568 (W/m2) | 37.2 (°C) |
| JUN | 546 (W/m2) | 42.2 (°C) | 629 (W/m2) | 42.9 (°C) |
| JUL | 599 (W/m2) | 42.5 (°C) | 624 (W/m2) | 44.3 (°C) |
| AUG | 604 (W/m2) | 42 (°C) | 578 (W/m2) | 43.6 (°C) |
| SEP | 565 (W/m2) | 36.9 (°C) | 564 (W/m2) | 40.8 (°C) |
| OCT | 514 (W/m2) | 31.6 (°C) | 459 (W/m2) | 33.7 (°C) |
| NOV | 423 (W/m2) | 20.2 (°C) | 387 (W/m2) | 26 (°C) |
| DEC | 378 (W/m2) | 18.9 (°C) | 319 (W/m2) | 18.3 (°C) |
| AV. | 476 (W/m2) | 29.79 (°C) | 481 (W/m2) | 30.8 (°C) |
3. PV Grid-Connected System Model
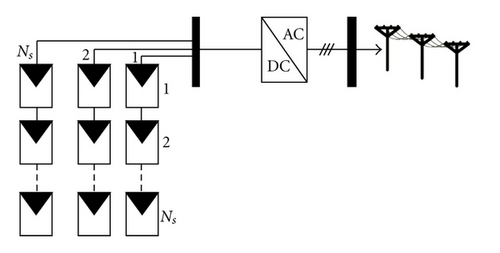
Figure 3 shows the typical component of a grid-connected system consisting of a PV array, DC-AC inverter and a grid interconnection point. Based on this, the mathematical model of the PV grid-connected system must contain the mathematical model of the PV array as well as the inverter [7].
3.1. PV Array Mathematical Model
To extract maximum power from a PV array which is under varying weather and load conditions, maximum power point trackers (MPPTs) are used. Such a device ensures maximum power operation of PV array and in this case the PV array is assumed to be operating at maximum power output, Ppeak. However, based on (1), the calculation of PV array output power requires solar radiation and ambient temperature records, and, therefore, hourly solar radiation and ambient temperature records for the adopted sites have been obtained.
3.2. Inverter Mathematical Model
Ignoring the wire efficiency, the input power to the PV system is the output power of the PV module. The PLoss is not constant but depends on many conditions which make it difficult to be calculated. Thus, an alternative model for inverter efficiency needs to be developed in order to estimate the inverter’s output power.
Figure 4 shows an efficiency curve for a commercial inverter obtained from the datasheet. The curve describes the inverter’s efficiency (in percent) in terms of input power and inverter rated power.
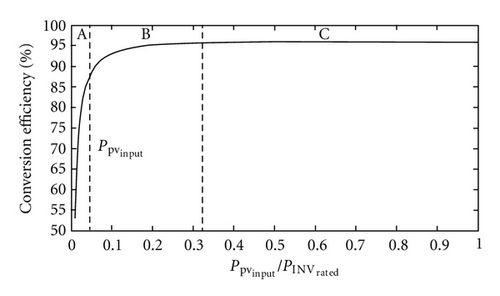
A MATLAB fitting tool can be used for calculating the developed inverter model coefficients, c1–c3. Therefore, samples of the inverter’s efficiency curve shown in Figure 4 must be taken for the purpose of curve fitting using the MATLAB fitting tool. Intensive number of samples must be taken for a specific part of the curve as in zone B, less intensive number of samples are taken from the zone A, while few samples are taken from the zone C as described in Figure 4.
4. PV Grid-Connected Evaluation Criteria
To judge the feasibility of a grid-connected PV system, technical and economical evaluation criteria can be applied. In this paper technical criteria, namely, capacity factor and yield factor are applied. On the other hand, the cost of energy produced by the system (CoE) and the payback period are used as economical evaluation criteria.
5. Results and Discussion
| PV module type | KYOCERA (KC200GT) |
| PV module capacity | 200 Wp |
| Maximum current | 7.10 |
| Maximum voltage | 16.9 |
| Open circuit voltage | 21.5 |
| Short circuit current | 7.45 |
| Efficiency (G > 200 W/m2) | 12.75% |
| Efficiency (G < 200 W/m2) | 14.5% |
| Temperature coefficient of power | −3.9 × 10⁻³/°C |
Table 3 shows the assumed units cost for the PV system in calculating the LCC, CoE, and PBP. The life cycle time of the PV system is assumed to be 20 years.
| Unit | Price |
|---|---|
| PV array | 3.8/Wp USD |
| Inverter 100 kWp | 32,000.00 USD |
| O&M | 500 USD/year |
| Salvage | 20% of the capital cost |
| Wires and circuit breakers | 7,000.00 USD |
| Support structure | 5,000.00 USD |
| Civil work and transportation | 3,000.00 USD |
| Cost of kWh in Kuwait | 0.10 USD |
5.1. Al-Wafra Site
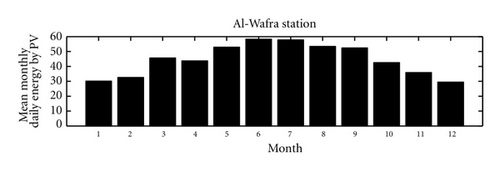
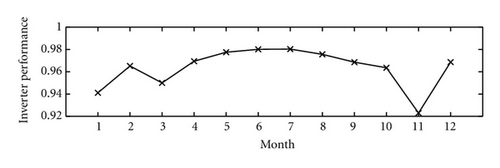
Figure 5 shows the monthly mean daily energy generated (kWh/month) by the system. The annual energy generation by the system is 192.270 MWh. According to this the final yield factor for this system is 1922.7 kWh/kWp/year. Meanwhile the average capacity factor is 22.25%. As for the performance of the inverter, a performance factor for the inverter is defined in this paper. This performance factor equals to the ratio of the annual mean daily conversion efficiency to the rated efficiency provided by the manufacturer. Based on this the performance factor of the used inverter is 96.4%. However, the LCC of the proposed system for Al-Wafra is 371000 USD. This means that the unit cost of this system is 0.0965 USD/kWh and the payback period is 15.6 years.
5.2. Mutla Site
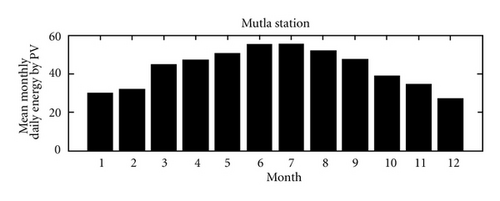
The mean monthly daily energy generated (kWh/month) by the system is shown in Figure 6. The annual energy generation by the system is 186.11 MWh. Meanwhile, the capacity factor for this system is 21.6% and the final yield factor is 1861 kWh/kWp/year. The performance factor of the used inverter is 95.9%. As for the system cost, the LCC of the proposed system for Al-Wafra is 371000 USD. In addition, the unit cost of this system is 0.0997 USD/kWh and the payback period is 16.1 years.

5.3. Systems Productivity Evaluation
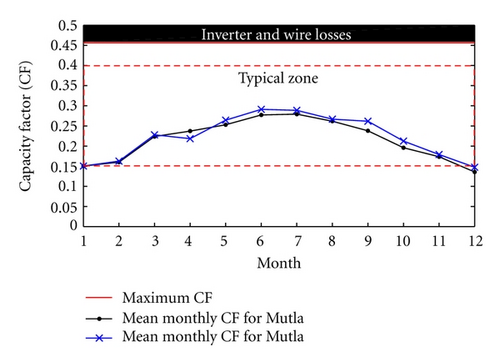
As mentioned before, the yield factor and the capacity factor criteria are used to assist the productivity of the proposed systems. In general the capacity factor is used to assist the usage of a power source. The CF is ratio of the energy generated by these sources to the maximum energy that could be generated according to the source’s ratings and for 24 hours. However, for a PV power source the sun is only available for 12 hours a day and thus the ideal CF is 0.5 due to the unavailability of sun during the night. In addition to that, the maximum real CF is slightly lower than 0.5 due to the energy conversion losses [8–10]. In general the typical CF for a PV array is in the range of 0.15–0.4 [8–10]. However, in this paper the maximum CF is 0.4557 after considering the assumed energy conversion losses. Figure 7 shows the monthly mean daily CF for both sites. The CF values for both systems are in the range of (0.15–0.31) which means that both system’s operation are in the typical operation zone.
On the other hand, the yield factor measures the productivity of the PV system. However, there is no typical range for the yield factor because this factor is a location-dependant factor. That is to say, each county (climate zone) has its own typical yield factor. In [10] the typical field factors for 6 countries are reported. The typical YF for Germany is in the range of 400–1300 kWh/kWp/year, while it is in the range of 470–1230 kWh/kWp/year for Japan. Furthermore, the typical yield factor for The Netherlands, Italy, Switzerland, and Israel are 400–900, 450–1250, 450–1400, and 740–2010 kWh/kWp/year, respectively. As for Kuwait, Figure 8 shows the range of the YF for both systems. The monthly mean of YF for Mutla is in the range of 97–201 kWh/kWp/month; meanwhile it is in the range of 106–209 for Al-Wafra. However, as mentioned before, the annual YF for Mutla and Al-Wafra are 1861 kWh/kWp/year and 1922.7 kWh/kWp/year, respectively. This proves that the PV technology in Kuwait has almost the best performance when compared to the counties reported by [10].

6. Conclusion
In this paper the performance of a 100 kWp grid-connected PV systems was studied for two sites, namely, Al-Wafra and Mutla in Kuwait. The proposed systems showed high energy productivity whereas the annual capacity factors for Mutla and Al-Wafra were 22.25% and 21.6%, respectively. Meanwhile the annual yield factor for Mutla and Al-Wafra were 1861 kWh/kWp/year and 1922.7 kWh/kWp/year, respectively. On the other hand the cost of the energy generated by both systems was about 0.1 USD which is very close to the price of the cost of energy sold by the Kuwaiti electricity company. Furthermore the invested money is recovered during the assumed life cycle time whereas the payback period for both sites was about 15 years. Such a work is helpful for PV technology investments in Kuwait.


