Optimizing sample collection methods for detection of respiratory viruses in poultry housing environments
Abstract
Viral respiratory diseases, such as avian influenza, Newcastle disease, infectious bronchitis and infectious laryngotracheitis, have considerable negative economic implications for poultry. Ensuring the virus-free status of premises by environmental sampling after cleaning and disinfection is essential for lifting a quarantine and/or safely restocking the premises following an outbreak. The objectives of this study were to identify optimal sample collection devices and to determine the locations in poultry housing which are best for poultry respiratory virus sample collection. Chickens exposed to infectious bronchitis virus, which was used as a representative virus for enveloped poultry respiratory viruses, were housed in floor-pens in either a curtain-sided wood framed house or a cement block house. Foam swabs, cellulose sponges, polyester swabs, dry cotton gauze and pre-moistened cotton gauze were evaluated for comparative efficiency in recovering viral RNA. Cotton gauze pre-moistened with the viral transport media had the highest sensitivity among the devices (wood-framed house: 78% positive, geometric mean titre [GMT] of 2.6 log10 50% egg infectious doses [EID50] equivalents/ml; cement block houses: 55% positive, GMT of 1.7 log10 EID50 equivalents/ml). Targeting virus deposition sites is also crucial for efficient virus elimination procedures and subsequent testing; therefore, 10 locations within the houses were compared for virus detection. In both housing types, the highest viral RNA loads were recovered from the tops of drinker lines within the pen. Places the chickens could contact directly (e.g., feeder rim) or were contacted by caretaker feet (hallway floor) also yielded higher levels of viral RNA more consistently. These results will facilitate the establishment of efficient environmental sampling procedures for respiratory viruses of poultry.
1 INTRODUCTION
Various studies have demonstrated that viruses can survive in the environment long enough to infect a new host, which is a critical factor in indirect transmission (Abad et al., 1994; Gwaltney & Hendley, 1982; Springthorpe & Sattar, 1990). In addition to transmission to replacement birds, transmission between poultry farms may be attributed to fomites (Alexander, 1995; Dent et al., 2008). Therefore, ensuring that an infected premises is free of residual virus after cleaning and disinfection following an outbreak is important for lifting quarantine and resuming normal operations.
In particular, respiratory viruses of poultry, such as avian influenza virus (AIV), infectious bronchitis virus (IBV), infectious laryngotrachetis virus and Newcastle disease virus (NDV), have substantial negative economic implications for the poultry industry worldwide (Jackwood, 2012; Swayne & King, 2003). Oral and respiratory excretions from infected birds are the primary sources of in-house contaminations and disease perpetuation for these viruses (Jonges et al., 2015; Kinde et al., 2004).
To prevent indirect transmission of high consequence viruses between flocks, accurate and predictable environmental sampling and testing is required to confirm that cleaning and disinfection have eliminated virus from the environment. Surface sampling of the environment has been widely used to evaluate viral contamination in different environments and the efficacy of proper disinfection procedures after an outbreak (Rodriguez-Lazaro et al., 2012; Rose et al., 2016). However, there is currently no standardized approach for environmental sampling on poultry farms, as data on sample collection devices and optimal locations in poultry housing are lacking.
The objective of this study was to identify the optimal sample collection devices and to compare sample collection locations for virus detection. Samples were collected from poultry facilities with floor-reared chickens that have numerous features of commercial poultry houses, such as wood surfaces, litter, equipment such as nipple drinker lines, feeders and curtain siding. A follow-up study was conducted in colony houses to provide additional data on sample collection devices and areas within the house, which should be targeted because they provide the highest viral load. The detection sensitivity of the sampling devices and different sampling locations were assessed. Viral loads from each specific target area were also examined.
2 MATERIAL AND METHODS
2.1 Viruses
Massachusetts (Mass), Georgia 08 (GA08)-type infectious bronchitis (IBV) vaccine strains and wild-type Delmarva (DMV/1639) IBV strains were provided by the Poultry Diagnostic Research Center, University of Georgia. IBV was used as a representative virus for enveloped poultry respiratory viruses. Viruses were propagated in embryonating chicken eggs and titrated based on standard methods described previously (Spackman & Stephens, 2016).
2.2 Animals
Commercial broiler hatching eggs incubated to 18 days of age were obtained from a local poultry producer prior to in ovo vaccination and were hatched at the University of Georgia Poultry Diagnostic and Research Center. All procedures using chickens were reviewed and approved by the University of Georgia Institutional Animal Care and Use Committee (protocol number A2019 02-016-Y3-A1).
2.3 Experiment 1: Wood framed poultry house
The aim of this experiment was to identify the optimal sample collection device and target area for sample collection in a wood framed, curtain sided poultry house with floor pens. A flock of 7-week-old broiler chickens was exposed to Mass IBV by course aerosol spray with a titre of 105 50% egg infectious doses per ml (EID50/ml). Prior to challenge, a set of negative control samples was collected to confirm specificity. A total of 1664 samples were collected from various locations at different times after virus exposure: 30 min, 24 h, 48 h, 96 h and 108 h (Figure Tables 1a; S1 and S2).
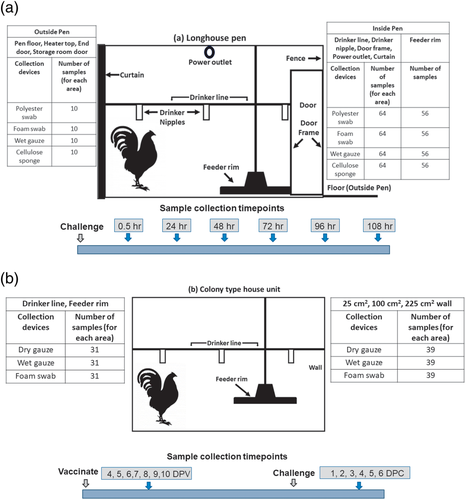
Four collection devices were evaluated: (1) polyester swabs (#25-806-1PD, Puritan Medical Products Co., LLC, Guilford, ME); (2) foam swabs (25-1607-1PF, Puritan Medical Products); (3) 10.2 cm × 10.2 cm (4″ × 4″) 12-ply cotton gauze pads (#3354, Dynarex Corp., Orangeburg, NY) pre-moistened with BHI media immediately prior to sample collection and (4) pre-moistened 1.5″ × 3″ (3.8 cm × 7.6 cm) cellulose sponge (Sponge'n bag # SS-100NB, Hygiena, LLC, Camarillo, CA).
Ten locations throughout the house were selected as sampling sites and included porous and non-porous surfaces and at different heights and at locations where birds and caretaker hands and feet, or air currents were likely to deposit material (Figure S1). Samples inside the pens were: (1) the drinker line, (2) drinker nipples, (3) door frame (various heights), (4) hard plastic power outlet housing (approx. 1.6M from floor), (5) curtain and (6) feeder rim (Figure 1). Sites outside the pens included (7) floor in a central aisle outside the pens, (8) the heater housing (the heater was suspended from the ceiling), (9) end doors of the building (various heights) and (10) doors to storage rooms in the house that were frequently utilized by caretakers.
Samples were collected from flat (including curved flat surfaces like the drinker line) surfaces using a 5 cm × 5 cm plastic template that could be sanitized, to maintain a uniform sample area. A 25 cm2 sample area was approximated on non-flat surfaces. During sampling, collection devices were firmly wiped across the length and breadth of the target area. Pre-moistened gauze was wet with 5 ml brain heart infusion (BHI) medium immediately before sampling (the gauze was damp, but not dripping). The cellulose sponge was supplied by the manufacturer pre-moistened with 10 ml of neutral buffer. After sampling, contents were eluted from the gauze and cellulose sponge by placing them in a sealable plastic bag and manually squeezing the bag for 5 s then wringing the fluid out and into the bag. The corner of the bag was cut-off with sanitized scissors, and the medium was collected in 5 ml sterile tubes. Polyester and foam swabs were used in a dry state. After sampling the target areas, swabs were swirled vigorously in tubes containing 3 ml of BHI medium to release the contents. To maximize material collection, swabs were squeezed against the side of the tube to express as much liquid as possible. Samples were stored at –80°C until they were processed for qRT-PCR.
2.4 Experiment 2: Cement block colony-type housing
The goal of this experiment was to further refine the data on the optimal sample collection target location, area size, and devices (i.e., to compare dry and pre-moistened and cotton gauze). The number of samples, sampling areas and collection time points are shown in Figure 1b. In total, 537 samples were collected throughout the experiment (Tables S3 and S4). The study was conducted during the course of an IBV vaccination-challenge study (Jordan, 2020). Briefly, 100 broiler chickens at 1 day of age were spray-vaccinated with live Mass and GA08-type vaccine strains at a full dose as per the manufacturer's instructions together using a commercial spray applicator. At 14 days post-vaccination (DPV), birds were split into groups of 25 each (4 groups) and were challenged with a DMV/1639-type IBV field strain at a dose of 104 50% egg infectious doses (EID50) per bird by the oculonasal route at 28 DPV.
After challenge, surface samples were collected from all groups at 4, 5, 6, 7, 8, 9 and 10 DPV and 1–6 days post-challenge (DPC). Negative control surface samples were collected prior to vaccination and challenge. Swab samples collected from birds for the parent experiment showed that the birds were positive, at the sample times, with virus quantities within the expected range 5–10 days post-challenge.
Collection devices included (1) foam swabs (#25-1607-1PF, Puritan Medical Products); (2) 4″ × 4″ (10.2 cm × 10.2 cm) cotton gauze pads (#3354, Dynarex Corp.) pre-moistened (but not saturated) with BHI media immediately prior to sample collection and (3) dry 4″ × 4″ cotton gauze pads (#3354, Dynarex Corp.).
Three areas in the colony house (Figure S2) were defined as sampling areas because they were likely to have high levels of virus based on the structure and results from experiment 1: (1) the wall of each unit at bird height (30–40 cm from the floor), (2) the top of the drinker line and (3) the rim of the feeder. Three templates were used to compare sampling area sizes for the walls (painted cement block [non-porous]) (the only flat surface): (1) 25 cm2, (2) 100 cm2 and (3) 225 cm2. Sampling and elution procedures for the pre-moistened gauze and foam swabs were identical to the first experiment. Dry gauze was eluted by placing the gauze in a sealable plastic bag after sampling, then adding 5 ml BHI media. Then the gauze was processed as described for the pre-moistened gauze.
2.5 Sample processing and qRT-PCR
RNA was extracted from samples with the MagMax96 viral RNA isolation kit (Thermo Fisher Scientific, Waltham, MA, USA) and the KingFisher Flex magnetic particle processing System (Thermo Fisher Scientific, Waltham, MA, USA). An additional wash step to remove inhibitors was added to the manufacturer's extraction protocol (Das et al., 2009).
Experiment 1 utilized a primer and probe set that can universally detect IBV, whereas experiment 2 used primer-probe pairs specific for each IBV serotype that could be present (vaccine and challenge virus). The sequences of the primer/probes used in this study are shown in Table S5 (Callison et al., 2006; Meir et al., 2010; Stenzel et al., 2017). QRT-PCR was performed based on IBV qRT-PCR procedures described elsewhere (Callison et al., 2006) for experiment 1. The thermocycling conditions for experiment 2 were as follows: one cycle of 45°C for 10 min and 95°C for 10 min followed by 45 cycles of 95°C for 15 s and 60°C for 60 s on an Applied Biosystems® 7500 Fast Real-Time PCR system (Thermo Fisher Scientific, Waltham, 113 MA, USA).
Cycle threshold (Ct) values were determined by the 7500 Fast Software v2.3 (Applied Biosystems, Foster City, CA, USA) and converted to titre equivalents based on the EID50 titres of the appropriate virus isolate, dilutions of which were run in duplicate and used to produce a standard curve. The detection cut-off value or the limit of detection (LOD) was determined based on the endpoint when the assay did not detect RNA from the serially diluted standard RNA.
2.6 Statistical analysis
The Kruskal–Wallis test and Dunn's multiple comparison tests were used for comparison of viral RNA loads detected in the samples, and chi-square and Fisher's exact test determined the significances in the proportion of positive samples. All samples where viral RNA was not detected were consequently given an imputed titre of 50% of the LOD, which was 0.99log10 EID50/ml for experiment 1 and 0.9log10 EID50/ml for experiment 2, respectively (Cohen, 1959).
3 RESULTS
3.1 Comparison of collection devices
QRT-PCR assay was used to detect the presence of viral RNA recovered by each collection device from both experiments to evaluate sensitivity among sampling devices. Data from all collection time points were compiled for each sampling device. No viral RNA was recovered from samples collected before challenge (data not shown).
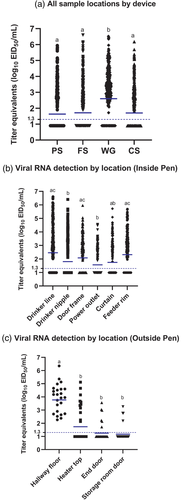
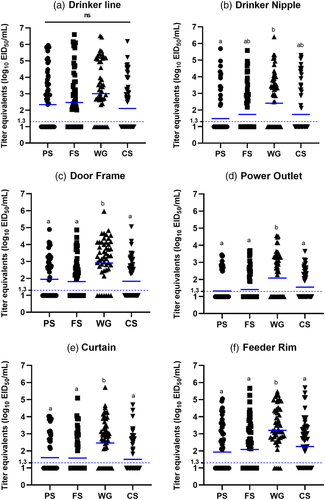
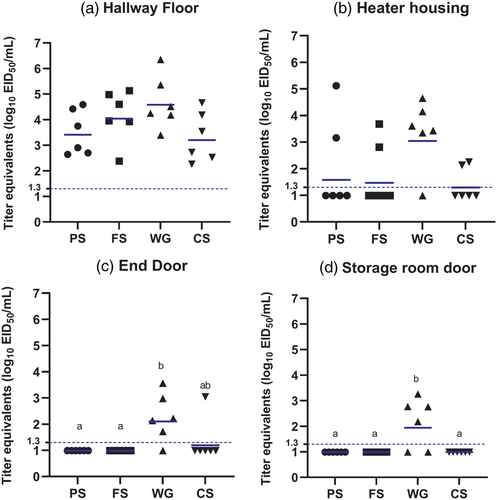
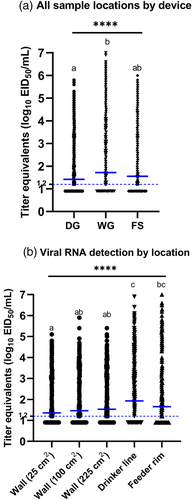
In experiment 1, in the wood framed house, the pre-moistened gauze recovered the most viral RNA (geometric mean titre [GMT]: 2.6 log10 EID50 equivalents per ml) from all sample locations and had the highest positivity rate (78%) compared to foam swabs (52% positive, GMT of 1.8 log10 EID50), cellulose sponges (52% positive, GMT of 1.8 log10 EID50) or polyester swabs (46% positive, GMT of 1.6 log10 EID50) (Table 1, Figure 2a). Pairwise comparisons between collection devices showed that viral RNA recovery by the pre-moistened gauze was significantly higher than other collection devices from most sample locations (Figures 3 and 4 and Tables 2 and S6). The amount of viral RNA recovered by the other collection devices was not significantly different from each other. The pre-moistened gauze also collected significantly more positive samples overall, compared to the other devices (p < .001 vs. each of the other devices). Positivity rates among the other devices (foam swab, polyester swab and cellulose sponge) were not significantly different.
| Collection device | Experiment 1 (wood framed poultry house) | Experiment 2 (cement block colony-type house) | ||
|---|---|---|---|---|
| # pos† | GMT‡ | # pos | GMT | |
| Polyester swab | 143/311 (46) | 1.6 | Not done | Not done |
| Foam swab | 160/311 (52) | 1.8 | 326/657 (50) | 1.6 |
| Pre-moistened gauze | 242/311 (78) | 2.6 | 360/657 (55) | 1.7 |
| Cellulose sponge | 160/311 (52) | 1.8 | Not done | Not done |
| Dry gauze | Not done | Not done | 298/657 (46) | 1.4 |
- † Number of positive samples/# of total samples (per cent positive).
- ‡ GMT = geometric mean titre equivalent of virus recovered in log10 50% egg infectious doses/ml (determined by quantitative real-time RT-PCR.
| Collection device | Drinker line | Drinker nipple | Door frame | Power outlet | Curtain | Feeder rim | Hallway floor | Heater housing | End door | Storage room door | ||||||||||
|---|---|---|---|---|---|---|---|---|---|---|---|---|---|---|---|---|---|---|---|---|
| # pos† | GMT‡ | # pos | GMT | # pos | GMT | # pos | GMT | # pos | GMT | # pos | GMT | # pos | GMT | # pos | GMT | # pos | GMT | # pos | GMT | |
| Polyester swab | 31/48 (65) | 2.3 | 15/48 (320 | 1.5 | 29/48 (61) | 1.9 | 13/48 (27) | 1.3 | 20/48 (42) | 1.6 | 27/48 (57) | 1.9 | 6/6 (100) | 3.4 | 2/6 (34) | 1.6 | 0/6 (0) | <0.9 § | 0/6 (0) | <0.9 |
| Foam swab | 36/48 (75) | 2.5 | 22/48 (46) | 1.7 | 27/48 (57) | 1.8 | 17/48 (36) | 1.4 | 20/48 (42) | 1.6 | 30/48 (63) | 2.1 | 6/6 (100) | 4.0 | 2/6 (34) | 1.5 | 0/6 (0) | <0.9 | 0/6 (0) | <0.9 |
| Moistened gauze | 39/48 (82) | 3.0 | 32/48 (67) | 2.4 | 41/48 (86) | 2.9 | 30/48 (63) | 2.1 | 37/48 (77) | 2.5 | 44/48 (92) | 3.2 | 6/6 (100) | 4.6 | 5/6 (84) | 3.0 | 5/6 (84) | 2.1 | 4/6 (67) | 1.9 |
| Cellulose sponge | 28/48 (59) | 2.1 | 20/48 (42) | 1.7 | 27/48 (57) | 1.8 | 23/48 (48) | 1.5 | 19/48 (40) | 1.5 | 34/48 (71) | 2.3 | 6/6 (100) | 3.2 | 2/6 (34) | 1.3 | 1/6 (17) | 1.2 | 0/6 (0) | <0.9 |
- † Number of positive samples/# of total samples (per cent positive).
- ‡ GMT = geometric mean titre equivalent of virus recovered in log10 50% egg infectious doses/ml (determined by quantitative real-time RT-PCR).
- § All negative samples were given an imputed titre of 50% of the limit of detection which was 0.9 log10 50% egg infectious doses/ml (Cohen, 1959).
| Collection device | Wall 25 cm2 | Wall 100 cm2 | Wall 225 cm2 | Drinker line | Feeder rim | |||||
|---|---|---|---|---|---|---|---|---|---|---|
| # pos† | GMT‡ | # pos | GMT | # pos | GMT | # pos | GMT | # pos | GMT | |
| Dry gauze | 57/141 (41) | 1.3 | 61/141 (44) | 1.4 | 66/141 (47) | 1.4 | 62/117 (53) | 1.6 | 52/117 (45) | 1.4 |
| Pre-moistened gauze | 65/141 (46) | 1.4 | 69/141 (49) | 1.6 | 75/141 (53) | 1.6 | 75/117 (64) | 2.2 | 76/117 (65) | 2.0 |
| Foam swab | 59/141 (42) | 1.3 | 65/141 (46) | 1.4 | 74/141 (52) | 1.6 | 70/117 (60) | 2.0 | 58/117 (50) | 1.5 |
- † Number of positive samples/# of total samples (per cent positive).
- ‡ GMT = geometric mean titre equivalent of virus recovered in log10 50% egg infectious doses/ml (determined by quantitative real-time RT-PCR.
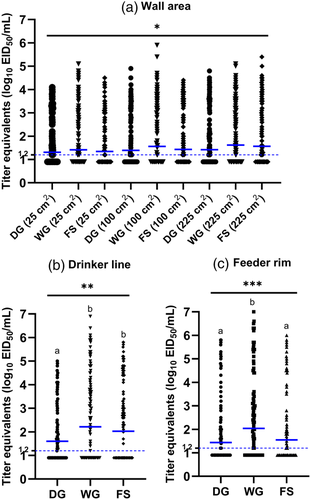
In experiment 2 in the cement block colony houses, the most viral RNA was detected from each of the five sample locations and areas (25, 100, 225 cm2 areas on the wall, drinker line, feeder rim) with pre-moistened gauze. The positivity rate of the pre-moistened gauze was 55% with a GMT of 1.7 log10 EID50, compared to foam swab (50% positive, GMT of 1.6 log10 EID50) and dry gauze (45% positive, GMT of 1.4 log10 EID50). The proportion of positive samples was significantly higher in the pre-moistened gauze group compared to the dry gauze (p = .0008). The proportion of positive samples was non-significant between other collection devices (dry gauze and foam swab, or pre-moistened gauze and foam swab). Similar to experiment 1, a direct pairwise comparison of viral recovery between collection devices at individual locations revealed that the pre-moistened gauze recovered significantly more viral RNA from the feeder rim than from other locations (Figure 5, Tables 3 and S7).
3.2 Comparison of viral RNA loads between sample locations
To identify the locations where virus is most likely to be detected in poultry houses, viral RNA loads recovered from various locations in both experiments were compared. In experiment 1, the highest viral RNA loads were recovered from the top of drinker line (70% positive, GMT of 2.5 log10 EID50) inside the pen, followed by feeder rim (70% positive, GMT of 2.3 log10 EID50), door frame (65% positive, GMT of 2.1 log10 EID50), drinker nipple (47% positive, GMT of 1.8 log10 EID50), curtain (50% positive, GMT of 1.8 log10 EID50) and power outlet (40% positive, GMT of 1.6 log10 EID50) (Figure 2b). Virus RNA recovery from the drinker line and feeder rim was significantly higher than other locations. The proportion of samples that were positive in each location inside the pen was significantly higher on top of the drinker line (vs. drinker nipple, power outlet, curtain: p < .0001), doorframe (vs. drinker nipple, power outlet, curtain: p < .0001) and feeder rim (vs. drinker nipple, power outlet: p < .0001; vs. curtain: p = .0003). The proportion of samples that were positive from other locations was not significant. For areas outside the pen, the viral RNA load recovered from the hallway floor (75% positive, 3.8 log10 EID50/ml) was significantly higher than the heater housing (35% positive, 1.6 log10 EID50/ml), end door (20% positive, 1.2 log10 EID50/ml) and storage room door (13% positive, 1.1 log10 EID50/ml) (Figure 2c). The proportion of positive samples was significantly higher from the floor compared to other areas (vs. heater: p = .0006, vs. end door, storage room door: p < .0001). Besides the floor, there was only one location where the proportion of positive samples was significantly different between sample areas; significantly more samples collected from the heater housing were positive (p = .0339) than the samples collected from the storage door.
In experiment 2, the highest loads of viral RNA were detected from the top of the drinker line (59% positive, 1.9 log10 EID50/ml), followed by feeder rim (53% positive, 1.7 log10 EID50/ml) and walls (25 cm2: 43% positive, 1.4 log10 EID50/ml, 100 cm2: 46% positive, 1.5 log10 EID50/ml, 225 cm2: 51% positive, 1.6 log10 EID50/ml). Like experiment 1, viral RNA recovery was high on the drinker line and feeder rim. Several significant differences in the proportion of positive samples between sample locations were observed (Figure 5b). Significantly more positive samples were collected from the drinker line (vs. wall 25 cm2: p < .0001, vs. wall 100 cm2: p = .0004, vs. wall 225 cm2: p = .0247) followed by feeder rim (vs. wall 25 cm2: p = .0049) and wall 225 cm2 (vs. wall 25 cm2: p = .0229). The results of other comparisons were not significantly different.
4 DISCUSSION
In order to achieve the highest sensitivity, the primary objective of this study was to evaluate and provide a framework for cost-effective environmental sampling methods using different collection devices. Various sample locations were tested to compare the locations for sample deposition and recovery by each samples collection device from different surfaces. It's not possible to replicate all possible types of poultry housing, layouts and equipment that can be found at different farms worldwide, but numerous surface types can provide data that could be applied to different settings. IBV was used as a model virus for enveloped poultry respiratory viruses, which could also simulate the environments of poultry infected with other viral respiratory diseases (e.g., avian influenza, Newcastle disease, infectious laryngotracheitis). Sampling devices and methods can affect the yield of virus recovery (Julian et al., 2011); therefore, several collection devices that have been identified as appropriate for environmental sampling were evaluated. Previously described approaches were utilized where the proportion of positive samples (Butz et al., 1993), and the quantity of viral genes detected by real-time polymerase chain reaction (PCR) (Mukherjee et al., 2012; Prieto et al., 2014) was compared between methods.
Optimally sample collection devices should be widely available and inexpensive. Polyester swabs are already used for some disease surveillance and cotton gauze is available at many stores. In a pilot study boot swabs commonly used for Salmonella testing were tested, but performed poorly for this application (data not published). Flocked swabs used for some disease surveillance had too small a surface area and the shaft was too flexible for surface sampling. The foam and sponge sticks, although less widely used for poultry are designed for environmental testing.
The geometric mean titres of recovered viral RNA varied among devices and sampling sites. Similar to a previous study with wire cages (Mo et al., 2021), the pre-moistened gauze was the most efficient in recovering viral RNA which resulted in the highest proportion of samples that were positive for virus detection among all sampling sites (Figures 2-6). The high sensitivity of pre-moistened gauze is likely due to enhanced transfer with a wet surface and the large surface area. Previous studies on environmental sampling for viruses suggested that wet devices transferred the virus from environmental surfaces more efficiently than dry devices (Ansari et al., 1988; D'Souza et al., 2006; Gibson et al., 2012). Greater surface area allows for more material to be collected and can release it efficiently into the medium.
The composition of the material on the sample device that contacts the surface is also important. Studies have reported that cotton swabs have lower yields compared to foam and polyester swabs due to their insufficient capacity to release collected contents, including viral RNA (Bruijns et al., 2018; Jansson et al., 2020), which contrasts with our studies where pre-moistened cotton gauze was more sensitive. The difference may be that swabs, in general, tend to have a compact structure based on tightly bound fibres and they have a small contact area (Brownlow et al., 2012). Gauze is loosely woven so it can bind and release small particles more easily and when the gauze is not saturated, it exhibits capillary action. The effects of the material could also be why the cellulose sponge yielded significantly lower viral RNA loads compared to the cotton gauze despite being pre-moistened. The size exclusion properties of cellulose fibres could have prevented the virus from readily releasing (Junter & Lebrun, 2017) (Figure 2a).
The release capacity of collection devices also depends on the elution method itself. The hand-wringing method used for gauze may have been more efficient in releasing material than the post-collection dipping and stirring method meant for swabs because of the greater force that can be applied to the device.
When comparing viral RNA loads detected at each sampling location, higher recovery was observed on drinker lines, feeder rims and the hallway floor, which indicates that these sites were likely the main sites where airborne virus droplets settle (Morawska, 2006). Moreover, as birds tend to congregate at the feeders and drinkers virus would likely be concentrated at these locations. Oropharyngeal and cloacal shedding by birds infected with respiratory viruses is not uncommon (Miller et al., 2007; Okamatsu et al., 2007; Slemons & Swayne, 1990; Spackman et al., 2016; Swayne et al., 1997). Therefore, manure and oral secretions can serve as a source of virus which would help virus spread on the floor by bird and human feet. Other studies found that the floor and feeders could be major sites where virus contamination is present in infected poultry premises (Azeem et al., 2021; Lopez et al., 2018).
Because surface area can affect sensitivity and counter-intuitively in some conditions larger sample areas have been shown to reduce sensitivity (Tufts et al., 2014), the area of sampling was evaluated. This occurs if larger areas cause saturation of the sampling device, so material is deposited back onto the surface, or if the greater surface area increases the level of inhibitors in the sample. In this study, samples collected from the walls of cement block colony-type houses displayed a proportional increase in viral RNA loads based on sample area size. Therefore, in this system, a larger area did improve virus detection.
This study demonstrated that depending on the type of collection device and sampling site, virus recovery can differ significantly. Thus, when establishing sampling protocols use of the optimal collection devices, pre-moistened cotton gauze, with highly contaminated sampling locations (drinkers, feeders, floor) where the virus would likely settle and accumulate would optimize test accuracy. Sites where high loads of virus are deposited should also be targeted for cleaning and disinfection. Air sampling was conducted during the second experiment as a proof-of-concept and to help develop the method by documenting whether airborne virus could be detected; viral RNA was detected in 54% (68/126) samples collected.
The limitations of this study were that the collection methodologies here only focused on detecting viral RNA loads, in which the infectivity of viable viruses in the environment could not be evaluated. However, in most cases, sampling during outbreak recovery does not need to determine if virus is viable. If viability testing is needed, the material could be utilized for virus isolation and RNA recovery should approximate virus recovery. In addition, farm environments are very diverse and low virulence viruses were utilized as reference agents, so every real-world condition could not be evaluated.
Environmental testing after cleaning a farm post-outbreak or a mandated fallowing period in which the premises must be empty of birds is important to verify virus-free status and to minimize the economic impact of an outbreak on growers to restore business continuity. Thus, developing reliable testing methodologies that are practical and have broad application in different types of premises is crucial. Testing during outbreaks and in field studies can supply further data to refine methods. However, these data do provide guidelines for environmental sampling of poultry farms for respiratory viruses.
ACKNOWLEDGEMENTS
We gratefully acknowledge Scott Lee, Jesse Gallagher and Deborah Hilt for technical assistance with this work. This research was supported by USDA-ARS project 6040-32000-066-00D and USDA-APHIS Agreement #60-6040-6-005. This research was supported in part by an appointment to the Agricultural Research Service (ARS) Research Participation Program administered by the Oak Ridge Institute for Science and Education (ORISE) through an interagency agreement between the US Department of Energy (DOE) and the US Department of Agriculture (USDA). ORISE is managed by ORAU under DOE contract number DE-SC0014664.
Mention of trade names or commercial products does not imply recommendation or endorsement by the USDA. All opinions expressed in this paper are the author's and do not necessarily reflect the policies and views of USDA, ARS, DOE or ORAU/ORISE. The USDA is an equal opportunity provider and employer.
CONFLICT OF INTEREST
The authors declare that they have no conflict of interest to declare.
ETHICS STATEMENT
The authors confirm that the ethical policies of the journal, as noted on the journal's author guidelines page, have been adhered to and the appropriate ethical review committee approval has been received. All research involving animals was reviewed and approved by the Institutional Animal Care and Use Committee of the University of Georgia and the Federation of Animal Science Societies ‘Guide for the Care and Use of Agricultural Animals in Research and Teaching’ was adhered to.
Open Research
DATA AVAILABILITY STATEMENT
Data are available upon reasonable request to the corresponding author.


