Introduction of broadleaf tree species can promote the resource use efficiency and gross primary productivity of pure forests
Abstract
Long-term pure forest (PF) management and successive planting has result resulted in “low-efficiency artificial forests” in large areas. However, controversy persists over the promoting effect of introduction of broadleaf tree species on production efficiency of PF. This study hypothesised that introduced broadleaf tree species can significantly promote both water-nutrient use efficiency and gross primary productivity (GPP)of PF. Tree ring chronologies, water source, water use efficiency and GPP were analysed in coniferous Cunninghamia lanceolata and broadleaved Phoebe zhennan growing over the past three decades. The introduction of P. zhennan into C. lanceolata plantations resulted in inter-specific competition for water, probably because of the similarity of the main water source of these two tree species. However, C. lanceolata absorbed more water with a higher nutrient level from the 40–60-cm soil layer in mixed forests (MF). Although the co-existing tree species limited the basal area increment and growth rates of C. lanceolata in MF plots, the acquisition of dissolved nutrients from the fertile topsoil layer were enhanced; this increased the water use efficiency and GPP of MF plots. To achieve better ecological benefits and GPP, MFs should be constructed in southern China.
1 INTRODUCTION
Artificial forests play an irreplaceable role in the supply of forest products and the construction of the ecological environment (Illuminati et al., 2022). Although artificial forests only account for 3%–5% of the global total forest area, they provide over 50% of the wood and most of the forest products (McCormick et al., 2021). Pure forests (PFs), which contain only one tree species, are widely distributed owing to their fast growth and simple afforestation techniques (Chen et al., 2020). Although PFs grow faster than mixed forests (MFs), their ecological function and system stability are generally low (Barbeta et al., 2022). In addition, PFs are associated with soil acidification, low biodiversity and low gross primary productivity (GPP), resulting in the phenomenon of “low-efficiency artificial forests” (Kulmatiski et al., 2020). Most countries and regions have therefore introduced broad-leaved tree species and undergrowth into PFs, thus alleviating the problem of low-efficiency artificial forests (Tetzlaff et al., 2021). Such an approach can alleviate issues such as low nutrient levels, soil acidification and low biodiversity (Matos et al., 2021). In addition, the formation of MFs improves microclimate conditions, reduces soil evaporation and increases precipitation infiltration (Mathias & Thomas, 2021). MFs with high water conservation functions can not only reduce evapotranspiration, but also capture more light energy for carbon sequestration; this promotes water use efficiency (WUE), supporting “high-yield and high-efficiency forests” (Huang et al., 2022). However, the introduction of broad-leaved tree species to PFs can trigger new ecological issues (Blumenthal et al., 2020; Liancourt et al., 2015; Májeková et al., 2021). For example, such an introduction can alter forest hydrological processes and microclimatic conditions, thus exacerbating competition for water and nutrients (Xu et al., 2020). According to Carrière et al. (2020), most PFs with well-developed root systems mainly take up water from deeper soil layers. If the introduced broad-leaved tree species have a high-water demand, they may also mostly absorb water from deep and stable water sources (Chen et al., 2020). The introduction of broad-leaved tree species in PFs may result in considerable competition for the same water source. Especially in areas with seasonal drought or low precipitation levels, this approach may result in more pronounced competition.
Nevertheless, a number of studies have reported that although certain specific tree species have deep root systems, they may adopt complementary water uptake strategies because of the dimorphic structural characteristics of their roots (Behzad et al., 2023; Liu et al., 2023; Wu et al., 2021). Tree species with such dimorphic structural characteristics can adjust their main water source based on both soil water content (SWC) conditions and seasonal variation. In these tree species, SWC can not only affect the transpiration rate of trees, but also influence carbon assimilation absorption through stomatal regulation, thus also affecting WUE (Ding et al., 2021; Hahm et al., 2022). Trees absorbing deep soil water may have a continuous water supply, promoting transpiration and resulting in low WUE (Oogathoo et al., 2020). In contrast, trees that absorb shallow soil water may reduce their stomatal opening to prevent water loss and thus promote WUE because of the low moisture content in shallow soil layers (Zhang et al., 2022). According to Jia et al. (2022), trees exhibit hydraulic redistribution (HR), thus regulating the water distribution in soil. In certain cases, deep-rooted trees take up water from deep soil layers and release it into shallow layers via HR, which is then absorbed by accompanying tree species (Liu et al., 2022). In this context, the selection of tree species may not exacerbate the conflict between water absorption by regional trees and soil water supply; therefore, the selection of suitable tree species is crucial for reducing water competition and optimising tree water use patterns.
Cunninghamia lanceolata—the largest timber tree species planted in artificial forests in southern China—is characterised by its rapid growth, high yield and good timber quality; it also plays a crucial role in forest plantations (Qiu et al., 2013). Soil fertility decline, reduction of GPP and impeded ecological functions seriously impact the sustainable management of C. lanceolata plantations because of successive planting and long-term PF management (Wang et al., 2022). As a potential solution, the introduction of the broad-leaved tree species Phoebe zhennan in C. lanceolata plantations has been suggested; however, the effects of such an approach have been largely unclear. Thus, whether the introduction of P. zhennan can promote the utilisation efficiency of water-nutrient resources in artificial forests and increase GPP needs to be determined. The present study focused on comparing the utilisation of water, nutrients and growth status between PFs (C. lanceolata) andMFs (C. lanceolata and P. zhennan). As the introduction of broad-leaved tree species is considered a good measure and commonly used to transform artificial PFs in the study area of central Jiangxi Province, China, to create MFs, this study posited that MFs can significantly promote water-nutrient utilisation efficiency as well as growth capacity. To test this hypothesis, the following aspects were explored: (1) the effect of introducing broad-leaved tree species on the main water source, nutrient utilisation and WUE of PFs; (2) the mechanism underlying the promotion of stem growth and GPP by the introduction of broad-leaved tree species. The obtained understanding can contribute to the transformation of inefficient artificial forests and achieve sustainable forest management.
2 MATERIALS AND METHODS
2.1 Study area
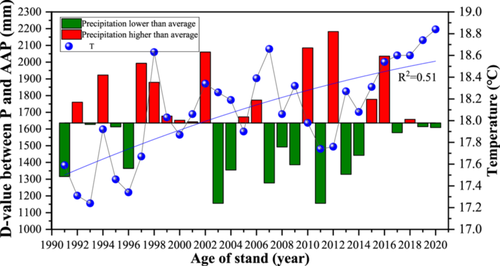
This study focused on the Guanshan Forest Farm, Yongfeng County, Jiangxi Province, China (115°17′–115°56′ E, 26°38′–27°32′ N). The climate is humid subtropical, with an average annual temperature of 18℃ (Figure 1). The average annual precipitation (AAP) and frost-free period are 1627.3 mm and 279 days, respectively. The highest level was observed in 2012, at 2182.67 mm, which was 33.3% higher than the AAP; the lowest value was observed in 2011, at 1155.54 mm, which was 29.3% lower than the AAP. The difference between the maximum and the minimum precipitation was 1027.13 mm.
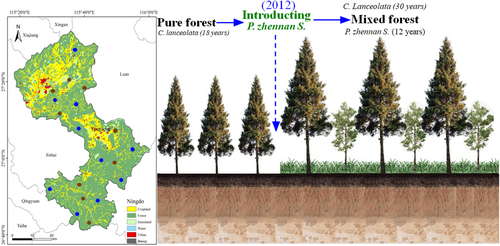
The study area is a hilly and mountainous area with a mean elevation of 43.5 m. The study area is dominated by C. lanceolata plantations established in 1991, to which broad-leaved tree species (4-year-old P. zhennan) were introduced in 2012 (Figure 2). At the time of this study, C. lanceolata and P. zhennan trees were thus 30 and 12 years old, respectively. The main soil type is red soil. Based on the current situation and different technical measures of the transformation of inefficient C. lanceolata in the study area, 19 sampling plots (20 m × 20 m) with same-age C. lanceolata, introduction of P. zhennan in the same year, similar site conditions and similar tree growth conditions were selected from a variety of plots. Thus, there were nine PF sampling plots and 10 MF sampling plots in the study area.
2.2 Sampling
2.2.1 Tree ring sampling and measurements
Tree rings and branches were sampled every 2 months from May to October in 2022 to measure isotopic compositions. Nine trees with good growth, uniform height and similar diameter at breast height were selected in each plot. Tree cores were collected randomly in two directions at the point of measuring the diameter at breast height of the tree using a growth cone with an inner diameter of 5.15 mm. The collected cores were placed on straw and transported to the laboratory. After drying the cores in an oven at 80℃ for 48 h, white emulsion adhesive was used to fix the dried sample core onto a wooden trough, followed by polishing of the sample until it could be dated. Then, a LinTab6 tree ring analyser (Rinntech) with an accuracy of 0.01 mm was employed to measure the width of the polished tree-ring samples.
Here rt2 and rt1 represent the radius at the end and the beginning of the annual tree-ring formation, respectively.
2.2.2 Branch sample collection
Three samples of C. lanceolata and P. zhennan with good growth were randomly selected from each plot. Mature branches with a length of 3–5 cm and a diameter of 0.3–0.5 cm were collected, and the epidermis and phloem were removed, retaining only the xylem. Three such samples were collected from each tree and placed into a 50-mL plastic centrifuge tube. After sealing the samples with Parafilm® and storing them at 4℃, the hydrogen and oxygen isotopes of the branch water were determined.
2.2.3 Soil and root sample collection
According to the frequency and time of branch sample collection, soil samples were collected by a soil auger with a diameter of 38 mm (Hongguang). Soil samples were collected at depths of 0–10, 10–20, 20–40, 40–60, 60–80 and 80–100 cm near selected plants in each plot, with three replicates per layer. The soil samples were placed in 50-mL plastic centrifuge tubes, sealed with Parafilm®, and kept at 4℃ before the determination of the hydrogen and oxygen isotopes of the soil water.
The roots were collected by the quarter direct excavation method. Soil blocks were collected from vertical depths of 0–20, 20–40, 40–60, 60–80 and 80–100 cm and from horizontal distances of 0–25, 25–50 and 50–75 cm from tree trunks. The collected soil blocks were sifted through 100-mesh screens. Tree roots were washed and then categorised according to their diameter (L) as follows: 0 < L ≤ 1.0, 1.0 < L ≤ 2.0, 2.0 < L ≤ 3.0, 3.0 < L ≤ 4.0 and L > 4.0. A root system analysis programme (WinRHIZO–EC; Regent Instruments) was used to scan the length of the root system. The screened soil samples were divided into two parts; one part was used to measure SWC, while the other part was used to determine the soil nutrient content (nitrogen, phosphorus and potassium).
2.3 Analysis and determination of stable isotopes
2.3.1 Stable carbon isotope determination
Here Rsample and Rstandard are the 13C/12C values of the sample and the standard, respectively.
2.3.2 Analysis of water sources
Low-temperature vacuum extraction was performed to extract water from branch and soil samples. The extracted water was filtered through a 0.22-μm microporous organic filter to prevent possible impurities in the sample from affecting the determination of the hydrogen and oxygen isotopes in the water sample. Subsequently, the pretreated water sample was injected into a 2-mL bottle and a stable isotope mass spectrometer (DELTA–plus–XP; Thermo Fisher Scientific Inc.) was used to determine the stable hydrogen and oxygen isotope ratio of the sample. The measurement accuracies for δ2H and δ18O were 0.3‰ and 0.1‰, respectively.
Here fSn represents the proportion of water resources absorbed by plants, XSn represents the 2H/18O values of different water sources (0–20, 20–40, 40–60, 60–80 and 80–100 cm), and XS represents the 2H/18O value of the water in the branches of plants.
2.3.3 Calculation of iWUE and GPP
Here δ13C and δ13Ca are the stable isotope values of tree ring cellulose carbon and atmospheric CO2, respectively; Δ is the δ13C discriminant value; Ci is the intercellular concentration of CO2 in leaves (μmol·mol−1); Ca is the background value of atmospheric CO2 concentration in the study area (μmol·mol−1); a and b are the fractionation coefficients in each photosynthesis process, which are 4.4‰ and 27‰, respectively; Gs is the stomatal conductance of leaf water vapour (mol·m−2·s−1); A is the amount of carbon sequestration (g).
The GPP from 2002 to 2022 was obtained from MOD17A2H Version 6 (https://earthexplorer.usgs.gov) at a spatial resolution of 500 m and a temporal resolution of 8 days. The GPP values of PF and MF plots were extracted based on the coordinates of plots in the obtained GPP spatial distribution maps for 2002, 2012 and 2022.
2.4 Data collection and analysis
All statistical analyses were performed using SPSS 16.0 (SPSS Inc.). Descriptive statistics were used to calculate the means and standard deviations for each set of replicates. First, two-way analysis of variance (ANOVA) was performed to determine the differences in the water source, SWC, C, and K, with tree species composition and soil depth as independent factors. Two-way ANOVA was performed to test the effect of tree species composition and the sampling time on δ13C, ring width and WUE. Subsequently, three-way ANOVA was performed to analyse the differences in roots, using diameter, species and soil depth as independent factors. Regression analyses and t-tests were performed to identify any potential relationships between ring and WUE, T and δ13C. The R2 and P-values were also estimated. All data were tested for the assumptions of normality and homogeneity of variance and were found to meet the requirements of variance analysis.
3 RESULTS
3.1 Variation in soil nutrient and water levels
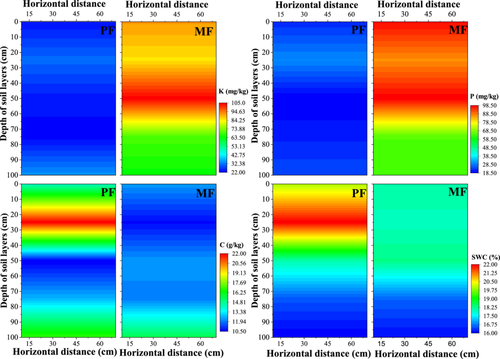
Significant differences were found in the nutrient level and SWC between PF and MF plots, but no significant differences in soil nutrient and water content with horizontal distance (Figure 3). In MF plots, the K and P levels were 83.10 and 82.26 mg/kg, respectively, which are 3.0 and 3.5 times higher than those in PF plots (27.53 and 23.51 mg/kg, respectively). The C and SWC values in PF plots were 17.41 g/kg and 18.57%, respectively, which are 27.7% and 6.2% higher than those in MF plots (12.57 g/kg and 17.41%, respectively). The K and P levels were higher in MF plots in the 40–60-cm soil layer, with values of 104.42 and 98.21 mg/kg, respectively. In the 0–20-cm soil layer of MF plots, values were 91.55 and 98.21 mg/kg, respectively, which decreased with increasing soil depth. In PF plots, K and P values were the highest at 20–40 cm and then decreased with soil depth. The C values of MF plots gradually increased with increasing soil depth, whereas the C value of PF plots was the highest at soil depths of 0–20 and 80–100 cm. Irrespective of the site type, the SCW value decreased with increasing soil depth.
3.2 Distribution of the isotopic values of different water sources
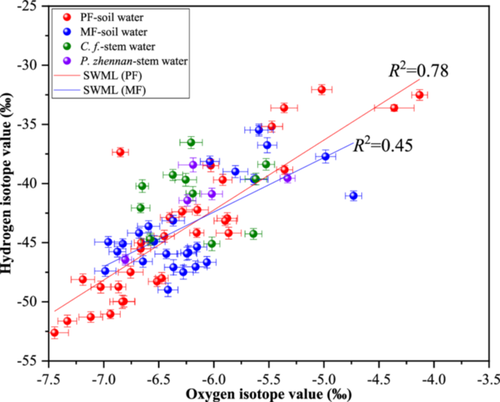
The stable isotopes in different water sources showed different characteristics (Figure 4). The δ2H and δ18O values of the soil water in MF plots ranged from −48.98‰ to −36.75‰ and −6.98‰ to −4.73‰, respectively; these were higher than those of the soil water in PF plots (−7.44‰ to −4.13‰ for δ18O and −52.61‰ to −32.06‰ for δ2H). The soil water characteristic line also indicated that the isotope values of soil water in MF plots were more pronounced than those in PF plots. The variation of δ2H and δ18O values of branches was small, ranging from −52.61‰ to −32.06‰ and −7.44‰ to −4.13‰, respectively. The isotope values of the branches of P. zhennan were greater than those of C. lanceolata.
3.3 Water sources in pure and mixed forests
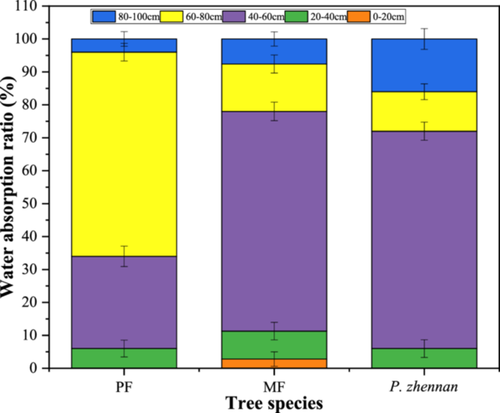
A significant difference was found in the water sources between PF and MF plots; the water use proportion first increased and then decreased with soil depth, irrespective of site type (Figure 5). C. lanceolata in PF plots tended to absorb water from soil depths of 40–60 cm and 60–80 cm, with absorption ratios of 28.0% and 58.0%, respectively. In MF plots, these absorption ratios gradually increased up to a depth of 40–60 cm and decreased at a depth of 60–80 cm. In MF plots, P. zhennan used the same water source as C. lanceolata, mainly absorbing water from a depth of 40–60 cm. Thus, under low water conditions, the two species appear to compete for water.
3.4 Gross primary productivity and water use efficiency of pure and mixed forests
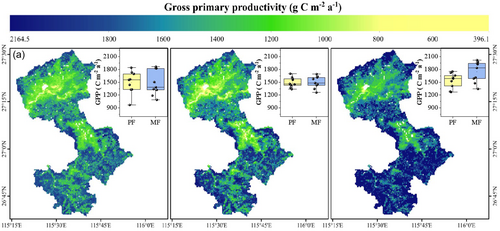
The average GPP of PF and MF plots in 2022 were 1535.0 and 1744.8 C m−2a−1 (Figure 6), respectively, 2.64% and 17.79% higher than in 2002 (1482.1 C m−2a−1). The average GPP of MF plots was 13.7% higher than that of PF plots. Thus, the introduction of P. zhennan significantly promoted the GPP of forests.
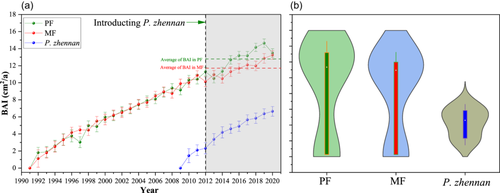
The ring widths and BAI of C. lanceolata and P. zhennan in PF and MF plots differed significantly and decreased with increasing forest age (Figures 7 and 8). The annual ring width of P. zhennan was 0.32 cm, which was 12.5% higher than that of C. lanceolata, at 0.28 cm, indicating that P. zhennan had a higher growth rate. The total annual ring width and BAI of C. lanceolata in PF plots were 8.71 cm and 238.03 cm2, which were 1.7% and 3.6% higher than that in MF plots (8.56 cm and 229.64 cm2). In particular, after introducing P. zhennan, C. lanceolata showed a significantly higher annual ring growth rate in PF plots than in MF plots (p < 0.05), indicating that C. lanceolata had a higher growth rate in PF plots than in MF plots.

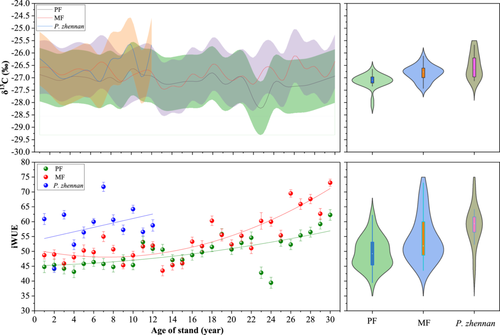
The δ13C and WUE values of C. lanceolata and P. zhennan in PF and MF plots differed significantly, and increased with stand age (Figure 9). The δ13C and WUE values of P. zhennan were −26.50‰ and 61.5%, respectively, which were 17.7‰ and 15.8% higher than those of C. lanceolata, at −26.97% and 51.8%, respectively. The WUE of C. lanceolata in MF plots was 54.1%, which was 9.2% higher than that of PF plots, at 49.5%. At a stand age of 18 years, the WUE of C. lanceolata in MF plots was higher than that in PF plots.
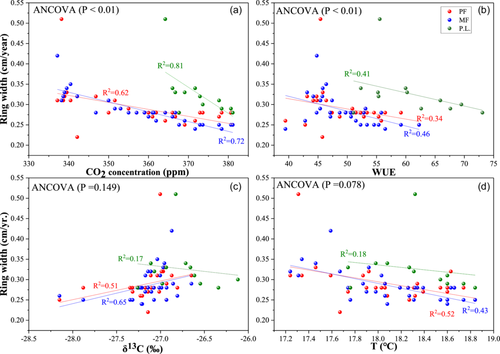
In C. lanceolata, ring width was negatively correlated with CO2 concentration, temperature and WUE (p < 0.01) and positively correlated with δ13C (Figure 10). In P. zhennan, ring width was negatively correlated with CO2 concentration, WUE and δ13C. The negative relationship between CO2 concentration and ring width was more pronounced than those of temperature, WUE and δ13C with ring width. In contrast, the negative relationship of CO2 concentration with ring width in P. zhennan was more pronounced than that in C. lanceolata.
3.5 Root distribution characteristics
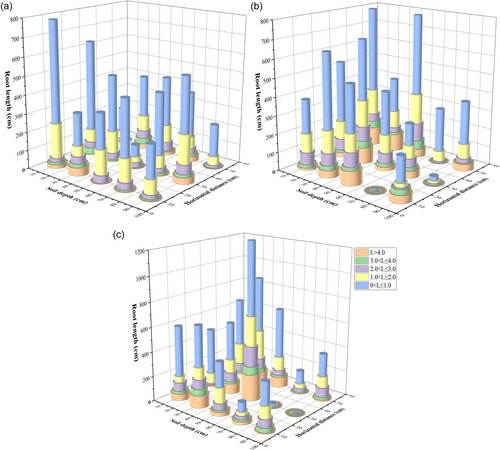
The length of the fine roots of C. lanceolata was significantly greater than that of its coarse roots (p < 0.05). The total root length (TRL) of the finest root class (0 < L ≤ 1.0) of PF plots was almost 20 times that of the coarsest root class (L > 4.0). The root length of C. lanceolata differed significantly between PF and MF plots (p < 0.05). In MF plots, root length was significantly greater than in PF plots, at 0–60 cm, with the exception of roots at the 0–10 cm depth (p < 0.05). The root lengths in PF plots were significantly longer than in MF plots, at 60–100 cm (p < 0.05). The TRL of P. zhennan was 7259.46 cm and 16.40% and 11.65% higher than that of C. lanceolata in PF plots, at 6068.55 cm and in MF plots, at 6413.69 cm. The TRL of the finest root class (0 < L ≤ 1.0) of P. zhennan was 3996.02 cm, which was almost 6 times that of its coarsest root class (L > 4.0). In addition, the TRL of the finest root class of P. zhennan at a depth of 0–60 cm was 1147.91 cm, which was significantly higher than that of coarser roots and other layers.
4 DISCUSSION
4.1 Introduction of broad-leaved tree species induced C. lanceolata to uptake more shallow water
The output of the MixSIAR model indicated that both tree species exhibited strong plasticity regarding the uptake of water from different soil layers. Although SWC in the surface layer of PF plots was higher than that of the deep soil layer, the trees absorbed water from the 60–80-cm soil layer, indicating that water uptake of C. lanceolata was not sensitive to soil water. This phenomenon has also been reported by Ding et al. (2021), who noted that several co-occurring woody species prefer to take water from deep and stable water sources, regardless of water conditions. Shallow soil water sources are probably easily affected by the dual effects of rainfall and evaporation, whereas deeper soil water sources are more stable.
Under the climatic conditions observed in this study, that is, a mean annual precipitation accumulation of 1627.3 mm and seasonal droughts occurring from time to time, the survival of PFs will be threatened if C. lanceolata is over-dependent on water uptake from the 0–40 cm soil layer in PF plots. Temperature and drought stress further result in the dormancy of the 0–40-cm root system or the dehydration and death of fine roots, thus stimulating root growth at a depth of 60–80 cm for water uptake (Granda et al., 2022). Accordingly, C. lanceolata may take up more soil water from the 40–60-cm layer in MF plots because of its deep tap roots. According to Liu et al. (2023), the uptake of shallow soil water consumes less energy than the uptake of deep soil water. The absorption of water from a depth of 40–60 cm by L. lanceolata in MF plots may be attributed to the fact that shallower soil water is more easily available and requires less energy to extract. This enhances water stress tolerance under natural conditions and serves as an invaluable strategy that allows plants to co-exist.
This water use pattern may not only be attributed to the SWC, but also to the root distribution and nutrient levels (Zadworny et al., 2021). Hartmann et al. (2021) found that plants maximise their water exploitation by altering their water sources based on their root characteristics. The root system of C. lanceolata in PF plots was mainly distributed at a depth of 60–80 cm, whereas in MF plots, it mostly occurred in the 40–60-cm layer (Figure 11). A dense root system provides favourable conditions for obtaining soil water at a depth of 40–60 cm. Specifically, a deep-rooted plant may change the morphology of its shallow fine roots, thus making it more drought resistant (Jiang et al., 2022). The P and K levels in the shallow soil layers of MF plots were higher than those of PF plots, indicating that shallow water contains more nutrients. This phenomenon of exploiting different water sources is prevalent among coexisting plant species (Maurel & Nacry, 2020).
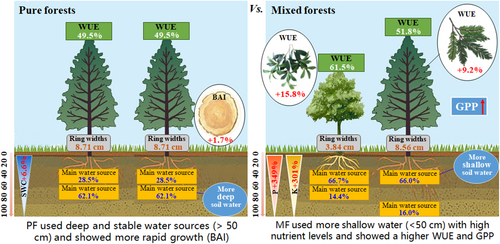
Notably, the water use pattern of P. zhennan in MF plots was similar to that of C. lanceolata, suggesting a significant niche overlap between these two tree species in terms of nutrient acquisition. This finding is similar to the results reported elsewhere (Chitra-Tarak et al., 2021), as co-existing tree species with the same or similar requirements for the same resource are prone to competition. In the southern tropical region of China, L. lanceolata is not limited by water availability but rather by nutrient levels and its root system. The water use differences of C. lanceolata between PF and MF plots may also be a strategy to obtain more nutrients (Figure 12). In nutrient-poor soils, nutrient competition between C. lanceolata and P. zhennan may be enhanced in MF plots. Soil and water loss caused by frequent extreme precipitation events in the future would exacerbate nutrient loss, thus further intensifying competition for nutrients.
4.2 Mechanism underlying the introduction of broad-leaved tree species to promote production efficiency
The ring widths in MF plots were lower than those in PF plots after introducing P. zhennan to C. lanceolata plantations (Figure 7). Ring width may be strongly influenced by increased competition among trees because of niche overlap in MF plots. Liu et al. (2021) noted that as competition increases among trees, ring width decreases. The findings of this study suggest that the water use patterns (Figure 5) and root systems of the two tree species were similar (Figure 11), which may have intensified competition for nutrients. In addition, the density of PF plots was low, which would have promoted the growth of C. lanceolata. In contrast, in MF plots, water and nutrient resources were not fully allocated to C. lanceolata because of the higher stand density, which resulted in narrowed ring widths. This supports the findings of previous studies in subtropical regions (e.g., Gao et al., 2022; Huang et al., 2023), in which PFs grew faster than MFs. Although MFs restricted the growth of C. lanceolata, the GPP of MFs was still higher than that of PFs (Figure 6). This is because there were more trees per unit of area in MF plots and the resources were fully allocated. Thus, introduction of P. zhennan can indeed promote GPP.
The WUE of C. lanceolata of MF plots was significantly higher than that of PF plots, most likely because of specific temperature and humidity conditions. WUE exhibits a bell-shaped distribution with temperature, that is, WUE is highest when a tree is at its most suitable temperature for its growth. Nevertheless, WUE decreases when forests exceed the optimal temperature (Belmecheri et al., 2021; Mathias & Thomas, 2021). In another study, the temperature of PF plots was 0.4–2.2℃ higher than that of MF plots (Guo et al., 2020). Possibly, the temperature in MF was closer to the optimal growth temperature for forest trees; however, the temperature in PF plots exceeded the optimal growth temperature in the subtropical region (Christiansen et al., 2022). Except for species-specific physiology between C. lanceolata and P. zhennan, P. zhennan is a hygroscopic and shade-tolerant tree species (Luca et al., 2021). In the present study, in MF plots, C. lanceolata (a tall tree species) created moist and shaded growth conditions for young P. zhennan trees below the canopy. Consequently, P. zhennan maintain high WUE in MF.
This study provides evidence that the WUE of both MF and PF plots increases in the study area over time because the increase in atmospheric CO2 concentration promotes carbon assimilation. This result is in agreement with the findings of a previous study (Morino et al., 2021). Notably, the WUE of MF plots continually increased, and the interannual variation of the WUE of PF is significant (Figure 12). This result also indicates that MFs are less susceptible to atmospheric influences than PFs. The emission of CO2 into the atmosphere also increases with human activities (Adams et al., 2021). In the context of a changing climate, MFs can better adapt to altered environmental conditions.
5 CONCLUSION
Both tree species exhibited strong plasticity in terms of water uptake from different soil layers. In PF plots, C. lanceolata used more stable water sources from a depth of 60–80 cm, whereas in MF plots, it took up water from the 40–60-cm soil layer. The water use pattern of P. zhennan in MF plots was similar to that of C. lanceolata. Although the BAI and growth rate of C. lanceolata in MF plots were lower than that of PF plots after the introduction of P. zhennan, the GPP and WUE of MF plots were significantly higher than those of PF plots. In the context of a changing climate and especially in nutrient-poor soils, competition for nutrients among these two tree species may be enhanced because of their overlapping ecological niches. Based on these findings, MPs have a stronger ability to withstand climatic change and should therefore be preferred plantation types to facilitate the development of sustainable forestry.
ACKNOWLEDGEMENTS
This research was supported by National Key Research and Development Program Project (2023YFF1304404), the National Natural Science Foundation of China (No. 42377068), China Postdoctoral Fund (2022M720693) and the Qing Lan Project.
CONFLICT OF INTEREST STATEMENT
The authors declare no known competing financial interests or personal relationships that could have appeared to influence the work reported in this paper.
Open Research
DATA AVAILABILITY STATEMENT
Data will be made available on request.


