Biochemical versus stomatal acclimation of dynamic photosynthetic gas exchange to elevated CO2 in three horticultural species with contrasting stomatal morphology
Abstract
Understanding photosynthetic acclimation to elevated CO2 (eCO2) is important for predicting plant physiology and optimizing management decisions under global climate change, but is underexplored in important horticultural crops. We grew three crops differing in stomatal density—namely chrysanthemum, tomato, and cucumber—at near-ambient CO2 (450 μmol mol−1) and eCO2 (900 μmol mol−1) for 6 weeks. Steady-state and dynamic photosynthetic and stomatal conductance (gs) responses were quantified by gas exchange measurements. Opening and closure of individual stomata were imaged in situ, using a novel custom-made microscope. The three crop species acclimated to eCO2 with very different strategies: Cucumber (with the highest stomatal density) acclimated to eCO2 mostly via dynamic gs responses, whereas chrysanthemum (with the lowest stomatal density) acclimated to eCO2 mostly via photosynthetic biochemistry. Tomato exhibited acclimation in both photosynthesis and gs kinetics. eCO2 acclimation in individual stomatal pore movement increased rates of pore aperture changes in chrysanthemum, but such acclimation responses resulted in no changes in gs responses. Although eCO2 acclimation occurred in all three crops, photosynthesis under fluctuating irradiance was hardly affected. Our study stresses the importance of quantifying eCO2 acclimatory responses at different integration levels to understand photosynthetic performance under future eCO2 environments.
1 INTRODUCTION
Atmospheric CO2 concentration may double from current levels by the end of this century (IPCC, 2021). As it is the substrate for photosynthesis, increasing CO2 usually enhances net photosynthesis rate (A) and growth. However, plants that are grown under elevated CO2 (eCO2) for longer show acclimation in photosynthetic traits that affect A and crop productivity (Cai et al., 2016, 2018). Photosynthesis can show developmental and dynamic (or physiological) acclimation. Developmental acclimation refers to changes in anatomical and biochemical traits while the leaf is developing, whereas dynamic acclimation is associated with adjustments in leaf pigments and biochemical composition of the chloroplast, after leaf development has fixed traits such as stomatal density (Morales & Kaiser, 2020). Photosynthetic acclimation to eCO2 has been studied intensely, to assist in optimizing crop management and breeding, as well as to predict global carbon and water cycles in the context of climate change (Ainsworth & Long, 2005; Ainsworth & Rogers, 2007). In crops, focus has been on staple foods such as rice, wheat, and soybean (Cai et al., 2018; Leakey et al., 2006). While staple crops are crucial, horticultural crops—including vegetables and ornamentals—are essential for the nutritional and mental needs of humans. Furthermore, many horticultural crops are cultivated in greenhouses with supplementary CO2. Nevertheless, the mechanisms underlying photosynthetic acclimation to eCO2 are understudied in horticultural crops.
Photosynthesis is limited by diffusional and biochemical constraints. Diffusional constraints arise due to stomatal (gs) and mesophyll conductance (gm), while biochemical constraints arise due to the light and carbon reactions driving A. gs often decreases under eCO2, partly due to reductions in stomatal density, index, and aperture (Ainsworth & Rogers, 2007; Bunce, 2001; Zhu et al., 2018). gm also tends to reduce under eCO2, but this response is more variable between species (Jahan et al., 2021; Singsaas et al., 2004). Many traits including leaf nitrogen content, ribulose-1.5-bisphosphate carboxylase oxygenase (Rubisco) content and activity generally decrease under eCO2 (Cao et al., 2007; Tissue et al., 1993; Urban et al., 2012), often reducing photosynthetic capacity. Studies on eCO2 acclimation have focused on steady-state photosynthesis, which is measured under stable conditions. However, plants in the field and in greenhouses are often exposed to dynamically changing light due to changes of solar angle, cloud movements, and wind-induced leaf movements (Kaiser et al., 2018; van Westreenen et al., 2023). Therefore, A is seldomly at steady state, but can lag behind changes in irradiance, as several processes underlying photosynthesis activate and deactivate slowly. Nevertheless, eCO2 acclimation effects on dynamic leaf photosynthesis received less attention compared to those on steady-state photosynthesis. Early studies showed that eCO2 acclimated plants increased carbon gain under fluctuating irradiance, compared to plants grown at ambient CO2; this increase was attributed to faster carbon gain, extended post-illumination assimilation, or higher gs, with different species showing different acclimatory responses (Tomimatsu & Tang, 2016). In rice and wheat, acclimation to eCO2 affected photosynthetic induction only slightly (Kang et al., 2021).
There is wide genotypic variation for dynamic photosynthesis: for example, the extent of transient RuBP regeneration limitation was relatively similar among wheat genotypes and between different horticultural crops (Salter et al., 2019; Zhang et al., 2022). Additionally, the rate of Rubisco activation, expressed as the transient change of maximum carboxylation rate (Vcmax) during photosynthetic induction (Salter et al., 2019; Soleh et al., 2016), was found to differentially affect the rate of photosynthetic induction in rice, wheat, and soybean (Acevedo-Siaca et al., 2020; Salter et al., 2019; Soleh et al., 2016). However, in some tropical trees, shrubs, and crops (e.g. cassava), photosynthetic induction was strongly controlled by gs (Allen & Pearcy, 2000; De Souza et al., 2020; Valladares et al., 1997). Hence, species differ in the trait that dominates photosynthetic induction, potentially influencing how acclimation to eCO2 affects dynamic A.
In a range of horticultural crops, variation in photosynthetic induction was driven mostly by stomatal traits, including initial gs at low irradiance and the rate of stomatal opening during photosynthetic induction (Zhang et al., 2022). Stomatal opening speed often relates to stomatal size, i.e. larger stomates tend to respond more slowly to an increase in irradiance than small stomates (Drake et al., 2013; Lawson & Vialet-Chabrand, 2019; Raven, 2014). However, the rate of movement of individual stomata does not always correspond to actual gs changes (which is a bulk response across many stomata), given that stomatal density co-determines gs, and the response of neighboring stomata to the same environmental stimuli can differ strongly (Kaiser & Kappen, 2000; van den Berg et al., 2022; Zhang et al., 2022). Stomatal responses to eCO2 have been studied in terms of average stomatal conductance, size, or density per unit leaf area (Hao et al., 2023; Li et al., 2004). Responses of individual stomata to eCO2, including their rates of movement under fluctuating irradiance, as well as their relation to gs, are still unknown.
We aimed to elucidate the acclimation of dynamic A to eCO2 in three important horticultural crops: cucumber, tomato, and chrysanthemum. Previously, we found that these crops largely differed in their stomatal traits, with cucumber having tiny and dense stomates, chrysanthemum having large but few stomates, and tomato having intermediate stomatal size and density (Zhang et al., 2022). We hypothesized that species with a higher stomatal density would show stronger eCO2 acclimation in stomatal anatomy, leading to changes in gs kinetics responding to irradiance increase and decrease, while species with fewer stomates would mostly acclimate to eCO2 via biochemistry during photosynthetic induction and the post-illumination phase.
2 MATERIALS AND METHODS
2.1 Plant materials, growth conditions, and experimental setup
The experiment was conducted in a climate chamber (size: 9 m2) located at Wageningen, the Netherlands. The chamber was equipped with dimmable LED modules (DRWFR_RSE 400 V 1.1D MP, Signify, the Netherlands), which produced a diurnal average of ~250 μmol m−2 s−1 of photosynthetically active radiation (PAR) at plant height. The daily PAR regime followed a sinusoidal pattern (16 h light period, minimum PAR of 120 μmol m−2 s−1, maximum PAR of 1200 μmol m−2 s−1) with random drops of PAR that mimicked natural irradiance fluctuations (Supporting Information S1: Figure S1). The general sinusoidal pattern and daily light sum stayed the same during the whole experiment, whereas the timing and extent of random PAR decreases changed daily. Day and night temperatures were set to 23 and 20°C respectively, and relative air humidity (RH) was set to 70% (realized temperature and RH values were given in Supporting Information S1: Figure S2).
Two CO2 treatments were used: 450 μmol mol−1 (aCO2) and 900 μmol mol−1 (eCO2). At the start of each CO2 treatment, tomato (cv. ‘Merlice’; Bayer, NL) and cucumber (cv. ‘HiPower’; BASF Nunhems, NL) seeds were sown in rockwool plugs (diameter: 2 cm; Grodan, NL). Chrysanthemum (cv. ‘Anastasia’; Deliflor, NL) plants that had been grown in plastic pots (~1 L, filled with potting soil) were cut back at the third or fourth node to allow for the formation of new axillary buds. One week after sowing, tomato and cucumber seedlings were transplanted to rockwool cubes (10 × 10 × 7 cm; Grodan), and treatment was started. Plants were treated for a total of 6 weeks, and all measurements were conducted in the last 2 weeks of treatment. The experiment was conducted in four consecutive runs, where each CO2 treatment was applied twice. Plants were irrigated twice per day (at 7:00 and 19:00 h) with nutrient solution using an ebb and flow system (Supporting Information S1: Table S1).
2.2 Photosynthetic gas exchange measurements
A and gs were measured on the youngest, fully expanded leaf using a gas exchange system (LI-6800, Li-Cor Bioscience) equipped with a 6 cm2 leaf chamber fluorometer. Measurements were performed at an air temperature of 23°C, relative humidity of 70%, and a flow rate of air through the system of 500 μmol s−1. Irradiance was provided by a mixture of red (90%) and blue (10%) LEDs in the fluorometer. Different types of measurements (see below) were randomized to avoid artefacts due to diurnal effects, except that measurements under the “fluctuating irradiance regime” (see below) were always performed in the morning. Once photosynthetic induction was measured on a given plant, this plant was not used for another measurement for at least 25 min, to avoid interference with previous conditions. All gas exchange measurements were conducted between 9:00 and 17:00 h.
2.2.1 Photosynthetic induction and post-illumination processes
Before gas exchange measurements, plants were preconditioned to a low irradiance of ca. 50 μmol m−2 s−1 with 90% red and 10% blue provided by LED modules for 40–60 min. Gas exchange measurements were conducted under both 450 and 900 μmol mol−1 CO2. Once inside the cuvette of the LI-6800, the leaf was exposed to a low irradiance of 50 μmol m−2 s−1 for 30 min, after which the irradiance was increased in a single step to a high irradiance of 1000 μmol m−2 s−1 for 60 min, after which irradiance was dropped back to 50 μmol m−2 s−1 for 30 min. Infrared gas analysers were matched before each measurement. Gas exchange data was logged every 2 s. A total of six plants per species were measured from the two repetitions of the CO2 treatments.
2.2.2 Dynamic A/CI curves
Before gas exchange measurements, plants were preconditioned to a low irradiance of ca. 50 μmol m−2 s−1 with 90% red and 10% blue provided by LED modules for 40–60 min. Photosynthetic induction was measured under a range of CO2 concentrations: 50, 100, 200, 300, 600, and 1200 μmol mol−1. The leaf was first exposed to a low irradiance of 50 μmol m−2 s−1 for 10 min, after which the irradiance was increased in a single step to a high irradiance of 1000 μmol m−2 s−1 for 15 min. Infrared gas analysers were matched before each measurement. Gas exchange data was logged every 2 s. A total of six plants per species was measured (three plants per experimental run).
2.2.3 Fluctuating irradiance regime
A random irradiance fluctuation profile was created that lasted 90 min, with irradiance peaks gradually increasing to mimic typical irradiance fluctuations in the morning (Supporting Information S1: Figure S3). This irradiance regime was implemented in the gas exchange system, and measurements were conducted twice per biological replicate, once at 450 and once at 900 μmol mol−1 CO2. Infrared gas analysers were matched before each measurement. Gas exchange data were logged every 2 s. A total of 5–6 plants per species were measured across the two repetitions of the CO2 treatments.
2.2.4 Steady-state A/Ci curves
In the second repetition of each CO2 treatment, steady-state A versus Ci curves were measured on six plants per species. Before measurements, plants were pre-conditioned under an irradiance of ca. 600 μmol m−2 s−1 provided by LED modules for at least 30 min. Then, the leaf was clipped in the leaf chamber under 1800 μmol m−2 s−1, until A and gs reached a steady state. A versus Ci curves were measured by changing ambient CO2 concentrations in a stepwise manner: 400, 300, 200, 100, 50, 25, 400, 400, 600, 800, 1000, 1200, 1500, and 1800 μmol mol−1, with each CO2 step taking 3–5 min. Infrared gas analysers were matched at each CO2 step.
2.3 Stomatal anatomy
Stomatal imprints were taken after the final gas exchange measurement on a given plant had been completed. Before taking imprints, plants were dark-acclimated at least for 20 min to allow for stomatal closure to minimize errors in guard cell width measurements caused by different levels of stomatal opening (Franks & Farquhar, 2007). Imprints were taken using a silicone impression material (Zhermack) with two technical replicates per leaf surface. The silicon was allowed to fully dry on the leaf before being gently removed. Clear nail polish was applied to the imprint and allowed to dry. The dry nail polish was viewed under a microscope (Leitz Aristoplan, Leica Microsystems) and photographed with a PL FLUOTAR 25X objective in chrysanthemum and tomato (NA 0.60) and 40X objective in cucumber (NA 0.70) (Axiocam 305 Color). Images were analysed with ImageJ, using the CellCounter and ObjectJ plugins (National Institute of Health). Length and width of individual stomata were measured, and the number of stomata in the field of view was counted.
2.4 Measurements of individual stomatal pore opening and closure
Individual stomatal pore aperture kinetics under stepwise changes in irradiance were measured on the same leaf used for gas exchange measurements using a customized microscope placed inside the growth chamber (van den Berg et al., 2024). A green background light of 75 μmol m−2 s−1 was applied during the whole measurement for imaging. The leaf was firstly acclimated to an actinic light of 50 μmol m−2 s−1 (50% red, 50% blue) for 30 min. Then, imaging was started with an actinic light of 50 μmol m−2 s−1 for 30 min, after which the actinic light was increased to 1000 μmol m−2 s−1 with a single step that lasted 60 min, followed by a decrease of actinic light intensity to 50 μmol m−2 s−1 for 30 min. Chrysanthemum and tomato leaves were measured with a 20X objective (Mitutoyo plan apo infinity corrected long working distance objective, NA 0.42), and cucumber leaves were measured with a 50X objective (Mitutoyo plan apo HR infinity corrected objective, NA 0.75). Measurements were conducted once a minute, and at each measurement, image stacks of 90−100 images were recorded that were spaced apart 1 µm on the z-axis parallel to the imaging plane for chrysanthemum and tomato and 0.5 μm for cucumber. Image stacks were made to image the entire leaf surface within the field of view in focus at a high resolution (van den Berg et al., 2024).
2.5 Calculations
2.5.1 Rate of A induction
2.5.2 Rate of Vcmax induction
2.5.3 Post-illumination CO2 fixation and burst
Final, steady-state A reached in low irradiance during the post-illumination phase (Af, post) was calculated as average A measured during the last minute after returning to low irradiance. Then, Af, post was subtracted from all instantaneous A measured during the post-illumination phase. The sum of the first few positive values (until the appearance of the first negative value) after subtracting Af, post was defined as the post-illumination CO2 fixation, and the sum of all rest values after subtracting Af, post was defined as post-illumination CO2 burst (Leakey et al., 2002).
2.5.4 Kinetics of stomatal responses
The pattern of individual pore area changes upon a single-step irradiance change was found to be similar to the gs response (Supporting Information S1: Figure S4). Thus, Equation 3 was also used to quantify the response of individual stomata upon step changes in irradiance. The maximum of the derivative of the fitted curve was identified as the maximum speed of pore opening (Sli) and closing (Sld). Fits for parameters of individual stomata were averaged for each biological replicate with the standard errors of the fitted parameters used as weights (Supporting Information S1: Table S2).
2.5.5 Steady-state photosynthetic parameters
The FvCB model was fitted to steady-state A/Ci curves to provide estimates of Vcmax, electron transport rate at saturating irradiance 1800 μmol m−2 s−1 (J1800), triose phosphate utilization (TPU) and Rd using the R package ‘Plantecophys’ (Duursma, 2015; Farquhar et al., 1980).
2.6 Statistical analysis
Differences between treatments were detected using one-way ANOVA (p < 0.05), taking experimental run as a block effect. Normality and homogeneity of variances were tested using Shapiro-Wilk and Levene's test, respectively. In case data were not normally distributed or inhomogeneous, log transformation was performed. When a significant difference was detected, a post hoc test was conducted for pairwise comparisons between treatments using Fisher's Protected Least Significant Difference (LSD) test (p < 0.05). Statistical analyses were conducted using R (http://www.r-ptoject.org/).
3 RESULTS
3.1 Effects of acclimation to eCO2 on dynamic A
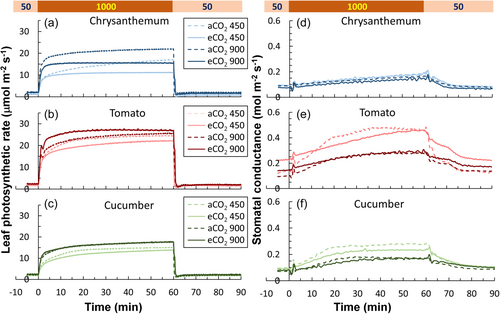
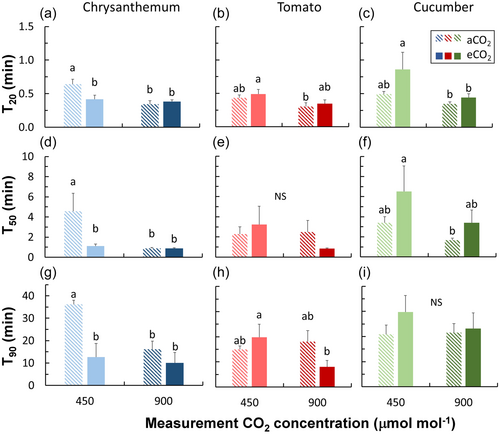
Chrysanthemum, tomato, and cucumber showed different acclimation responses in photosynthetic induction characteristics (Figures 1a–c and 2). Chrysanthemum grown under eCO2 displayed smaller time constants—times needed to reach 20%, 50%, and 90% full photosynthetic induction (T20, T50 and T90)—compared with plants grown under aCO2, especially when measured at 450 μmol mol−1 CO2 (Figure 2a,d,g). In contrast, cucumber grown under eCO2 tended to have larger time constants (especially for T20 and T50) compared with plants grown under aCO2 (Figure 2c,f,i). Acclimation responses in time constants of tomato were situation dependent: tomato grown under eCO2 tended to show larger time constants when measured at CO2 of 450 μmol mol−1, but smaller time constants when measured at 900 μmol mol−1 (Figure 2b,e,h). Overall, eCO2 acclimation responses in time constants were strongest in chrysanthemum and more subtle in tomato and cucumber (Figure 2).
The time course of Vcmax induction had similar shapes between aCO2 and eCO2 plants in all three crops (Supporting Information S1: Figure S5). Absolute values of maximum Rubisco carboxylation rate (Vcmax) during photosynthetic induction, however, were mostly lower in eCO2 acclimated plants, especially during the final stages of Rubisco activation (Supporting Information S1: Figure S5). Time constants of the fast and slow phase of Vcmax induction (τfast and τlow) were generally smaller in eCO2 plants, with chrysanthemum showing the strongest response, followed by tomato. The growth CO2 concentrations hardly affected τfast and τlow in cucumber (Figure 3).

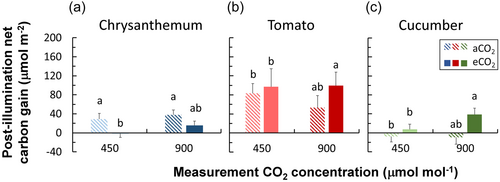
When grown under eCO2, the net carbon gain during the post-illumination phase was lower in chrysanthemum, but was higher in tomato and cucumber, compared to plants grown under aCO2 (Figure 4). Chrysanthemum grown under eCO2 showed smaller values of post-illumination CO2 fixation, but higher levels of CO2 burst (Supporting Information S1: Figure S6a,d). In contrast, tomato and cucumber generally showed higher levels of post-illumination CO2 fixation and reduced levels of CO2 burst when grown under eCO2 (Supporting Information S1: Figure S6b,c,e,f).
3.2 Stomatal conductance kinetics and anatomical traits
Acclimation responses of stomatal conductance (gs) kinetics after a stepwise increase and decrease in irradiance varied between the three crops (Figure 1d–f). Values of steady-state gs of tomato and cucumber were hardly affected by eCO2 acclimation, except that initial gs of tomato under low irradiance (gs,i) increased in eCO2 plants (Figure 5b). gs kinetics, however, were clearly affected: time constants of gs increase and decrease upon irradiance changes (ki and kd) were significantly larger in eCO2 plants compared to aCO2 plants, for ki of tomato and kd of cucumber (Figure 5h,k,i,l). In chrysanthemum, neither steady-state nor dynamic gs were affected by eCO2 acclimation (Figure 5a,d,g,j).
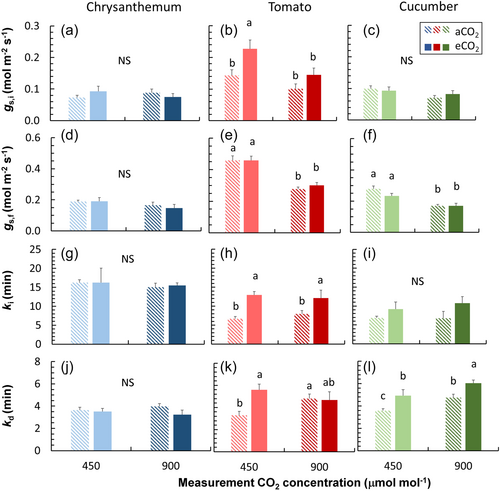
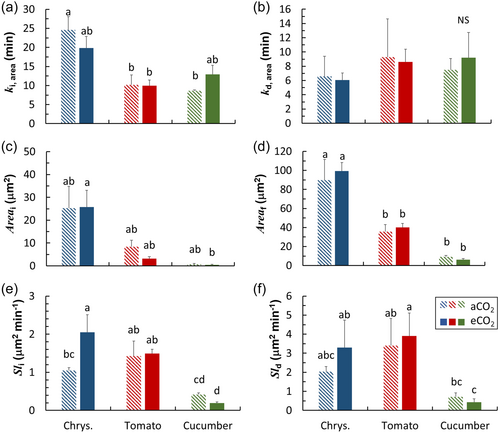
Final steady-state pore area was not significantly different between eCO2 and aCO2 plants (Figure 6c,d). Time constants of pore area increase and decrease upon irradiance changes (ki, area and kd, area) were not significantly different between eCO2 and aCO2 plants (Figure 6a,b). Chrysanthemum clearly showed acclimation responses in terms of individual pore movements: there was a strong increase in Sli of eCO2 plants compared to aCO2 plants (Figure 6e), and there were trends for nonsignificant increases in Sld and decreases in ki, area and kd, area in eCO2 plants compared to aCO2 plants (Figure 6a,b,f). In contrast, cucumber showed opposite trends for individual stomatal pore movements: both ki, area and kd, area increased, whereas Sli and Sld decreased, in eCO2 compared to aCO2 plants (Figure 6a,b,e,f). Variations between species in terms of time constants for individual stomatal pore movements showed similar trends as gs kinetics: chrysanthemum had the largest ki, area and the smallest kd, area among the three species (Figure 6a,b).
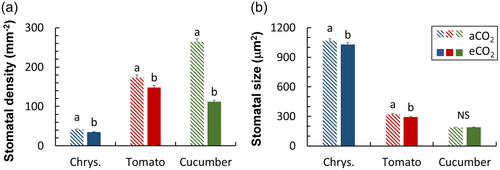
In leaves acclimated to eCO2, stomatal density was decreased in all species, whereas responses in stomatal size varied between species. Cucumber showed the strongest reduction in stomatal density (50%−60% depending on leaf surface), whereas stomatal size in cucumber was unaffected (Figure 7; Supporting Information S1: Figure S7). In tomato and chrysanthemum there was a weaker reduction (11%−34%) in stomatal density upon eCO2, with additional slight decreases in stomatal size (4%−9%) (Figure 7).
3.3 High CO2 acclimation of steady-state photosynthetic parameters
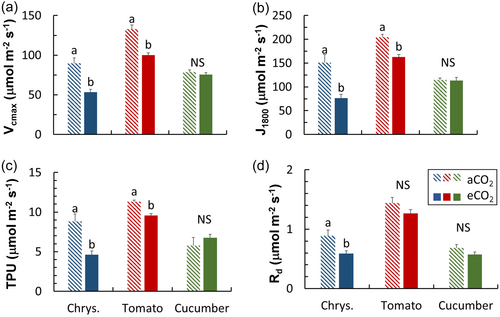
Chrysanthemum showed the largest degree of acclimation in photosynthetic capacity, with strong reductions in Vcmax, J1800, TPU, and Rd in eCO2 plants (Figure 8). Tomato also showed reductions Vcmax, J1800, and TPU in eCO2 plants, albeit to a lesser degree, while cucumber showed no reductions in either of these parameters (Figure 8).
3.4 Net carbon gain under fluctuating irradiance
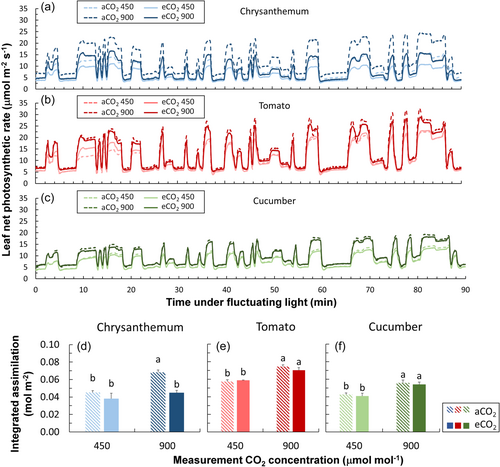
Short-term exposure to eCO2 increased A under fluctuating irradiance (see Supporting Information S1: Figure S3 for pattern) in all three crops; although in chrysanthemum leaves that had acclimated to eCO2, the short-term effect of eCO2 on time-integrated A was not significant (Figure 9d). For the long-term eCO2 acclimation effect, A of chrysanthemum under fluctuating irradiance was higher in eCO2 acclimated plants compared with plants grown under aCO2, when measured at both 450 and 900 μmol mol−1 CO2 (Figure 9a). A of tomato and cucumber was generally slightly decreased by eCO2 acclimation (Figure 9b,c). Nevertheless, integrated assimilation during the 90 min fluctuating irradiance period was not significantly affected by eCO2 acclimation. Except when measured at 900 μmol mol−1 CO2, integrated assimilation of chrysanthemum was lower in eCO2 acclimated plants (Figure 9d–f).
4 DISCUSSION
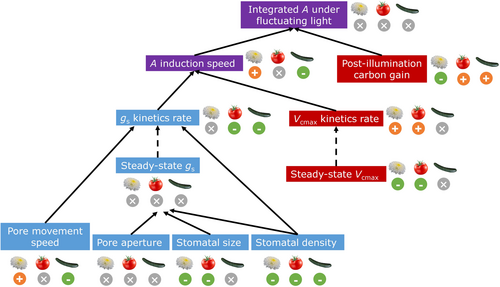
Most knowledge of photosynthetic acclimation to eCO2 stems from research on field crops and forestry species, but eCO2 acclimation in horticultural species is largely unknown. Here, we showed that three important horticultural crops clearly exhibited eCO2 acclimation in both dynamic and steady-state photosynthetic and stomatal traits, and that they did so very differently: cucumber, having the densest and tiniest stomata, showed strong stomatal but not biochemical acclimation, whereas chrysanthemum, with the least dense but largest stomata, acclimated to eCO2 mostly via photosynthetic biochemistry, but not leaf-level gs. Although different types of eCO2 acclimation responses occurred in all three species, time-integrated A under fluctuating irradiance was hardly affected, suggesting that leaves can use various compensatory mechanisms towards achieving the same outcome (Figure 10).
4.1 Photosynthetic acclimation to eCO2 differed substantially between three horticultural crops
Acclimation of leaf photosynthesis to eCO2 has received a lot of attention in the past decades in the context of global climate change (Becklin et al., 2021). Most studies have focused on eCO2 acclimation of leaf photosynthetic capacity (in the steady state), and biochemical and anatomical traits underlying it (Ainsworth & Long, 2005; Ainsworth & Rogers, 2007; Leakey et al., 2009). Upon acclimation to eCO2, many species reduce leaf photosynthetic capacity as well as gs, stomatal density and size (e.g. Cai et al., 2018; Tjoelker et al., 1998; Zhu et al., 2018). We found that chrysanthemum, tomato, and cucumber clearly showed eCO2 acclimation of both dynamic and steady-state photosynthesis, but the three species differed in which traits were affected. Chrysanthemum acclimated to eCO2 by reducing photosynthetic capacity (e.g. J1800 and Vcmax), whereas cucumber did not (Figure 8). In contrast, cucumber mostly responded to eCO2 via decreasing steady-state gs and slowing down gs kinetics, whereas gs of chrysanthemum hardly responded to eCO2 (Figure 5). Tomato did a bit of both, by lowering leaf photosynthetic capacity and changing gs responses, but these responses were smaller than those of either chrysanthemum (Figure 8) or cucumber (Figure 5).
Compared to the vast amount of research on eCO2 acclimation of steady-state A, very few studies (Kang et al., 2021; Leakey et al., 2002; Tomimatsu et al., 2019) have focused on acclimation of dynamic A and stomatal traits to eCO2. In early studies, photosynthetic induction was measured under the same CO2 concentration as the growth environment, and it was generally found that eCO2 acclimation reduced the time needed for photosynthetic induction (Košvancová et al., 2009; Leakey et al., 2002; Tomimatsu & Tang, 2012). However, given that the speed of photosynthetic induction typically increases when measurements are conducted at high CO2 (Kaiser et al., 2015, 2017; Kang et al., 2021), comparisons in many early studies (e.g. on Populus, Shorea leprosula, Fagus sylvatica) have mixed the eCO2 acclimation effect with its transient effect (Košvancová et al., 2009; Leakey et al., 2002; Tomimatsu & Tang, 2012). Recent studies (e.g. in rice, wheat and Populus) have separated the acclimation versus transient effect of eCO2 on photosynthetic induction and show that acclimation to eCO2 hardly changes the speed of photosynthetic induction (Kang et al., 2021; Tomimatsu et al., 2019). We found that in tomato and cucumber, effects of eCO2 acclimation on photosynthetic induction were mostly nonsignificant, whereas acclimation to eCO2 in chrysanthemum substantially reduced the time needed for photosynthetic induction, when measured at ambient CO2 (Figure 2); this could be because in this case, A only needed to reach to a low level at high irradiance (Figure 1a), which may further connect with smaller time constants of Vcmax induction that possibly resulted from a lower steady-state Vcmax (Figures 3 and 7a). Tomato also showed smaller time constants of Vcmax induction in eCO2 acclimated leaves (Figure 3), but this did not speed up photosynthetic induction, possibly because gs responses to irradiance changes tended to be slower in eCO2 acclimated leaves (Figures 2b,e,h and 5h,k). In cucumber, neither the steady-state value nor the induction rate of Vcmax were affected by eCO2 acclimation (Figures 3 and 7a), however, the speed of photosynthetic induction tended to be slower, possibly caused by slower gs responses to irradiance changes (Figure 5). The slower gs responses in eCO2 acclimated tomato may have resulted in a higher net carbon gain during the post-illumination phase (Figure 4b,c), since photosynthesis could function under a relatively high gs for a longer period when irradiance dropped to a low level (allowing for a high Ci). Overall, these results suggest that the three important horticultural crops acclimated to eCO2 with very different strategies.
4.2 All crops exhibited eCO2 acclimation in stomatal anatomy, but this did not always affect individual pore movement dynamics and leaf-level gs
Stomatal density and aperture are often reduced when plants grow in high CO2, often leading to reduced gs (Chater et al., 2015). We also found significant decreases in stomatal density in all three horticultural crops grown at eCO2, as well as decreases in stomatal size (except for cucumber; Figure 7). However, acclimation in stomatal anatomy under eCO2 did not translate into changes in operational gs in the steady state: values of gs at both low and high irradiance (initial and final gs) were hardly affected by eCO2 acclimation (Figure 5a–f). Nevertheless, theoretical maximum gs decreased, especially in cucumber and tomato, mostly due to decreases in stomatal density (Supporting Information S1: Figure S8). In rice, genotypic variation in stomatal morphology was found to correlate with steady-state gs to a small extent only, but more strongly with dynamic gs responses to an irradiance increase (Xiong et al., 2022). We also found relatively stronger acclimation responses in dynamic compared to steady-state gs traits (Figure 5). Moreover, it seems that crops with higher stomatal density showed stronger acclimatory responses to eCO2 in terms of gs kinetics (Figures 5 and 7).
Several recent studies have highlighted the effects of eCO2 acclimation on gs dynamics (De Souza et al., 2020; Wall et al., 2023): eCO2 acclimation tends to decrease the speed for gs increase upon an irradiance increase in rice and wheat (Kang et al., 2021; Wall et al., 2023). We found that eCO2 acclimation increased the time needed for gs increase (ki) in tomato (Figure 5h), similarly to other species (Kang et al., 2021; Wall et al., 2023). The slower gs response in eCO2 acclimated plants could partly be explained by reductions in stomatal density, requiring individual stomatal pores to open to a larger extent to reach a given gs (Zhang et al., 2022). With a custom-made microscope that could follow the opening and closure of individual stomata in situ, we quantified eCO2 acclimation effects on individual pore movement dynamics in the growth environment (van den Berg et al., 2024). We found that eCO2 acclimation responses of individual pores were quite different from leaf-level gs: for example, individual pore opening in eCO2 acclimated Chrysanthemum leaves was faster (Figure 6e,f). However, despite faster responses of individual pores, gs responses were hardly affected by eCO2 acclimation in chrysanthemum, possibly due to decreased stomatal density (Figures 5 and 7). Nevertheless, it should be noted that microscope measurements were conducted with a larger boundary layer and less tightly controlled microclimate than in the LI-6800, which may have caused some of the differences observed. We conclude that the apparent gs response is a complex integrated result from responses of stomatal anatomy at leaf level and pore movement at individual stomata level, and it is necessary to quantify eCO2 acclimatory responses at different integration levels to understand plant photosynthesis and transpiration under elevated CO2.
4.3 eCO2 acclimation only marginally affected A under fluctuating irradiance
Traits pertaining to dynamic photosynthesis are often investigated by measuring photosynthetic induction, using a single-step change from a low to a (much) higher irradiance and keeping that higher irradiance steady until a new steady state is reached. However, under natural irradiance fluctuations, irradiances often change at high frequencies (Durand et al., 2021; Kaiser et al., 2018), which causes photosynthesis to transiently change between non-steady states. In other words: while photosynthesis is busy adjusting to a change in irradiance, it is already exposed to another irradiance and may be exposed to yet another irradiance 0.1 s later. This raises a question: how to extrapolate photosynthetic behavior under fluctuating irradiances from photosynthetic induction measurements? Our results showed that despite the eCO2 acclimation in dynamic and steady-state photosynthesis discussed above, effects on time-integrated A under fluctuating irradiance were nonsignificant in most cases (Figures 9 and 10). How can these results be explained? We hypothesize that different acclimatory responses affected A in opposite directions, leading to a canceling-out of these effects. For example, we found lower steady-state A in high CO2 acclimated chrysanthemum and tomato, and slower gs responses to irradiance changes in high CO2 acclimated tomato and cucumber; such responses reduced A under fluctuating irradiance in previous studies (Kimura et al., 2020; Ohkubo et al., 2020) (Figure 10). In contrast, faster photosynthetic induction was found in high CO2 acclimated chrysanthemum, which by itself should increase A under fluctuating irradiance (Adachi et al., 2019), but at the same time steady-state A in chrysanthemum was reduced (Figure 10). An overall higher net carbon gain during the post-illumination phase in eCO2 tomato and cucumber was found in our study (Figure 4), which should increase A under fluctuating irradiance (Figure 10). By integrating the stomatal morphology with dynamic photosynthesis models that consider relevant biochemical and diffusional processes (e.g. Morales et al., 2018), the relative importance of each individual acclimatory response on dynamic A can be quantified. This could further help to identify promising traits for crop breeding under future eCO2 conditions. Our results suggest the potential importance of testing dynamic photosynthesis traits estimated from conventional induction measurements under fluctuating irradiance to provide a more accurate evaluation of plant performance under naturally fluctuating light conditions.
5 CONCLUSIONS
Acclimation strategies to eCO2 strongly varied between three major horticultural crop species. Cucumber, which had the highest stomatal density, mostly acclimated to eCO2 by altering dynamic gs kinetics. Chrysanthemum—with the least dense but largest stomates—showed the strongest acclimation in steady-state leaf photosynthetic traits. Interestingly, chrysanthemum also showed the strongest acclimation in individual stomatal pore movement, with faster opening and closure in eCO2 leaves, but this had no effects on leaf-level gs. Tomato showed acclimatory responses in both stomatal and leaf photosynthetic traits, but with intermediate levels of acclimation compared to chrysanthemum and cucumber. Despite these different acclimatory responses in all three crops, surprisingly, none showed strong effects of eCO2 acclimation on photosynthesis under fluctuating irradiance, possibly due to different trait responses resulting in a mixture of positive and negative effects on operational photosynthesis. We conclude that photosynthetic acclimation to eCO2 is a complex integration of leaf biochemistry and stomatal traits, and responses at different integration levels need to be quantified (e.g. through modelling) to understand carbon assimilation under fluctuating irradiance to identify promising traits for crop breeding under future eCO2 environments.
ACKNOWLEDGEMENTS
We thank Dominique Joubert for providing Matlab code for Vcmax induction estimations, and Nik Woning and Sam Loontjens for analysing stomatal imprints. We also thank Deliflor, Nunhems/BASF, and Bayer Crop Science for providing seeds or plants, and Signify for providing LED lamps. This project (No. 17173) was funded by the Netherlands Organisation for Scientific Research (NWO), with contributions by Signify, Glastuinbouw Nederland, Ridder Growing Solutions, and Adviesbureau JFH Snel. TvdB was supported by the 4TU HTSF program Plantenna.
CONFLICT OF INTEREST STATEMENT
The authors declare no conflict of interest.
Open Research
DATA AVAILABILITY STATEMENT
The original contributions presented in the study are included in the article/Supplementary Material, further inquiries can be directed to the corresponding authors.


