Deep-water uptake under drought improved due to locally increased root conductivity in maize, but not in faba bean
Abstract
Moderate soil drying can cause a strong decrease in the soil-root system conductance. The resulting impact on root water uptake depends on the spatial distribution of the altered conductance relatively to remaining soil water resources, which is largely unknown. Here, we analyzed the vertical distribution of conductance across root systems using a novel, noninvasive sensor technology on pot-grown faba bean and maize plants. Withholding water for 4 days strongly enhanced the vertical gradient in soil water potential. Therefore, roots in upper and deeper soil layers were affected differently: In drier, upper layers, root conductance decreased by 66%–72%, causing an amplification of the drop in leaf water potential. In wetter, deeper layers, root conductance increased in maize but not in faba bean. The consequently facilitated deep-water uptake in maize contributed up to 21% of total water uptake at the end of the measurement. Analysis of root length distributions with MRI indicated that the locally increased conductance was mainly caused by an increased intrinsic conductivity and not by additional root growth. Our findings show that plants can partly compensate for a reduced root conductance in upper, drier soil layers by locally increasing root conductivity in wetter layers, thereby improving deep-water uptake.
1 INTRODUCTION
Terrestrial plants exposed to drying soils suffer from a reduced water potential which can lead to cell turgor loss (Bartlett et al., 2012), hydraulic failure of xylem vessels (Urli et al., 2013) and impaired phloem transport (Thompson, 2006). To mitigate this, plants close stomata at the cost of reduced CO2 gain, up to carbon starvation (McDowell, 2011). In the first place, the reduced plant water potential is caused by the drop in soil water potential. However, the plant water potential additionally depends on how the hydraulic conductance of the root system is affected by soil drying (Bourbia et al., 2021; Nobel & Cui, 1992; Rodriguez-Dominguez & Brodribb, 2020; Saliendra & Meinzer, 1989). In a recent study, we showed that even moderate soil drying can induce an exponential decline of the total root system conductance (Müllers, Postma, Poorter, & van Dusschoten, 2022). Considering the distribution along the root system of such a net decline is crucial to understand its impact on the plant water balance.
Soil drying is a highly nonuniform process and usually results in a pronounced vertical gradient with relatively dry shallow soil layers and relatively wet deep soil layers (Hillel et al., 1976; Kondo et al., 2000; Markesteijn et al., 2010). Under such conditions, water in deeper layers is much easier to extract, that is, a deep root requires a less negative xylem water potential to realize a certain water uptake rate compared with an otherwise identical shallow root. Following this rationale, effectively using deep water resources is a key to withstand droughts (Wasson et al., 2012). However, several studies emphasize that plants often fail to do so and experience severe drought stress despite a relatively high water availability in deeper root zones (Gessler et al., 2022; Passioura, 1983; Prechsl et al., 2015; Rasmussen et al., 2020). A major reason is that the root conductance (Kroot, see Table 1 for abbreviations) in deeper layers usually is low since roots are less abundant (Haberle & Svoboda, 2015; Kemper et al., 2020; Righes, 1980) and less conductive compared with shallow roots (Dara et al., 2015; Müllers, Postma, Poorter, Kochs, et al., 2022; Zarebanadkouki et al., 2013). Therefore, a more effective acquisition of deep water would require to locally increase root conductance over time. This can be achieved by increasing root length via additional root growth in deeper layers, which has been often observed upon soil drying (Alsina et al., 2011; Asseng et al., 1998; Dubrovsky et al., 1998; Rodrigues et al., 1995; Sharp & Davies, 1985). Nevertheless, as root hydraulic traits vary among individual roots and entire root systems (Ahmed et al., 2016, 2018; Clément et al., 2022; Müllers, Postma, Poorter, Kochs, et al., 2022; Rewald et al., 2012; Steudle & Peterson, 1998), local root length only partly determines a plant's ability to use deep water. Additionally, plants can increase the intrinsic root conductivity (conductance per length) by, for example, increasing the amount of active aquaporins (Johnson et al., 2014; McLean et al., 2011).
While in deeper, wetter layers, increasing the root conductance is a reasonable strategy for an effective water usage, it might be the other way around in upper, drier soil layers. Unregulated water uptake from drying soil can result in a severe water depletion zone around the roots, strongly reduce the local soil conductivity, and thus restrict water flow from the bulk soil towards the roots (Carminati & Javaux, 2020). The drop of the local soil conductivity scales with the water potential of the bulk soil and the water uptake rate per unit root length. Therefore, locally decreasing root conductance, and thus water uptake rates, in drier soil layers might be beneficial to avoid an interruption of the hydraulic pathway between remaining water in the bulk soil and the root surface. Mechanisms like enhanced root suberization (Barrios-Masias et al., 2015; Cruz et al., 1992; Lo Gullo et al., 1998; North & Nobel, 1991), or reducing the amount of open aquaporins (Martre et al., 2001; Rodríguez-Gamir et al., 2019) enable plants to reduce root hydraulic conductance during droughts.
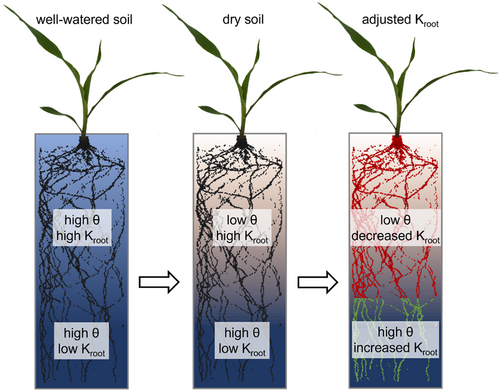
Following these considerations, we analyzed how previously measured changes in the total root system conductance (Müllers, Postma, Poorter, & van Dusschoten, 2022) are distributed over depth. Although this spatial aspect is highly relevant for the plant water balance, it has been poorly investigated. The few studies measuring a spatial component of soil drying-induced alterations of root hydraulic traits used single roots, sampled at different depths (Johnson et al., 2014; Wan et al., 1994). Additional information comes from studies on partial root zone drying in which root hydraulic traits were either measured on single, sampled roots (McLean et al., 2011) or entire root systems divided into halves (Hu et al., 2011). These studies generally suggest that the conductance of roots in rather wet soil increases relatively to that of roots in rather dry soil. However, how the full vertical distributions of root hydraulic conductance change in response to soil drying is unknown, probably due to limitations in the available measurement technologies. Here, we used a recently developed, highly precise soil water sensor, called soil water profiler (SWaP; van Dusschoten et al., 2020), to noninvasively measure root water uptake profiles which reflect the distribution of root hydraulic conductance. We hypothesize that the root conductance decreases in upper soil layers while it increases in deeper layers as an early response to soil drying by means of active regulation by the plant. Such a response would reduce water stress by facilitating deep water usage and sustaining a hydraulic connection to remaining water resources in drier layers. In Figure 1, the hypothesized effect of soil drying on the spatial distribution of root conductance is summarized. The hypothesis was tested on pot-grown faba bean and maize plants during 4 days of soil drying. These two species were chosen because they differ in root system architecture, and water uptake rates per unit root length. Faba bean has a taproot system with comparably great water uptake rates per unit root length, whereas maize has a fibrous root system with comparably low water uptake rates per unit root length. Both factors potentially affect the distribution of remaining soil water under drought, and thus the resulting alterations of the local root conductance.
2 MATERIALS AND METHODS
Data used in this study were obtained during an experiment described previously in Müllers, Postma, Poorter, and van Dusschoten (2022). Below, we shortly summarize the experimental design and explain the determination of the distribution of root conductance and root length in more detail.
2.1 Experimental design
We germinated seeds of faba bean (Vicia faba, n = 10) and maize (Zea mays, n = 10), and transferred them into soil-filled PVC pipes (80% of a loamy sand collected in Kaldenkirchen, Germany (Pohlmeier et al., 2009), mixed with 20% coarse sand). PVC pipes had an inner diameter of 8.1 cm and were filled to a height of 45 cm resulting in 2.32 L of soil substrate at a bulk dry density of 1.47 kg L−1. Plants were grown in a climate chamber at a constant temperature of 21.5 ± 0.2°C and a VPDair of 1.49 kPa. We used a water-cooled LED panel (3200 K, 5 × 5 LEDs á 20 W) for controlled illumination of the plants. Light intensity alternated between a higher (1000 µmol m−2 s−1) and lower level (500 µmol m−2 s−1) in periods of 2 h. Each day, four high and three low light periods were applied resulting in a total of 14 h illumination and a daily light integral of 39.6 mol m−2 day−1. The alternating light levels were required to determine root water uptake profiles as described below. Plants were regularly watered from the top to keep the average volumetric soil water content around 20%. For fertilization, once a week an NPK nutrient salt (Hakaphos Red; Compo Expert; 8% N, 12% P, 24% K), was diluted in water at 0.3% (v/v) and used for watering. At an age between 4 and 5 weeks (thereby selecting for similar total plant water uptake rates), plants were imaged with MRI and then placed into the SWaP for continuous measurement of soil water profiles. From that moment onwards, plants were not watered anymore. Simultaneously, leaf water potential was continuously measured with a psychrometer (ICT International). After 4 days, plants were imaged with MRI again.
2.2 Determining the normalized distribution of plant-driven root water uptake rates
For the following analysis, we interpret the 45 cm high soil columns with roots as 45 vertically stacked layers of 1 cm height. Layers are numbered with i = 1, …, 45 from top to bottom. Upper boundary of each layer is at depth zi = 0, …, 44 cm. The volumetric soil water content (θ(zi)) in each layer was measured with the so-called SWaP (van Dusschoten et al., 2020). The SWaP is sensitive for the permittivity of the soil which is determined by θ. Using a calibration curve, values measured with the SWaP were converted to the local θ(zi). Sensors of the SWaP were automatically moved along the pots with soil columns, which allowed for measuring θ-profiles in equidistant vertical steps of 1 cm every 15 min. The SWaP measurements and required data processing, is explained in more detail by van Dusschoten et al. (2020), and Müllers, Postma, Poorter, Kochs, et al. (2022).
In Equation (3) we used the normalized plant-driven root water uptake distribution ( with and the total pot volume V. Given a data set with varying Utot, , according to Equation (3), can be derived by a linear regression between and Utot if variations in Utot and SR are independent. Decoupling of variation in Utot and SR is achieved by the fluctuating light intensity in periods of 2 h. Assuming that changes in the soil water distribution are negligible on short time scales, a change in light intensity causes a rapid response in Utot without affecting SR. Thus, for data measured during a fluctuating light intensity, the slope of (Utot) is . Since is determined by the distribution of root conductance, this can be understood as follows: The greater the root conductance in a specific soil layer, the greater the change in the local soil water depletion rate induced by a change in transpiration rate. The linear regression, and thus determination of , was performed at each day separately, covering data from 12 h of alternating light. Supporting Information: Figure 1 shows the process of deriving profiles from the SWaP data for an exemplary maize plant at Day 1 and Day 4 of the soil drying period.
2.3 Determining the distribution of soil water potential
The soil matric potential (h) was calculated from θ values measured with the SWaP, using a water retention curve, fitted with a Brooks–Corey model. This water retention curve has been reported in Müllers, Postma, Poorter, and van Dusschoten (2022). To obtain the distribution of soil water potential (Ψsoil), h was corrected for gravity.
| Term | Meaning | Unit |
|---|---|---|
| h | Soil matric potential | cm H2O |
| Kcomp | Compensatory root water uptake conductance | mL h−1 MPa−1 |
| kh | Soil hydraulic conductivity | cm h−1 |
| Kroot | Radial root conductance | mL h−1 MPa−1 |
| kroot | Radial root conductivity | mL h−1 MPa−1 m−1 |
| Ksat | Soil hydraulic conductivity at water saturation | cm h−1 |
| KSL | Hydraulic conductance between soil and leaf | mL h−1 MPa−1 |
| Ksoil | Soil hydraulic conductance | mL h−1 MPa−1 |
| KSR | Local soil-root conductance | mL h−1 MPa−1 |
| KSR, tot | Total conductance of the soil-root system | mL h−1 MPa−1 |
| L | Root length | m |
| r0 | Root radius | cm |
| rb | Radial distance from the root centre defining the start of the bulk soil | cm |
| RWU | Root water uptake rate | mL h−1 |
| SWaP | Soil water profiler | |
| UP | Plant-driven root water uptake distribution with depth | mL cm−3 h−1 |
| Normalized plant-driven root water uptake distribution with depth | ||
| US | Soil driven root water uptake redistribution | mL cm−3 h−1 |
| US′ | Hypothetical US for assuming no local increases in Kroot | mL cm−3 h−1 |
| Utot | Total root water uptake rate | mL h−1 |
| V | Soil volume | cm3 |
| zi | Depth of soil layer i | cm |
| α | Inverse of the air entry pressure | cm H2O −1 |
| θ | Volumetric soil water content | % |
| Soil water depletion rate | mL cm−3 h−1 | |
| λb | Dimensionless pore size index of the Brooks–Corey model | |
| τ | Brooks–Corey parameter with τ = −2–3 λb | |
| φ | Matrix flux potential | cm2 h−1 |
| Ψcollar | Water potential at the plant collar | MPa |
| Ψleaf | Leaf water potential | MPa |
| Ψsoil | Water potential in the bulk soil | MPa |
| Ψseq | Equivalent soil water potential | MPa |
| Ψsr | Water potential at the soil-root interface | MPa |
2.4 Determining the distribution of root hydraulic conductance
| Faba bean | Maize | |||
|---|---|---|---|---|
| Day | Utot (mL h−1) | Ψleaf (MPa) | Utot (mL h−1) | Ψleaf (MPa) |
| 1 | 4.85 ± 0.41a | −0.62 ± 0.05a | 4.09 ± 0.58a | −0.55 ± 0.05a |
| 2 | 3.75 ± 0.70a | −0.76 ± 0.04b | 3.94 ± 0.77a | −0.64 ± 0.14a |
| 3 | 2.47 ± 0.42b | −0.93 ± 0.07b | 3.51 ± 0.54ab | −0.71 ± 0.17a |
| 4 | 1.64 ± 0.31c | −1.11 ± 0.09c | 3.10 ± 0.43b | −1.05 ± 0.19b |
| Faba bean | Maize | |||
|---|---|---|---|---|
| Day | Ψseq (MPa) | KSL (mL h−1 MPa−1) | Ψseq (MPa) | KSL (mL h−1 MPa−1) |
| 1 | −0.02 ± 0.01a | 8.27 ± 1.12a | −0.02 ± 0.00a | 8.73 ± 4.07a |
| 2 | −0.04 ± 0.01b | 5.15 ± 1.30b | −0.03 ± 0.01b | 6.55 ± 2.43a |
| 3 | −0.08 ± 0.02c | 2.87 ± 0.56c | −0.05 ± 0.01c | 5.67 ± 2.21ab |
| 4 | −0.12 ± 0.03d | 1.57 ± 0.37d | −0.07 ± 0.03c | 3.34 ± 1.45b |
- Note: Values are species medians with median absolute deviations.
Supporting Information: Appendix 1 also provides a more detailed discussion in Supporting Information: Figure 3 and the resulting conclusions.
2.5 Determining the distribution of root length and root conductivity
In layers with both, small conductance and small root length this calculation can lead to erratic results. Therefore, for determination of kroot, we neglected soil layers with few roots (root length <1 cm) or root conductance <0.001 mL−1 h MPa−1.
2.6 Statistical analysis
3 RESULTS
Withholding water for 4 days resulted in a progressive, significant reduction in both the soil water content () and soil water potential () averaged over depth (Table 3). For both species, decreased from 16 mL cm−3 at Day 1 to 8 mL cm−3 at Day 4. decreased from −0.01 MPa at Day 1 to −0.09 MPa (faba bean), and −0.07 MPa (maize) respectively, at Day 4.
| Faba bean | Maize | |||
|---|---|---|---|---|
| Day | (%) | (MPa) | (%) | (MPa) |
| 1 | 16.1 ± 2.0a | −0.01 ± 0.00a | 16.0 ± 2.0a | −0.01 ± 0.00a |
| 2 | 12.9 ± 1.2b | −0.03 ± 0.01b | 13.4 ± 2.5b | −0.02 ± 0.01b |
| 3 | 9.9 ± 1.2c | −0.06 ± 0.01c | 10.7 ± 2.0c | −0.04 ± 0.01c |
| 4 | 8.0 ± 1.2d | −0.09 ± 0.03d | 7.8 ± 1.9d | −0.07 ± 0.03d |
- Note: Values are species medians with median absolute deviation. For each species separately, we tested for significant changes of each parameter among the 4 days using Wilcoxon rank tests. Different letters indicate significantly different values (p < 0.05).
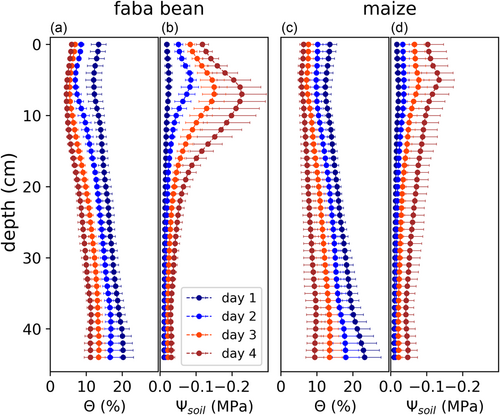
Figure 2 shows how these reductions were distributed over depth. At Day 1 after withholding water, for both species, there was a vertical gradient in θ with drier soil layers in the top and wetter layers in the bottom (Figure 2a,c). θ ranged from 12 mL cm−3 (at 5 cm depth) to 20 mL cm−3 (44 cm) for faba bean and from 12 mL cm−3 (6 cm) to 23 mL cm−3 (44 cm) for maize (Table 4). In each individual soil layer, θ was significantly (p < 0.01) reduced from each day towards the next one for both species. At Day 4, θ ranged from 5 mL cm−3 (7 cm) to 11 mL cm−3 (38) cm for faba bean and from 5 mL cm−3 (5 cm) to 10 mL cm−3 (38 cm) for maize. Like θ, Ψsoil in each individual soil layer decreased significantly (p < 0.01) from each to the next day for both species (Figure 2b,d). At Day 1, Ψsoil was almost uniformly distributed, with only a slight vertical gradient (around −0.02 MPa in the upper half of the pot, and −0.01 MPa in the lower half for both species). However, proceeding soil drying led to an increase in the vertical gradient: At Day 4, Ψsoil ranged from −0.23 MPa (at 7 cm depth) to −0.03 MPa (38 cm) for faba bean, and from −0.14 MPa (5 cm) to −0.04 MPa (38 cm) for maize. In conclusion, although the vertical gradient in θ even decreased during soil drying, the gradient in Ψsoil increased strongly. This is due to the nonlinear character of the water retention curve: in the dry regime, a small reduction in θ causes a strong reduction in Ψsoil.
| Faba bean | Maize | |||
|---|---|---|---|---|
| Day | θmin (%) | θmax (%) | θmin (%) | θmax (%) |
| 1 | 12.0 ± 3.1a | 20.3 ± 4.0a | 12.4 ± 2.1a | 23.3 ± 6.8a |
| 2 | 6.9 ± 1.2b | 16.8 ± 3.2b | 9.7 ± 2.9b | 18.0 ± 5.1b |
| 3 | 5.4 ± 0.7c | 13.9 ± 1.7c | 6.8 ± 1.9c | 13.7 ± 4.3c |
| 4 | 4.5 ± 0.7d | 11.4 ± 2.0d | 5.4 ± 1.6d | 9.8 ± 3.1d |
| Faba bean | Maize | |||
|---|---|---|---|---|
| Day | Ψsoil, min (MPa) | Ψsoil, max (MPa) | Ψsoil, min (MPa) | Ψsoil, max (MPa) |
| 1 | −0.02 ± 0.01a | −0.01 ± 0.00a | −0.02 ± 0.01a | −0.01 ± 0.00a |
| 2 | −0.09 ± 0.03b | −0.01 ± 0.00b | −0.04 ± 0.02b | −0.01 ± 0.01b |
| 3 | −0.15 ± 0.05c | −0.02 ± 0.00c | −0.09 ± 0.05c | −0.02 ± 0.01c |
| 4 | −0.23 ± 0.08d | −0.03 ± 0.01d | −0.14 ± 0.10d | −0.04 ± 0.03d |
- Note: Values are species medians with median absolute deviation. For each species separately, we tested for significant changes of each parameter among the 4 days using Wilcoxon rank tests. Different letters indicate significantly different values (p < 0.05).
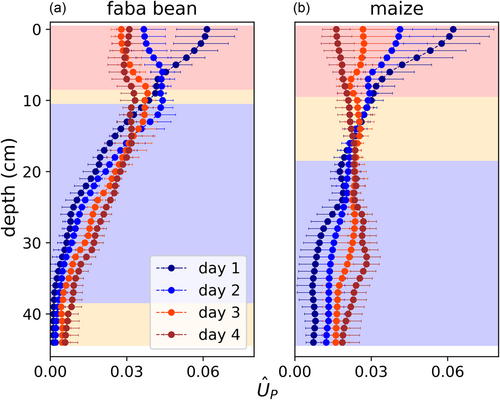
In the next step, we analyzed how the changes in Ψsoil affected root water uptake patterns measured as the normalized plant-driven root water uptake distributions (), using the SWaP. At Day 1, for both species there was a vertical gradient in with greater values in upper soil layers and lower values in deeper layers (Figure 3). was not constant over time: Generally, decreased in the drier, upper soil layers, while it increased in relatively wetter, deeper layers. For the parameters described below, in deeper layers we observed a consistent trend from Days 1 to 3, reversing from Days 3 to 4. Therefore, we primarily tested for significant differences between Days 1 and 3. As indicated by a different background colour in Figure 3, we observed the following significant changes: For faba bean, decreased in the top 8 cm (p < 0.01) and increased between 11 and 38 cm depth (p < 0.05 at 11–13 cm depth, <0.01 at 13–38 cm depth). For maize, decreased in the top 10 cm (p < 0.05 at 10 cm depth, <0.001 else) and increased below 20 cm depth (p < 0.05 at 20–23 cm depth, <0.01 below).
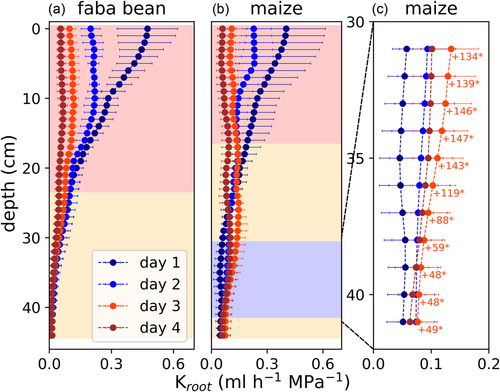
Alterations of are caused by a shift in the distribution of root hydraulic conductance (Kroot). To derive the distribution of Kroot over depth, we multiplied the daily average of the total conductance, as determined in a previous study (Müllers, Postma, Poorter, & van Dusschoten, 2022) (Table 2), with the daily , according to Equation (5). The total conductance at the 1st day was similar for faba bean and maize (8–9 mL h−1 MPa−1 Table 2). At Day 1, for both species, there was a vertical gradient in Kroot with greater values in upper soil layers (54% in the upper 10 cm for faba bean, 47% for maize) and lower values in the bottom (13% in the bottom half for faba bean, 21% for maize) (Figure 4). Withholding water for 4 days resulted in a strong reduction of Kroot in upper soil layers with more negative Ψsoil: For faba bean, Kroot significantly decreased from Days 1 to 3 in the entire upper half of the pot (p < 0.01) by, on average, 72% (Figure 4a). In the lower half, Kroot did not change significantly. For maize, Kroot significantly decreased from Days 1 to 3 in the upper 16 cm of the pot (p < 0.01 above 12 cm depth, <0.05 else) by, on average, 66% (Figure 4b). However, between a depth of 31 and 41 cm, Kroot increased significantly (p < 0.01 at 35–37 cm depth, <0.05 else) by, on average, 107% (Figure 4c). With proceeding soil drying from Days 3 to 4, Kroot decreased again in these layers, such that it was not significantly different compared with Day 1.
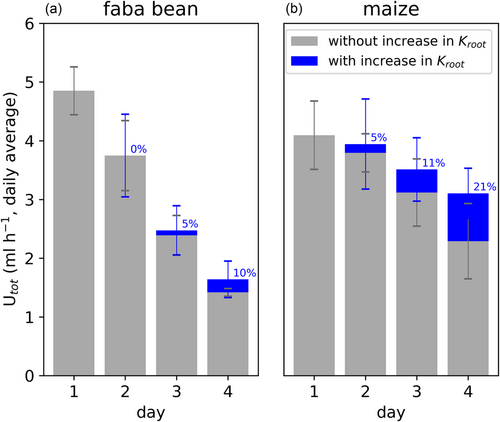
The temporarily increased Kroot in deeper parts of the maize root systems supports the uptake of deep soil water resources. We estimated the relevance of this facilitated deep water uptake by calculating how much it contributed to the total root water uptake (Figure 5). For maize, the measured increases in Kroot contributed 5% to the total root water uptake rate at Day 2, 11% at Day 3, and 21% at Day 4. In different words, without the enhanced Kroot, only 80% of the measured water uptake rate might have been realized at Day 4. Note that the hypothetical uptake rates (grey bars in Figure 5) were calculated by setting all measured increases in Kroot to zero and assuming that this would not affect the leaf water potential, implying a strict stomatal control of the plant water status. More realistically, a lack of the increases in Kroot would not be fully reflected in a reduction in total water uptake rate, but also partially in leaf water potential. However, mitigation of both, the drop in total root water uptake rate and in leaf water potential comes with reduced plant water stress. For faba bean, measured increases in Kroot at each day contributed significantly less to the total root water uptake rate compared with maize (p < 0.05).
The determination of Kroot, along with the associated increases in deeper layers for maize (Figures 4 and 5), are based on a correct separation of UP and US by the SWaP measurements (Equations 1-3). Otherwise, the local increases might also be explained by an altered soil water distribution and the resulting compensated root water uptake. Although theoretically, UP and US were separated using the fluctuating light intensity, we evaluated the potential effect of compensated root water uptake on UP by comparing the changes in UP and US between Days 1 and 3 in deeper layers for maize (Supporting Information: Appendix 2 and Figure 4). Below 20 cm depth, the measured UP increased between Days 1 and 3 (Supporting Information: Figure 4A,D). Below 30 cm depth, this increase was of the order of 0.2 mL h−1 (Supporting Information: Figure 4C,F). At the same time, the estimated US also increased in these layers (Supporting Information: Figure 4B,E) indicating enhanced compensated root water uptake. However, US at Day 3 was only of the order of 0.02 m h−1, and thus a factor 10 smaller than the increase in UP. Calculation of US assuming no local increases in Kroot (US′, see Supporting Information: Appendix 2) gave even smaller values (Supporting Information: Figure 4B,E). In conclusion, even if UP and US were not separated correctly by our approach, contribution of US to the increased UP in deeper layers was marginal, such that the increase in Kroot (Figures 4 and 5) remained.
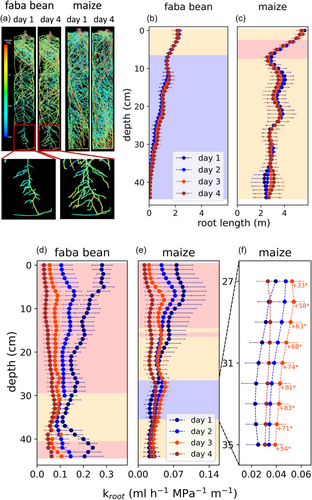
We analyzed whether the locally enhanced Kroot in maize was caused by additional root growth or an increase in root conductivity (conductance per length, kroot). Root length distributions at each day were derived from MRI images before and after the 4 days, making use of exponentially interpolating the data (Figure 6a–c). Then we derived kroot profiles at each day by dividing Kroot by the root length distributions (Figure 6d–f). Initially, faba bean roots had a much greater conductivity (0.19 mL h−1 MPa−1 m−1 on average over depth) than maize roots (0.05 mL h−1 MPa−1 m−1 on average over depth). Like for the other parameters analyzed above, at Day 1, there was a vertical gradient in kroot. Shallow roots of both species had a greater conductivity than deeper roots. Withholding water for 4 days resulted in a decreasing kroot of shallow roots, in the faster drying, upper soil layers. In faba bean, kroot decreased significantly from Days 1 to 3 in the upper 29 cm of the pot (p < 0.01) by, on average, 76% (Figure 6d). Below 30 cm, kroot remained mostly constant. In maize, kroot decreased significantly from Days 1 to 3 in the upper 15 cm of the pot (p < 0.01 above 12 cm depth, <0.05 else) by, on average, 66% (Figure 6e). Between a depth of 27 and 35 cm, however, kroot increased significantly (p < 0.05) by up to 81% (Figure 6f). Like Kroot, kroot from Days 3 to 4 decreased again in these layers. Distributions of kroot for each individual maize plant during the 4 days are shown in Supporting Information: Figure 5. For each plant, there were local increases in kroot, indicated by green dots, during the 4 days. The depth and day at which these increases occurred, however, varied strongly among the different replicates, causing the limited significance observed in Figure 6e. Using Equations (8-10), we calculated how much changes in root length, and kroot contributed to the significantly increased Kroot at 31–41 cm depth for maize (Table 5). In each of these soil layers, the increase in Kroot was primarily caused by an increase in kroot (relative contribution >0.75 in 8 out of 10 layers). Note that in some layers, root length even decreased slightly, causing the negative values for the contribution of root length and values >1 for the contribution of root conductivity in Table 5.
| Depth (cm) | Relative contribution root length | Relative contribution conductivity |
|---|---|---|
| 31 | −0.09 ± 0.31 | 1.09 ± 0.31 |
| 32 | −0.05 ± 0.39 | 1.05 ± 0.39 |
| 33 | −0.02 ± 0.48 | 1.02 ± 0.48 |
| 34 | −0.00 ± 0.49 | 1.00 ± 0.49 |
| 35 | 0.08 ± 0.45 | 0.92 ± 0.45 |
| 36 | 0.38 ± 0.40 | 0.62 ± 0.40 |
| 37 | 0.41 ± 0.44 | 0.59 ± 0.44 |
| 38 | 0.22 ± 0.40 | 0.78 ± 0.40 |
| 39 | 0.15 ± 0.50 | 0.85 ± 0.50 |
| 40 | 0.20 ± 0.54 | 0.80 ± 0.54 |
| 41 | 0.24 ± 0.56 | 0.76 ± 0.56 |
- Note: Data were calculated using the log-transformed differences between Days 1 and 3. Values are median values with median absolute deviations. Values <0 for the contribution of root length (and >1 for the contribution of conductivity) are caused by a decrease in root length between the two points in time.
4 DISCUSSION
The spatial distributions of root hydraulic traits and how they are affected by soil drying has important implications for the plant water balance. The strong reduction of soil water potential in upper soil layers led to a significant reduction of the local root hydraulic conductance. In maize, this was partly compensated by an increased conductivity (conductance per length) in deep roots. This enabled plants to maintain an estimated 20% greater total water uptake rate compared with a scenario without local increases in root conductance.
Initially, root conductance in upper soil layers was much greater (87% in upper half of the pot for faba bean, 79% for maize) than in deeper soil layers (Figure 4). This is typical for well-watered conditions since shallow roots are usually more abundant (Haberle & Svoboda, 2015; Kemper et al., 2020; Righes, 1980) and more conductive than deeper roots (Dara et al., 2015; Müllers, Postma, Poorter, Kochs, et al., 2022; Zarebanadkouki et al., 2013). Consequently, withholding water resulted in a considerable vertical gradient in soil water potential with more negative values in the top and less negative values in the bottom (Figure 2). In response to soil drying, we observed a significant decrease in Kroot in upper, relatively dry soil layers for both species (Figure 4). One plausible reason for this decrease is a partial loss of soil root contact due to root shrinkage, which was shown to be initiated at a soil water potential of around −0.02 MPa for faba bean (Koebernick et al., 2018) and maize (Duddek et al., 2022). Therefore, in upper soil layers, the relatively low (more negative) Ψsoil might have induced root shrinkage in our study, resulting in the observed reduction in Kroot, whereas in deeper layers, Ψsoil was still sufficiently high (less negative). Nevertheless, the critical Ψsoil at which we observed significant reductions in Kroot was around −0.04 MPa (compare Figures 2 and 4), and thus slightly more negative than reported by the two studies mentioned above. Besides a loss of soil-root contact, Kroot can also decrease due to enhanced root suberization and reducing the amount of active aquaporins, two mechanisms which are under biological control of the plant. Soil drying reportedly led to a decreased expression of aquaporin genes in shallow roots (Johnson et al., 2014), and an enhanced suberization of, especially, basal root parts (Kreszies et al., 2019) which predominantly reside in the top soil. Both processes might have contributed to the observed reduction in Kroot in upper soil layers (Figure 4).
We assumed that the soil conductance was much greater than the root conductance to approximate Kroot by KSL (Equations 4-6 and 5). Estimations of Ksoil (Supporting Information: Appendix 1) showed that this approximation was justified for a large part of the measurement (Supporting Information: Figure 3). Only in upper soil layers for faba bean at Day 4, Ksoil was of the same order of magnitude as Kroot (Supporting Information: Figure 3I). There, up to 8% of the decline in Kroot from Days 3 to 4 as shown in Figure 4 were caused by a reduction in Ksoil. Nevertheless, this effect was of minor importance, as Kroot was already reduced by 72% on average between Days 1 and 3 in the upper half of the pot.
Theoretically, unregulated water uptake from drying soils can lead to steep water potential gradients in the soil around roots and thus interrupt the hydraulic pathway from the bulk soil towards the roots, and force stomatal closure (Carminati & Javaux, 2020). Our estimations of the water potential at the root surface (Supporting Information: Figure 3A,C) emphasize that such a severe water depletion zone did not occur during the measurements presented here. Most likely, the early local reduction in Kroot, due to the mechanisms discussed above, and the resulting stomatal closure, could prevent an incisive drop in the local Ksoil. These conclusions on the effect of Ksoil initially apply only to the soil type used in this study, a loamy sand. In this context, a recent study showed that the total conductance between soil and plant decreased at a less negative Ψsoil in a sandy soil compared with loamy soil, probably because the loamy soil sustained a greater conductivity at a given Ψsoil (Cai et al., 2022). Additionally, the effect of a reduced soil-root contact depends on soil texture, and might be more pronounced in the loamy sand used here, compared with a sandy soil (Carminati et al., 2009).
Despite the potential benefit of preventing a severe water depletion zone around the roots, the strong reduction in Kroot in upper soil layers (76% reduction in faba bean, 66% reduction in maize [Figure 4]) comes with different impairments for the plant: A reduction in Kroot hampers the hydraulic redistribution of soil water from relatively wetter towards relatively drier soil layers through the roots (Neumann & Cardon, 2012). Moreover, as demonstrated in a previous study, the reduction in Kroot amplifies the drop in plant water potential (Müllers, Postma, Poorter, & van Dusschoten, 2022). One possibility to partly compensate for this is deep-water uptake. Up until Day 3, water in the bottom third of the pots was much easier to access (Ψsoil less negative than −0.03 MPa) than water in shallow soil layers (Ψsoil locally as low as −0.15 MPa [faba bean] and −0.08 MPa [maize] [Figure 2]). However, in agreement with other studies (Clément et al., 2022; Dara et al., 2015; Zarebanadkouki et al., 2013), effectively taking up deep water was initially limited by a low local Kroot (Figure 4). With proceeding soil drying, maize, but not faba bean was able to significantly increase Kroot in deeper, comparably wet soil layers. The deep-water uptake, facilitated in this way, contributed up to 20% to the total root water uptake rate in maize (Figure 5) and thus, at least temporarily, alleviated the drop in plant water potential.
Deep-water uptake under drought can increase due to a local increase in root conductance, but also due to compensated root water uptake, quantified as US. This happens when the local Ψsoil drops less than the global Ψseq which was the case in deeper soil layers in our study (compare Figure 2 and Table 2). Theoretically, we had separated UP and US using the fluctuating light intensity which, on short time scales, only changes UP but not US. To not fully rely on the success of this separation, we additionally estimated which impact it had for our conclusions on Kroot if compensated water uptake had influenced the measured UP (Supporting Information: Appendix 2). Since the estimated US at Day 3 in deeper layers in maize was a factor 10 smaller than the measured increase in UP (Supporting Information: Figure 4), we conclude that the measured local increases in Kroot largely remained, even if the separation of UP and US had failed.
Normalization by root length indicated that the increase in Kroot was mainly caused by a significantly increased root conductivity (conductance per length) (Figure 6). One potential reason for this phenomenon is directed, enhanced aquaporin gene expression, as observed by Johnson et al. (2014) or McLean et al. (2011). By relating empirical data on Ψsoil, ABA concentration in roots, and its impact on aquaporin expression, Couvreur et al. (2015) estimated a 250% increase in kroot between a local Ψsoil of −0.005 and −0.1 MPa. This effect would lead to a net increase in kroot as long as it is not outweighed by a reduced soil-root contact and other forementioned processes reducing kroot. The fact that increases in kroot only occurred above a Ψsoil of −0.04 MPa in our study (compare Figures 2 and 6e,f) fits these considerations. Furthermore, the different abilities of faba bean and maize to increase Kroot might be explained by root aquaporin regulation as well: Under nonstressed conditions, radial water uptake in bean occurs predominantly via the cell-to-cell pathway, mediated by aquaporins, whereas in maize, the apoplastic pathway contributes considerably (Javot & Maurel, 2002; Steudle & Brinckmann, 1989; Steudle & Frensch, 1989). This fits the initially greater conductivity of faba bean roots compared to maize roots (Figure 6a,b at Day 1). To compensate this, maize had a greater root length (Figure 6b,c), thus achieving a similar initial conductance (compare Figure 4a and 4b at Day 1) with a greater flexibility and potential for local increases via a facilitated cell-to-cell water transport.
However, the observed increase in kroot could have also been caused by xylem maturation. As summarized by M. McCully (1995), maturation of the late metaxylem can occur far behind the root tip (up to 10–50 cm) for various species, including maize (St. Aubin et al., 1986) and soybean (M.E. McCully, 1994). Since maturation of the metaxylem results in an increase in axial conductivity, the measured increase in kroot in maize possibly reflects the development of xylem vessels. This would imply that the axial conductivity had initially limited root water uptake in deeper soil layers, as suggested by previous studies (Clément et al., 2022; Sanderson et al., 1988; Strock et al., 2021). However, the strong increase in local kroot (up to 82%) indicates a simultaneous response of all roots of various growth stages within the respective soil layers, rather than a continuous developmental process. Additionally, Steudle & Peterson (1998) reported for maize that even though the late metaxylem is not fully developed within 25 cm from the root tip, axial conductance is orders of magnitude greater than radial conductance, except for a small apical region without developed early metaxylem. We conclude that an increased amount of active aquaporins is a plausible explanation for the measured local increases in kroot, which could have been enhanced by other mechanisms, such as xylem development.
5 CONCLUSION
We analyzed the effect of soil drying on vertical profiles of root hydraulic conductance in faba bean and maize. Withholding water for 4 days resulted in a pronounced vertical gradient in soil water potential with drier layers in the top and wetter layers in the bottom. In drier, shallow soil layers, the reduced soil water potential caused a strong decrease in root conductance, which on the one hand prevented a severe drop in soil hydraulic conductivity around the roots, on the other hand amplified water stress and forced stomatal closure. To partly compensate for this, maize, in contrast to faba bean, was able to facilitate deep water uptake by locally increasing its root conductivity. This increase improved the overall water uptake rate, and thus is an effective plant strategy to reduce water stress during soil drying.
ACKNOWLEDGEMENTS
This study was institutionally funded by the Helmholtz Association, Germany – POF4-899. Open access was partly funded by the Deutsche Forschungsgemeinschaft (DFG, German Research Foundation) − 491111487. Open Access funding enabled and organized by Projekt DEAL.
Open Research
DATA AVAILABILITY STATEMENT
The data are available on request from the corresponding author, Dagmar van Dusschoten.


