Increased let-7d-5p in non-alcoholic fatty liver promotes insulin resistance and is a potential blood biomarker for diagnosis
Jorge Infante-Menéndez and Andrea R. López-Pastor contributed equally to this work.
Almudena Gómez-Hernández and Oscar Escribano co-senior authors.
Handling Editor: Luca Valenti
Abstract
Background and Aims
The molecular mechanisms driving non-alcoholic fatty liver disease (NAFLD) are poorly understood; however, microRNAs might play a key role in these processes. We hypothesize that let-7d-5p could contribute to the pathophysiology of NAFLD and serve as a potential diagnostic biomarker.
Methods
We evaluated let-7d-5p levels and its targets in liver biopsies from a cross-sectional study including patients with NAFLD and healthy donors, and from a mouse model of NAFLD. Moreover, the induction of let-7d-5p expression by fatty acids was evaluated in vitro. Further, we overexpressed let-7d-5p in vitro to corroborate the results observed in vivo. Circulating let-7d-5p and its potential as a NAFLD biomarker was determined in isolated extracellular vesicles from human plasma by RT-qPCR.
Results
Our results demonstrate that hepatic let-7d-5p was significantly up-regulated in patients with steatosis, and this increase correlated with obesity and a decreased expression of AKT serine/threonine kinase (AKT), insulin-like growth factor 1 (IGF1), IGF-I receptor (IGF1R) and insulin receptor (INSR). These alterations were corroborated in a NAFLD mouse model. In vitro, fatty acids increased let-7d-5p expression, and its overexpression decreased AKT, IGF-IR and IR protein expression. Furthermore, let-7d-5p hindered AKT phosphorylation in vitro after insulin stimulation. Finally, circulating let-7d-5p significantly decreased in steatosis patients and receiver operating characteristic (ROC) analyses confirmed its utility as a diagnostic biomarker.
Conclusions
Our results highlight the emerging role of let-7d-5p as a potential therapeutic target for NAFLD since its overexpression impairs hepatic insulin signalling, and also, as a novel non-invasive biomarker for NAFLD diagnosis.
Abbreviations
-
- 3’-UTR
-
- 3′ untranslated region
-
- AKT
-
- protein kinase B
-
- ALT
-
- alanine aminotransferase
-
- ApoE −/−
-
- apolipoprotein E deficient
-
- AST
-
- aspartate aminotransferase
-
- BMI
-
- body mass index
-
- BSA
-
- bovine serum albumin
-
- CD63
-
- CD63 antigen
-
- EVs
-
- extracellular vesicles
-
- FBS
-
- fetal bovine serum
-
- FIB-4
-
- fibrosis-4
-
- GSK3
-
- glycogen synthase kinase 3
-
- HCC
-
- hepatocellular carcinoma
-
- HDL-Ch
-
- HDL-cholesterol
-
- HFD
-
- high-fat diet
-
- HOMA-IR
-
- homeostasis model assessment of insulin resistance
-
- IGF-I
-
- insulin-like growth factor I
-
- IGF-IR
-
- IGF-I receptor
-
- IHTG
-
- intra-hepatic triglycerides
-
- IR
-
- insulin receptor
-
- IRS-2
-
- insulin receptor substrate 2
-
- miRNAs
-
- microRNAs
-
- MTI
-
- miRNA-target Interaction
-
- NAFL
-
- non-alcoholic fatty liver
-
- NAFLD
-
- non-alcoholic fatty liver disease
-
- NAS
-
- NAFLD activity score
-
- NASH
-
- non-alcoholic steatohepatitis
-
- NL
-
- normal liver histology
-
- OA
-
- oleic acid
-
- PA
-
- palmitic acid
-
- ROC
-
- receiver operating characteristic
-
- SREBP-1c
-
- sterol regulatory element binding protein 1c
-
- STD
-
- standard diet
-
- TG
-
- triglycerides
-
- TSG101
-
- tumour susceptibility gene 101 protein
-
- WT
-
- wild type
Key points
Non-alcoholic fatty liver disease (NAFLD) is a highly prevalent disease lacking specific treatment or non-invasive diagnostic tests, which is why finding novel targets and blood parameters for its diagnosis is crucial. Herein, we describe the role of the microRNA let-7d-5p as a promoter of hepatic insulin resistance in NAFLD through the modulation of insulin signalling mediators, as well as a potential circulating biomarker for NAFLD diagnosis.
1 INTRODUCTION
Non-alcoholic fatty liver disease (NAFLD) is one of the most prevalent liver disorders worldwide and it is expected to suffer a steady increase in the near future. It is defined as steatosis in more than 5% of hepatocytes without evidence of alcohol or drug abuse, viral hepatitis or autoimmunity.1 Recently, an expert committee suggested that NAFLD should be renamed to metabolic dysfunction associated fatty liver disease (MAFLD) considering the following criteria: presence of liver steatosis with either overweight or obesity, type 2 diabetes mellitus or, in lean subjects, metabolic dysfunction.2 The progression of NAFLD is triggered by the concurrence of diverse factors, such as lipid overload in hepatocytes, inflammation, oxidative stress and dysbiosis. This disease encompasses two distinct stages: non-alcoholic fatty liver (NAFL) or benign steatosis and non-alcoholic steatohepatitis (NASH), which can later progress towards liver fibrosis, cirrhosis and, eventually, hepatocellular carcinoma (HCC). However, HCC does not necessarily rise from NASH or fibrosis.1, 3 Many aspects of its pathophysiology remain poorly understood and to date, no treatments have been approved.4 In addition, the gold standard test for differentiation between steatosis and steatohepatitis is liver biopsy.5 Therefore, it is of great need to unravel the molecular mechanisms that foster the onset and progression of NAFLD.
MiRNAs are short, non-coding, regulatory RNAs (20–25 nucleotides in length) that generally regulate gene expression post-transcriptionally by inducing mRNA degradation or blocking translation, though they can also exert a pro-translational effect in quiescent cells.6, 7 Dysregulated miRNA expression is able to trigger pathological situations6; in fact, altered expression of miRNAs is considered a hallmark in both liver diseases8 and metabolic disorders.9 Moreover, miRNAs are exported in extracellular vesicles (EVs), such as exosomes, to the bloodstream10; thus, circulating miRNAs are promising tools as diagnostic biomarkers.
The let-7 family consists, in humans, of 10 distinct members with a high sequence conservation among vertebrates.11 Their best characterized role is controlling cell proliferation and differentiation, since these miRNAs down-regulate several oncogenes.12 Lower let-7 levels have been described in 15% of human cancers, correlating with advanced stages and resistance to therapies.13 Also, let-7 miRNAs might promote malignant transformation during injury-triggered liver regeneration.14 In addition, let-7 miRNAs target many genes associated with metabolism and are associated with diseases such as type 2 diabetes mellitus.15
For this reason, we have explored the potential role of let-7d-5p in NAFLD pathophysiology and its possible use as a diagnostic biomarker. Precisely, we aimed to dilucidate if let-7d-5p expression is altered during human and experimental NAFLD, as well as the potential targets regulated by this miRNA. Moreover, we explored whether fatty acids induce let-7d-5p expression and the role that this miRNA plays in the regulation of its targets in vitro. Finally, we analysed the utility of circulating let-7d-5p levels as a non-invasive diagnostic biomarker of human NAFLD.
2 MATERIALS AND METHODS
2.1 Human subjects
This is a cross-sectional study. Individuals included in the study were subjected to a laparoscopic cholecystectomy in the Santa Cristina University Hospital (Madrid, Spain) and a liver biopsy was obtained with previous informed consent. None of the individuals included in the study were under treatment with ursodeoxycholic acid. The inclusion criteria were age between 18 and 75 years and absence of chronic liver disease different from NAFLD. Exclusion criteria included significant alcohol consumption (>20 g/day), iron overload (transferrin saturation index >55%), presence of autoantibodies and/or antibodies against hepatitis B or C viruses or human immunodeficiency virus and potentially hepatotoxic drug consumption. Liver biopsies were analysed by haematoxylin–eosin staining (Section 2.4) by an expert hepatopathologist to classify them in normal liver histology (NL, n = 21) and liver steatosis (NAFL, n = 30). Demographic, anthropometrical and plasma biochemical parameters were collected. All protocols were performed according to the directions established by the Santa Cristina University Hospital and Complutense University of Madrid Ethical Committees, as well as those established in the Declaration of Helsinki of 1975.
2.2 Mouse model of NAFLD
All animal studies were performed with the approval of the University of Texas at Austin Institutional Animal Care and Use Committee (IACUC) and in accordance with the NIH guidelines ‘Guide for Care and Use of Laboratory Animals’. Male and female apolipoprotein E deficient (ApoE−/−) mice (B6.129P2-Apoetm1Unc/J) (Jackson Laboratories, Inc., Bar Harbour, ME, USA) were fed the standard formulation Clinton/Cybulsky high-fat rodent diet with regular casein and 1.25% added cholesterol (D12108C; Research Diets, Inc., New Brunswick, NJ, USA). At 13 weeks of high-fat diet (HFD), the mice were sacrificed (n = 10 per sex), and the blood and liver were harvested (ApoE−/− HFD). As controls, we used male and female wild-type (WT) mice (C57BL/6J, n = 5 per sex) fed a standard diet (STD) for 13 weeks (WT STD). All mice were maintained on a 12-h light/dark cycle at room temperature.
2.3 Oil red O staining of liver tissue
Oil red O staining of liver sections was performed as described previously.16 The sections were mounted with aqueous mounting medium for imaging (Vector Laboratories, Burlingame, CA, USA). Images were acquired using an inverted Eclipse TE300 microscope coupled to a Digital Sight DS-U2 camera (Nikon, Tokyo, Japan).
2.4 NAFLD activity score assessment in liver tissue
To determine NAFLD severity, haematoxylin–eosin staining was performed on paraffin-embedded liver sections (4-μm thick) that were evaluated by a single-blinded clinical pathologist and the NAFLD activity score (NAS) was determined for each liver sample as described previously.17 Minimal criteria for NASH included the combined presence of grade 1 steatosis, hepatocellular ballooning and lobular inflammation.17
2.5 Cell culture
Huh7 cells were maintained in high-glucose Dulbecco's modified Eagle's medium (Cytiva, Marlborough, MA, USA) supplemented with 10% fetal bovine serum (FBS) (Gibco, Waltham, MA, USA), 100 U/mL penicillin–streptomycin (Gibco) and MycoZap (Lonza, Basel, Switzerland).
2.6 In vitro model of steatosis
Fatty acids (FA) were dissolved at a concentration of 200 mM in absolute ethanol and diluted to a final concentration of 5 mM of FA in Krebs–Ringer HEPES buffer, pH 7.4, containing 1% bovine serum albumin (BSA, ITW Reagents, Chicago, IL, USA). Cells (2 × 10⁵) were seeded in complete medium and, once attached, growth medium was replaced by stimulation medium containing 0.5% FBS, 1% BSA for 4 h. Then, cells were stimulated with either 300 μM oleic acid (OA, Sigma-Aldrich, St. Louis, MO, USA) and 200 μM palmitic acid (PA, Sigma-Aldrich)18 or 100 μM OA and 400 μM PA for 18 h.
2.7 Transfection with let-7d-5p precursors and antagonists
Huh7 cells were seeded in complete medium (1 × 10⁵ cells/well). After 24 h, cells were transfected with a let-7d-5p precursor (AM17100, PM11778) or antagonist (AM17000, AM11778) (Ambion, Austin, TX, USA) using INTERFERin® (Polyplus Transfection, Strasbourg, France) as described previously.19 To evaluate let-7d-5p-induced insulin resistance, transfected cells were serum starved for 1 h and stimulated with 10 nM insulin (Sigma-Aldrich) for 5 min.
2.8 Extracellular vesicle isolation from plasma
EVs were isolated from the plasma of the patients according to the protocol described in the total exosome isolation kit (Invitrogen, Waltham, MA, USA).
2.9 Assessment of PNPLA3 rs738409 polymorphism
The analysis of the rs738409 polymorphism was performed in genomic DNA extracted from peripheral blood as described previously20 and analysed by using the TaqMan Genotyping Master Mix (Applied Biosystems) and the corresponding TaqMan probe (Applied Biosystems) (Table S1).
2.10 RNA extraction
We isolated RNA from cultured cells and liver tissue with the miRVana miRNA isolation kit (Invitrogen) according to the manufacturer's protocol. RNA extraction from EVs and serum was carried out with the total exosome RNA and protein isolation kit (Invitrogen) according to the manufacturer's protocol.
2.11 MiRNA retrotranscription and quantitative PCR (RT-qPCR)
Reverse transcription (RT) was performed on 10 ng of miRNAs using the TaqMan™ advanced miRNA cDNA synthesis kit (Applied Biosystems, Waltham, MA, USA). MiRNA expression was determined by qPCR in a StepOnePlus™ Real-Time PCR System (Applied Biosystems) using the TaqMan Fast Advanced Master Mix (Applied Biosystems) and the corresponding TaqMan probe (Table S1). MiR-191-5p was used as an endogenous normalizer for liver and cell samples, and both miR-191-5p and miR-16-5p for plasma samples.21, 22 qPCR results were analysed as described previously.23 For human liver samples, an exploratory screening of several miRNAs was performed to identify candidates with an altered expression in NAFLD. MiRNA candidates were selected after a search considering previous bibliography and gene expression datasets from GEO database (NCBI).
2.12 Total RNA RT-qPCR
Total RNA from liver biopsies was retrotranscribed using the high-capacity cDNA synthesis kit (Applied Biosystems) and analysed by qPCR using the PowerUp™ SYBR® Green Master Mix (Applied Biosystems) and the corresponding primers (Table S2). 36B4/RPLP0 was used as an endogenous normalizer. All experiments were carried out in a StepOnePlus™ Real-Time PCR System.
2.13 Protein extraction and western blotting
Protein extraction and Western Blotting were performed as described previously.19 Primary antibodies were diluted in 0.5% (v/v) Tween 20–TBS (TTBS) at the appropriate concentrations (Table S3). Primary antibodies were detected using horseradish peroxidase-coupled anti-rabbit IgG (NA931V, GE Healthcare, Chicago, IL, USA, 1:5000) or anti-mouse IgG (NA934, GE Healthcare, 1:5000). Protein expression was normalized using β-actin as a loading control.
2.14 Oil red O staining of cultured cells
Stimulated cells were fixed with 4% formalin for 1 h, washed with 60% isopropanol and stained for 10 min with a 0.21% oil red O solution. Images were acquired as described in Section 2.3. Oil red O staining quantification was performed using IP Win32 v4.5 software (Acromag, Wixom, MI, USA).
2.15 Statistical analyses
Normally distributed variables were expressed as mean ± SEM, and non-normally distributed variables were expressed as median (25th–75th percentile). Nominal variables were expressed as n (%). Statistically significant differences between two groups were assessed using two-tailed Student's t tests or two-tailed Mann–Whitney U tests depending on normality tests. Statistically significant differences between more than two groups were assessed using a one-way ANOVA followed by a Bonferroni post hoc test. qPCR results from patients were analysed using two-tailed Student's t tests to account for the influence of the two grouping variables (liver injury and body mass index). Correlation between variables was assessed by two-tailed Spearman's r correlation analyses. Receiver operating characteristic (ROC) analyses were performed to test the diagnostic accuracy of the evaluated miRNAs. All statistical procedures were performed using the GraphPad Prism v8.2.1 software (GraphPad Software, San Diego, CA, USA).
3 RESULTS
3.1 Characteristics of the study group
The most relevant parameters of the individuals included in the study are displayed in Table 1. The NL and NAFL groups did not significantly differ in mean age, and both were composed of a higher percentage of female subjects. Circulating insulin levels were significantly higher in the NAFL group, as well as the insulin resistance indicator homeostasis model assessment of insulin resistance (HOMA-IR). In the NAFL group, TG levels were significantly higher and HDL-cholesterol (HDL-Ch) was significantly lower, indicating a trend towards dyslipidaemia. Serum alanine aminotransferase (ALT) activity was significantly higher in the NAFL group, whereas serum aspartate aminotransferase (AST) did not significantly differ between both groups. Concerning some co-morbidities commonly associated with NAFLD, only three individuals in the NAFL group and one in the NL group were diabetic, whereas only one individual in each group had evidence of cardiovascular alterations.
| NL (n = 21) | NAFL (n = 30) | |
|---|---|---|
| Age (years) | 48.33 ± 16.37 | 54.13 ± 12.86 |
| Sex | ||
| Male | 7 (33.3%) | 13 (43.3%) |
| Female | 14 (66.7%) | 17 (56.7%) |
| BMI (kg/m2) | 24.73 (22.34, 30.28) | 27.65 (25.87, 33.84) |
| Glucose (mg/dL) | 95.00 (87.50, 108.0) | 97.00 (92.75, 107.5) |
| Insulin (μU/mL) | 7.4 (5.3, 8.6) | 9.3 (7.4, 13.38)** |
| HOMA-IR | 1.6 (1.10, 2.18) | 2.70 (1.78, 3.37)* |
| TG (mg/dL) | 87.00 (66.50, 106.00) | 123.4 (101.0, 155.3)** |
| HDL-Ch (mg/dL) | 50.00 (46.00, 65.50) | 45.00 (39.75, 53.75)* |
| ALT (U/L) | 14.00 (12.00, 23.50) | 19.50 (14.75, 29.25)* |
| AST (U/L) | 17.00 (14.50, 19.00) | 17.00 (15.00, 24.25) |
| Steatosis grade, n (%) | ||
| Grade 0 | 21 (100%) | 0 (0%) |
| Grade 1 | 0 | 20 (66.7%) |
| Grade 2 | 0 | 7 (23.3%) |
| Grade 3 | 0 | 3 (10.0%) |
| Inflammation grade, n (%) | ||
| Grade 0 | 21 (100%) | 23 (76.7%) |
| Grade 1 | 0 | 7 (23.3%) |
| Grade 2 | 0 | 0 |
| Grade 3 | 0 | 0 |
| Ballooning grade, n (%) | ||
| Grade 0 | 21 (100%) | 30 (100%) |
| Grade 1 | 0 | 0 |
| Grade 2 | 0 | 0 |
| NAS, n (%) | ||
| Grade 0 | 21 (100%) | 0 |
| Grade 1 | 0 | 15 (50%) |
| Grade 2 | 0 | 11 (36.7%) |
| Grade 3 | 0 | 4 (13.3%) |
| PNPLA3 rs738409 genotype (C/G), ratio (%) | ||
| Homozygous, normal allele | 10/12 (83.3%) | 6/20 (30.0%) |
| Heterozygous | 2/12 (16.7%) | 11/20 (55.0%) |
| Homozygous, SNP | 0/12 (0%) | 3/20 (15.0%) |
- Note: Statistical significance was assessed with a two-tailed unpaired Student's t test or an unpaired Mann–Whitney U test.
- Abbreviations: ALT, alanine aminotransferase; AST, aspartate aminotransferase; BMI, body mass index; HDL-Ch, HDL-cholesterol; HOMA-IR, homeostasis model assessment of insulin resistance; NAFL, liver steatosis; NAS, NAFLD activity Score; NL, normal liver histology; SNP, single nucleotide polymorphism.; TG, triglycerides.
- * p < 0.05
- ** p < 0.01.
Regarding histological characterization (Table 1), 20 patients in the NAFL group (66.7%) exhibited grade 1 steatosis, 7 (23.3%) had grade 2 and only 3 (10%) displayed grade 3 steatosis. The majority of the NAFL patients (76.7%) showed no signs of lobular inflammation, whereas the rest (23.3%) were classified as grade 1 inflammation. None of the patients displayed hepatocyte ballooning, and thus none of the patients could be diagnosed with NASH. Therefore, 15 (50.0%) patients were assigned a NAS of 1, 11 (36.7%) had a NAS of 2, and 4 (13.3%) had a NAS of 3. Furthermore, we performed a genotyping analysis for the NAFLD risk variant rs738409 of PNPLA3,24 which was present in 2 (16.7%) individuals in the NL group in heterozygosis, and in 14 (70.0%) in the NAFL group [11 (55.0%) heterozygous, 3 (15.0%) homozygous].
3.2 Let-7d-5p expression is up-regulated in the liver of NAFL patients and correlates with clinical and anthropometric variables
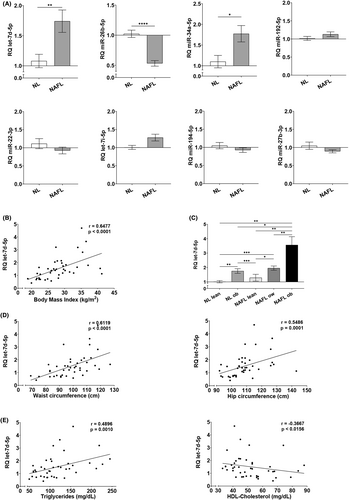
We analysed the expression of eight miRNAs in liver biopsies and found that let-7d-5p and miR-34a-5p are significantly up-regulated in the liver of our group of individuals with steatosis, whereas miR-26b-5p is significantly down-regulated (Figure 1A). Since we observed a strong positive correlation between the BMI and let-7d-5p expression in our study group (Figure 1B), we stratified the NL and NAFL groups according to the World Health Organization BMI classification criteria and found a clear overexpression of let-7d-5p in overweight and obese individuals, regardless of liver histology (Figure 1C). Moreover, correlation analyses showed that let-7d-5p levels positively and strongly correlated with the waist and hip circumference as well as circulating TG levels, whereas HDL-Ch negatively and strongly correlated to the hepatic expression of this miRNA (Figure 1D,E). No significant correlations were found between let-7d-5p expression and age, sex or ethnicity. Therefore, our results suggest a relationship between let-7d-5p dysregulation and metabolic dysfunction.
3.3 Overexpression of let-7d-5p decreases IGF-IR/IR signalling mediators in the liver of NAFL patients
Correlation analyses also showed a strong and positive correlation between let-7d-5p expression and the HOMA-IR (Figure 2A). MiRNA–target Interaction (MTI) databases showed that let-7d-5p might regulate genes involved in insulin/insulin-like growth factor I (IGF-I) signalling. Thus, we analysed the expression of these targets in the liver of NAFLD patients by qPCR. IGF1, IGF1R and INSR B were significantly down-regulated in all groups when compared to healthy, lean individuals. On the other hand, AKT expression was significantly lower in obese and overweight individuals in the NL and NAFL groups (Figure 2B). These expression profiles are consistent with the let-7d-5p up-regulation observed in NAFLD patients.
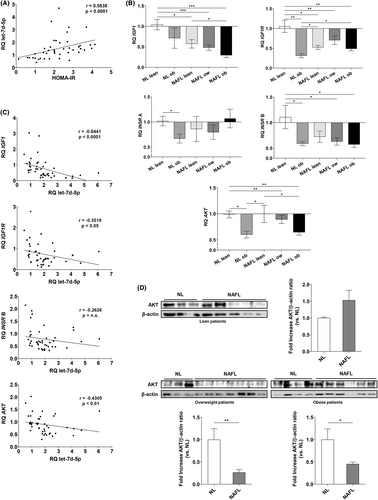
Moreover, the expression of the four studied genes showed negative correlations with let-7d-5p expression (Figure 2C). The strongest and most significant correlation was observed in the case of IGF1, though AKT and IGF1R also showed significant, moderate and negative correlations. INSR B mRNA expression also showed a trend of negative correlation with let-7d-5p levels. Furthermore, AKT levels were assessed in the liver biopsies of these patients by western blot (Figure 2D). In lean individuals with steatosis, AKT levels were slightly increased without reaching statistical significance. On the other hand, AKT protein expression was significantly lower in the liver of overweight and obese individuals who had liver steatosis.
3.4 Increased let-7d-5p and decreased insulin signalling protein expression in the liver of a NAFLD mouse model
To confirm the results obtained in patients, we used ApoE−/− mice fed a HFD as a validated murine model of NAFLD.19, 25-27 We did not observe differences in plasma TG between the two groups; however, as expected, ApoE−/− HFD mice exhibited significantly higher levels of cholesterol than WT STD mice (WT STD: 19.12 ± 2.42 mg/dL vs. ApoE−/− HFD: 210.40 ± 12.28 mg/dL, p < 0.0001). Liver histology revealed that ApoE−/− HFD mice developed NAFLD regardless of the sex (Figure 3A,B), displaying significantly higher grades of steatosis, inflammation and hepatocyte ballooning and increased NAS compared with WT STD mice (Figure 3C).
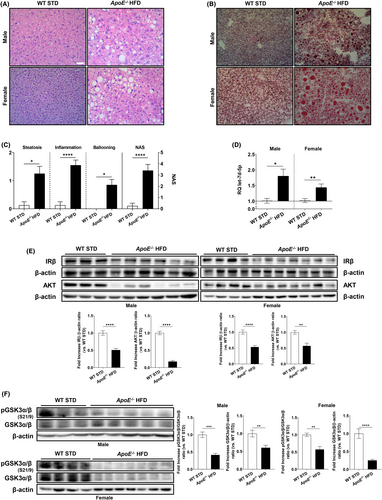
Next, when compared to sex-matched controls, let-7d-5p expression significantly increased in ApoE−/− HFD mice (Figure 3D), unrelated to vascular damage. Western blot analysis of the down-regulated let-7d-5p targets in patient samples showed that the expression of AKT and the insulin receptor (IR) significantly decreased in the liver of ApoE−/− HFD mice in a sex-independent manner (Figure 3E). Moreover, this decrease negatively correlated with the increase in let-7d-5p expression, consistent with our previous findings in NAFL clinical samples. To evaluate the subsequent insulin resistance in ApoE−/− HFD mice, we assessed the phosphorylation status of glycogen synthase kinase 3 (GSK3), which was significantly reduced in ApoE−/− HFD mice (Figure 3F). Therefore, AKT activity and insulin signalling were impaired in ApoE−/− HFD mice.
3.5 Overexpression of let-7d-5p in Huh7 cells results in insulin resistance
Since our data indicated that steatosis could induce let-7d-5p, we stimulated Huh7 cells with OA and PA and analysed its expression. We found that a combination of 100 μM OA and 400 μM PA induced a significant accumulation of lipid droplets (Figure 4A) as well as a significant increase in let-7d-5p expression (Figure 4B). These results demonstrate that in an in vitro model of lipid overload, the expression of let-7d-5p is also induced.
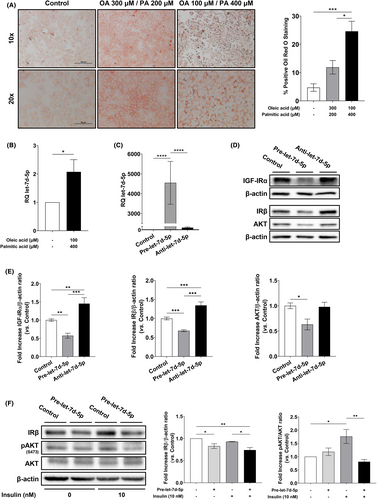
To determine whether the induction of let-7d-5p is involved in hepatic insulin resistance during NAFLD, we transfected Huh7 cells with a let-7d-5p precursor and an inhibitor. A remarkable increase in let-7d-5p expression was observed 96 h after transfection in cells transfected with the let-7d-5p precursor. Conversely, no decrease in let-7d-5p expression was observed in cells transfected with the let-7d-5p inhibitor (Figure 4C). Next, we analysed the expression of let-7d-5p targets involved in insulin signalling by western blot and found that all of the predicted targets were down-regulated in cells transfected with the let-7d-5p precursor compared to the control. As expected, we observed at least the same protein expression level in cells transfected with the miRNA inhibitor as the control. Moreover, IGF-I receptor (IGF-IR) and IR protein expression significantly increased in cells transfected with the let-7d-5p inhibitor when compared to untransfected cells (Figure 4D,E).
To investigate whether this let-7d-5p-induced down-regulation of insulin/IGF-I signalling pathway proteins could induce insulin resistance, we assessed the insulin-induced AKT phosphorylation. In non-transfected cells, we observed a statistically significant increase in AKT phosphorylation after stimulation with insulin compared to non-treated control cells. However, after let-7d-5p precursor transfection, we did not observe any increase in AKT phosphorylation following insulin treatment (Figure 4F,G), demonstrating that let-7d-5p overexpression is enough to induce insulin resistance in vitro.
3.6 Decreased circulating let-7d-5p levels as a potential biomarker in NAFLD
Finally, to evaluate the role of novel miRNAs as possible non-invasive diagnostic biomarkers for NAFLD, we isolated miRNAs from plasma EVs of individuals from the same study group. To validate that the isolated EVs from plasma could be exosomes, we determined the presence of the exosome markers CD63 antigen (CD63) and tumour susceptibility gene 101 protein (TSG101) and the absence of the Golgi vesicle marker Golgin subfamily A member 2 (GM130). We did not detect GM130 in our isolated EVs when compared to a positive control (Huh7 cell lysate), but observed CD63 and TSG101 expression in our samples (Figure 5A), suggesting that the isolated EVs could be enriched in exosomes.
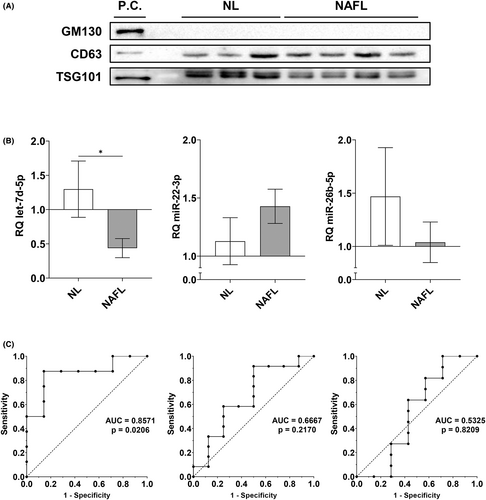
Regarding circulating miRNA expression, the only statistically significant change that we observed was a reduction of let-7d-5p in the NAFL group (Figure 5B). To evaluate its putative role as a diagnostic biomarker in NAFLD, we performed ROC analyses (Figure 5C). For this miRNA, the area under the curve was 0.8571 (p = 0.0206). The optimal cut-off value for NAFL diagnosis was 0.6461 or lower, with a sensitivity of 87.50% and a specificity of 85.71%. Moreover, circulating let-7d-5p expression negatively correlated with the increase of the NAS (r = −0.6211, p = 0.0158).
4 CONCLUSIONS
The let-7 family is an extensively studied group of miRNAs that regulate cell proliferation and differentiation, tumourigenesis and embryonic development.11, 12 Nonetheless, their involvement in NAFLD is still unknown. Here, we demonstrate that hepatic let-7d-5p expression was increased in patients with liver steatosis and in a mouse model of NAFLD.
Precisely, we have found that let-7d-5p expression in human NAFLD was strongly and positively correlated with obesity regardless of the presence of steatosis. In addition, there were strong correlations of let-7d-5p expression with insulin resistance and serum TG levels. Despite this analysis was performed in a limited number of human samples, our results in a mouse model of NAFLD are in concordance with them. According to this, Frost and Olson demonstrated that let-7d knockdown in HFD-fed mice ameliorated liver steatosis, and whole body overexpression of LIN28A, which inhibits let-7 maturation, in HFD-fed mice led to decreased hepatic steatosis.28 Therefore, the regulation of let-7d-5p expression is likely involved in steatosis development, and this miRNA could be a candidate to develop NAFL treatment strategies, even though its role in the progression to NASH remains unexplored.
The hepatic expression of let-7d-5p targets revealed that the most significant changes occurred in insulin/IGF-I signalling mediators such as IGF1, INSR, IGF1R and AKT. Moreover, their expression negatively correlated with let-7d-5p expression. This suggests that the insulin/IGF-I signalling pathway is a direct target of let-7d-5p in human NAFLD, though a bigger sample size of human samples is needed to reinforce our findings. In concordance, we demonstrate that let-7d-5p overexpression induces the down-regulation of AKT, IGF-IR and IR expression in vitro. Overall, these results imply a key role of let-7d-5p in the development of hepatic insulin resistance, an established feature of NAFLD.
The liver is the main contributor to IGF-I production in physiological conditions.29 Decreased circulating IGF-I has been consistently reported in NAFLD patients30, 31 and inversely correlates to the fibrosis-4 (FIB-4) score in patients with fibrosis,32 suggesting that liver alterations are correlated to lower circulating IGF-I levels. The primary role of reduced IGF-I as a promoter of NAFLD progression had already been suggested by Hribal et al., who described decreasing hepatic mRNA levels of IGF1 along with an increase of the fibrosis score.33 In this sense, we have reported a progressive decrease of IGF1 mRNA expression with the onset of NAFLD corresponding to the increase of its regulator, let-7d-5p. Accordingly, restoring the levels of IGF-I by the modulation of let-7d-5p could be a promising therapeutic strategy for NAFLD, especially when considering its insulin-sensitizing, anti-inflammatory and anti-apoptotic effects.29 IGF-I therapy on genetically obese (db/db), methionine–choline-deficient diet (MCD)-fed mice resulted in lower hepatic steatosis and ballooning and a decrease in the expression of Cd68, F4/80, Il1b and Il6.34
Hepatic insulin resistance is involved in the development of many metabolic abnormalities. We found that IR expression is down-regulated in hepatic samples from the mouse model and patients with NAFLD. This decrease was observed across all NAFL groups regardless of their BMI, and thus we hypothesized that this down-regulation could be related to the aggravation of hepatic insulin resistance during NAFLD. Reduced hepatic expression of IR has been reported in NASH patients.35, 36 Although IGF-IR expression in mature hepatocytes is low, hybrid receptor formation with IR has been reported in the liver.37 Through this structure, IGF-I might be able to exert its metabolic effects similar to insulin.38 Moreover, our group demonstrated that hepatic adeno-associated viral delivery of the fetal isoform of IR in mice significantly ameliorated liver steatosis and down-regulated several lipogenic genes, especially Dgat2.16 This evidence suggests that restoring normal IR expression could also serve as a potential therapeutic strategy in NAFLD. In fact, anti-let-7 treatment partially restored the expression of IR and IRS-2 in the liver of HFD-fed mice, highlighting the therapeutic potential of this miRNA.28
Our results also suggest that let-7d-5p down-regulates the hepatic expression of AKT, a key effector in the insulin/IGF-I pathway. Despite most of the studies that have been previously performed have focused on determining the activation of AKT by phosphorylation, down-regulation of AKT protein expression has been previously reported in the liver of NAFLD patients.36 Moreover, following let-7d-5p overexpression, we observed a decrease in insulin sensitivity regarding AKT phosphorylation, which is observed in the latter stages of NAFLD.36, 39 We propose let-7d-5p as a novel inductor of insulin resistance in NAFLD through the impairment of the insulin/IR/AKT axis, promoting a selective insulin resistance state leading to constitutively active lipogenesis.40
Our results indicate that circulating let-7d-5p levels are lower in patients with NAFL, and ROC analyses suggest that this miRNA might be suitable for NAFLD diagnosis. Despite the small number of human samples included in this analysis, there is evidence in the literature suggesting the potential of let-7d-5p as a biomarker. In this sense, this role has been studied in rheumatoid arthritis and hepatitis B virus-derived cirrhosis.41, 42 Decreased circulating levels of let-7 miRNAs have been reported in advanced liver fibrosis associated with hepatitis C as the disease progresses.43 Moreover, circulating let-7g levels are significantly higher in Asian individuals suffering from metabolic syndrome, and that increased levels of this miRNA correlate with a higher number of metabolic syndrome risk components.44 Our previous findings suggest that circulating let-7d-5p levels are down-regulated in the earliest stages of NAFLD.19 In the same way, Johnson et al. have reported lower circulating levels of let-7d-5p in two independent cohorts during the progression of NAFLD.45 Our study highlights the role of let-7d-5p as a novel circulating biomarker for non-invasive diagnosis of NAFLD; however, larger scale studies would be needed to provide further validation.
In conclusion, let-7d-5p could have a dual role in NAFLD management. On one hand, therapeutic approaches directed towards the hepatic restoration of let-7d-5p levels could be promising tools for NAFLD treatment since they would allow a recovery in insulin sensitivity. Not only would this strategy alleviate the underlying insulin resistance in NAFLD, but also restore the physiological liver function. On the other hand, circulating let-7d-5p levels could be a novel non-invasive biomarker for NAFLD diagnosis.
FUNDING INFORMATION
This work was supported by grants RTI-2018-095098-B100 and PID2021-123076OB-I00 from the Ministerio de Ciencia, Innovación y Universidades, AENC1/22-29754 from UCM and PR75/18-21572 from Santander-UCM given to AG-H and OE; grants PI20/00837 and PI19/00123 from Instituto de Salud Carlos III (ISCIII, Spain) and Fondo Europeo para el Desarrollo Regional (FEDER) given to CG-M and AG-R respectively. The authors gratefully acknowledge funding though the American Heart Association (17IRG33410888), the DOD CDMRP (W81XWH-16-1-0580; W81XWH-16-1-0582) and the National Institutes of Health (1R21EB023551-01; 1R21EB024147-01A1; 1R01HL141761-01) to ABB. JI-M and PG-L were funded by the Consejería de Ciencia, Universidades e Innovación from Comunidad de Madrid and the European Social Fund. None of the funding sources participated in this manuscript apart from providing the funding.
CONFLICT OF INTEREST STATEMENT
The authors declare no conflicts of interest.
ETHICS APPROVAL STATEMENT
All protocols were performed according to the directions established by the corresponding ethical committees.
PATIENT CONSENT STATEMENT
The patient samples were obtained after signing the corresponding informed consent.


