Sphingolipid inhibitor response gene GhMYB86 controls fiber elongation by regulating microtubule arrangement
Edited by: Longfu Zhu, Huazhong Agriculture University, China
ABSTRACT
Although the cell membrane and cytoskeleton play essential roles in cellular morphogenesis, the interaction between the membrane and cytoskeleton is poorly understood. Cotton fibers are extremely elongated single cells, which makes them an ideal model for studying cell development. Here, we used the sphingolipid biosynthesis inhibitor, fumonisin B1 (FB1), and found that it effectively suppressed the myeloblastosis (MYB) transcription factor GhMYB86, thereby negatively affecting fiber elongation. A direct target of GhMYB86 is GhTUB7, which encodes the tubulin protein, the major component of the microtubule cytoskeleton. Interestingly, both the overexpression of GhMYB86 and GhTUB7 caused an ectopic microtubule arrangement at the fiber tips, and then leading to shortened fibers. Moreover, we found that GhMBE2 interacted with GhMYB86 and that FB1 and reactive oxygen species induced its transport into the nucleus, thereby enhancing the promotion of GhTUB7 by GhMYB86. Overall, we established a GhMBE2-GhMYB86-GhTUB7 regulation module for fiber elongation and revealed that membrane sphingolipids affect fiber elongation by altering microtubule arrangement.
INTRODUCTION
As one of the three major systems in eukaryotic cells, the plasma membrane is a remarkably complex organization of lipids and proteins (Breslow and Weissman, 2010). Membrane lipids include, phospholipids, sphingolipids, and sterols, among which the first are the main components of the membrane lipid bilayer (Shevchenko and Simons, 2010; Oresic, 2011), while sphingolipids and sterols are enriched in membrane lipid rafts (Cacas et al., 2016). Further, the coordination of various physiological and biochemical activities taking place in the cell membrane plays a crucial role in cell growth (Xu et al., 2021). In turn, the plant cytoskeleton is a dynamic and adaptive structure composed of microtubules (MTs) and actin filaments (F-actin), that plays essential roles in cell morphogenesis (Goldy and Caillaud, 2023). Further, actin cytoskeleton dynamics drive membrane deformation and trafficking, and is required for polar cell growth and the movement of vesicles and organelles (Lian et al., 2021). Meanwhile the microtubule cytoskeleton and microtubule-associated proteins are essential for cell division and anisotropic growth (Hamant et al., 2019). The continuum between the plasma membrane and cell cytoskeleton allows the perception, integration, and propagation of both biochemical and biophysical signals indispensable for cell growth (Tang et al., 2022). However, the interplay between the plasma membrane and cytoskeleton during cell development remains largely unknown.
Cotton (Gossypium hirsutum L.) is an important natural fiber in the textile industry, accounting for approximately 35% of global annual fiber demands (Huang et al., 2021a; Zhao et al., 2023). In particular, the cotton fiber is a single-celled seed trichome that originates from the ovule epidermis, which makes it an excellent model for studying cell elongation (Huang et al., 2021a; Xu et al., 2021). The development of cotton fibers comprises five distinct but overlapping stages: initiation, elongation, transition, secondary cell wall (SCW) deposition, and maturation. Each of these stages is defined based on the number of days post-anthesis (DPA) to its occurrence (Haigler et al., 2012). Thus, fiber initiation occurs on the day of anthesis, and is followed by cell elongation, which is fastest at approximately 10 DPA, and decreases significantly after approximately 15 DPA. Subsequently, SCW deposition occurs from 15 to 40 DPA, followed by fiber maturation from 40 to 50 DPA. The elongation and SCW deposition phases of growth determine the length, strength, and fineness of the cotton fibers (Haigler et al., 2012). Based on cotton genome sequencing, much progress has been made in the study of the regulation of cotton fiber development over the last decades. Thus, for instance, the R2R3-myeloblastosis (MYB) transcription factor (TF), GhMYB25-like protein reportedly acts as a key factor in early fiber development (Walford et al., 2011). In turn, GhJAZ2 negatively regulates cotton fiber initiation by interacting with GhMYB25-like (Hu et al., 2016). Additionally, GbPDF1 plays critical roles in hydrogen peroxide homeostasis and steady biosynthesis of ethylene and pectin during fiber development (Deng et al., 2012). In turn, WLIM1a functions as an actin bundler to facilitate the elongation of fiber cells and acts as a TF that activates the expression of Phe ammonia lyase–box genes involved in phenylpropanoid biosynthesis to build up the SCW, suggesting that WLIM1a has dual roles in cotton fiber elongation and secondary wall formation (Han et al., 2013). Moreover, the cotton homeodomain-leucine zipper (HD-ZIP) TF GhHOX3 interacts with GhHD1 to promote the expression of two cell wall-loosening protein-encoding genes, namely, GhRDL1 and GhEXPA1, and then leading to increased fiber length (Shan et al., 2014). Calcium sensor GhCaM7 promotes cotton fiber elongation by modulating reactive oxygen species (ROS) production (Tang et al., 2014; Cheng et al., 2016), and GhIQD10 affects cotton fiber elongation via Ca2+ signaling by interacting with GhCaM7 (Xu et al., 2023). Additionally, the cotton NAC (NAM, ATAF, and CUC) TF GhFSN1 acts as a positive regulator of SCW formation in cotton fibers by activating downstream SCW-related GhDUF231L1, GhKNL1, GhMYBL1, GhGUT1 and GhIRX12 genes (Zhang et al., 2018). In turn, GhMYB212 regulates sucrose transport into expanding fibers and is required for cotton fiber development (Sun et al., 2019). Additionally, GhMYB7 promotes secondary wall cellulose deposition in cotton fibers by regulating GhCesA gene expression (Huang et al., 2021b). Moreover, overexpression of the basic helix-loop-helix (bHLH) TF, GhFP1, a regulator of brassinosteroid synthesis-related genes, GhDWF4 and GhCPD, increases the length of the final mature fiber (Liu et al., 2020). Recently, GhBES1.4 was reported to control fiber elongation by regulating endogenous very long chain fatty acid (VLCFA) content via direct binding to the GhKCS10_At promoter (Yang et al., 2023). Nonetheless, despite all the progress summarized above, the mechanism underlying fiber development remains to be fully elucidated.
Sphingolipids play important roles in signaling pathways and many biochemical processes, such as regulation of plant developmental, stimulus sensing, and stress responses (Liu et al., 2021; Haslam and Feussner, 2022). The sphingolipid molecule consists of three main components: a long chain base (LCB) of sphingosine, long chain fatty acids (LCFA) or VLCFA, and a polar head group. Fumonisin B1 (FB1), is produced by Fusarium moniliforme and Verticillium dahliae, and has a structure very similar to that of sphinganine (Sph). Fumonisin B1 acts as a specific inhibitor of ceramide synthase (CS) (Zeng et al., 2020; Xu et al., 2022). When cultured cotton ovules were treated with FB1, 95 sphingolipids were reportedly altered, with 29 of them significantly increasing, and 33 significantly decreasing, thereby severely blocking fiber elongation (Wang et al., 2020). Cotton fiber sphingolipidomic analysis revealed that a phytoceramide containing hydroxylated and saturated VLCFA is important for fiber elongation (Chen et al., 2021). Sphingolipid LCB hydroxylation reportedly influences plant growth and callose deposition in Physcomitrium patens (Gomann et al., 2021). Further, comparative metabolomic analysis of Xuzhou142 lintless-fuzzless mutants (Xufl) and its corresponding wild-type Xuzhou142 (XuFL) revealed that sterols and sphingolipids play a role in cotton fiber initiation (Wang et al., 2021). Moreover, overexpression of the CS gene, GhCS1, reportedly inhibits fiber cell initiation and elongation by promoting the synthesis of ceramides containing dihydroxy LCB and VLCFA, whereas down-regulating a fiber-specific beta-ketoacyl reductase (KCR)-like gene GhKCRL1 suppresses fiber elongation by blocking the synthesis of sphingolipids in fiber cells (Li et al., 2022; Meng et al., 2022). Altogether, these results indicate that sphingolipids have an important role in fiber elongation. However, the molecular mechanisms underlying sphingolipid-affected fiber elongation remains unclear.
In the presented study, we observed that FB1 suppressed R2R3 MYB TF GhMYB86, which negatively affected fiber elongation. Further, we demonstrated that GhMYB86 controlled microtubule arrangement at the fiber tips by directly targeting GhTUB7. Moreover, treatment with sphingolipid biosynthesis inhibitor FB1 induced GhMBE2 to enter the nucleus, which, in turn, enhanced the promotion of GhTUB7 by GhMYB86. Our results expand our understanding of the effects of sphingolipids on cotton fiber elongation and provide new insights into the interactions between the membrane and cytoskeleton during fiber elongation.
RESULTS
GhMYB86 is significantly down-regulated by sphingolipid biosynthesis inhibitor FB1
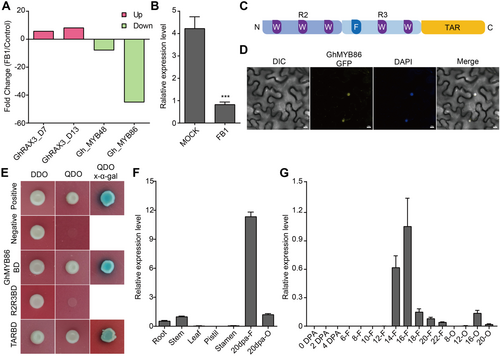
We previously reported that the sphingolipid biosynthesis inhibitor FB1 severely inhibited fiber elongation in the in vitro ovule culture system. Subsequently, we performed transcriptome analysis of FB1 treated fibers to elucidate the underlying system, and identified 615 significantly altered genes (Wang et al., 2020). Transcription factors, are key hubs that regulate gene expression. We first examined the changes in TFs after FB1 treatment. Among all the MYB TFs, GhMYB86 was screened out because its expression was sharply down-regulated by as much as 45-fold (Figure 1A). Additionally, quantitative reverse transcription—polymerase chain reaction (qRT-PCR) analysis confirmed that the expression of GhMYB86 was suppressed upon FB1 treatment (Figure 1B). Additionally, homology analysis showed that GhMYB86 is a typical R2R3 MYB TF containing an R2R3-MYB domain and a transcriptional activation region (TAR) domain (Figure 1C, Figure S1). Furthermore, subcellular localization indicated that GhMYB86 is a transcription activator with TAR domain being responsible for this activity (Figure 1D, E). Lastly, qRT-PCR analysis revealed that GhMYB86 was preferentially expressed during SCW synthesis (Figure 1F, G).
Characteristics of GhMYB86
(A) Differentially expressed MYB genes by sphingolipid biosynthesis inhibitor fumonisin B1 (FB1)1 treatment. GhMYB86 was down-regulated by FB1 treatment. (B) The expression level of GhMYB86 after FB1 treatment detected by quantitative reverse transcription – polymerase chain reaction (qRT-PCR). P-value is based on two-tailed Student's t-test analysis by GraphPad Prism 9. ***P < 0.001. (C) Diagram of GhMYB86 R2R3 and TAR domain. (D) The subcellular localization of GhMYB86. (E) Identification of transcriptional activation activity and activation domain of GhMYB86 by Y2H (yeast-two-hybrid) assay. (F, G) The expression profiles of GhMYB86 in different cotton tissues (Root, Stem, Leaf, Pistil, Stamen, 20 DPA (d post-anthesis) fiber, and 20 DPA ovule) and during fiber development. 0–4 DPA indicates 0–4 ovules with fibers, 6-22-F indicates 6–22 DPA fibers, 6-22-O indicates 6–22 DPA ovules without fibers. Error bars ± SEM. Each analysis was repeated with three biological replicates. TAR, transcriptional activation region.
GhMYB86 acts negatively in fiber elongation
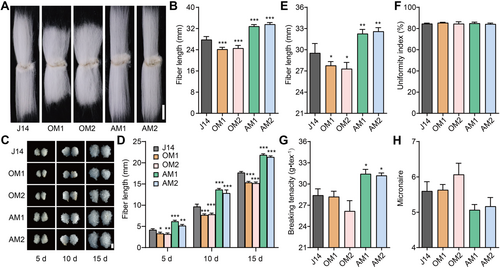
To verify GhMYB86 function in fiber elongation, we generated overexpression and antisense transgenic lines for this MYB TF. We obtained five independent positive transgenic lines for both overexpressing- and antisense-GhMYB86 (Figure S2), respectively. The mature fiber lengths of GhMYB86-overexpression lines (OM1 and OM2) were 24.33 ± 0.57 mm and 24.83 ± 0.28 mm, and were reduced by 12.45% and 10.65%, respectively, compared to that of recipient Jimian14 (J14, 27.79 ± 1.18). In contrast, the mature fiber lengths of GhMYB86-antisense lines (AM1 and AM2) were 32.83 ± 0.66 mm and 33.60 ± 0.65 mm, and were increased by 18.13% and 20.91%, respectively (Figure 2A, B). To better understand fiber elongation in GhMYB86 transgenic lines, further quantitative analysis of the lengths of 5-, 10-, and 15-d fibers was performed using an in vitro cotton ovule culture system, which showed that fiber lengths of GhMYB86-overexpression lines were markedly shorter than that of the wild type after 5 d of culture, and remained shorter than that of J14 throughout each of the subsequent periods. In contrast, the fiber lengths of GhMYB86-antisense lines were remarkably longer than that of J14, even at the early stage (5 d) and remained longer thereafter (Figure 2C, D).
Fiber length of GhMYB86-transgenic lines
(A) Mature fibers of GhMYB86-overexpression (OM1 and OM2) and antisense lines (AM1 and AM2). Scale bar, 10 mm. (B) Mature fiber length of GhMYB86-overexpression and antisense lines. Error bars ± SEM. Each analysis was repeated with at least 20 biological replicates. (C) Dynamic fibers of GhMYB86-overexpression and antisense lines detected by in vitro ovule culture system. Scale bar, 5 mm. (D) Dynamic fiber length of GhMYB86-overexpression and antisense lines. Error bars ± SEM. Each analysis was repeated with at least 10 biological replicates. (E–H) Fiber quality (length (E), uniformity index (F), breaking tension (G), and micronaire (H)) of GhMYB86-overexpression and antisense lines. Fiber quality was evaluated using an HVI system housed at the Center for Cotton Fiber Quality Inspection and Testing at the Chinese Ministry of Agriculture. All P-values are based on two-tailed Student's t-test analysis by GraphPad Prism 9. *P < 0.05; **P < 0.01; ***P < 0.001. HVI, hvispectrum.
Subsequently, we evaluated the quality of the GhMYB86 transgenic line fibers at the Institute of Cotton Research (ICR) at the Chinese Academy of Agricultural Sciences (CAAS). The results of the fiber quality evaluation confirmed that GhMYB86-overexpression lines produce much shorter fibers than their recipient J14, while the GhMYB86-antisense lines exhibit much longer and stronger fibers. Indeed, when we compared the length, strength, and micronaire of recipient cotton J14 with the same quality indexes in GhMYB86 transgenic lines, we noted that length decreased sharply, by 5.88% and 7.53% for OM1 and OM2, respectively, and significantly increased by 9.43% and 10.50% for AM1 and AM2, respectively. Interestingly, fiber strength was slightly reduced in OM1 and OM2 (0.69% and 7.91%), respectively, but significantly increased by 10.71% and 9.91% in AM1 and AM2, respectively. Meanwhile, micronaire, which indicates fiber finesse, increased by 0.83% and 8.32% for OM1 and OM2, respectively, but decreased by 9.33% and 7.61% for AM1 and AM2, respectively (Figure 2E–H).
Given that GhMYB86 expression was sharply suppressed by FB1 treatment, we then examined the response of GhMYB86-transgenic lines to FB1 during fiber elongation. When treated with FB1, the fiber lengths of GhMYB86-antisense lines were similar to that of the wild type, whereas those of GhMYB86-overexpression lines were obviously longer than that of J14. Thus, GhMYB86-antisense lines were sensitive to FB1, while GhMYB86-overexpression lines were insensitive to FB1 during fiber elongation (Figure S3). Taken together, these results indicated that GhMYB86 acts as a negative regulator of fiber elongation.
GhTUB7 is the direct target of GhMYB86
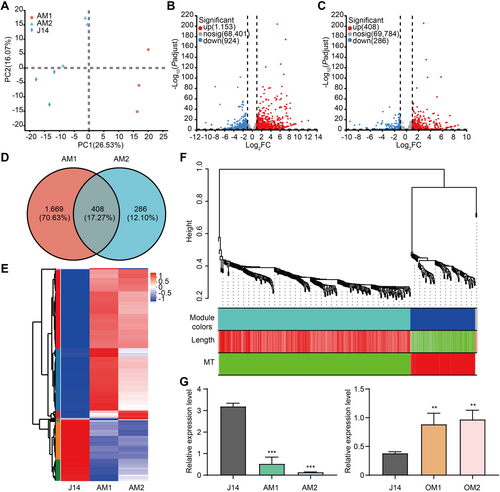
To identify the target of GhMYB86, we performed transcriptome analysis of GhMYB86-antisense lines AM1 and AM2. According to principal component analysis, all samples showed their own aggregation distribution (Figure 3A). In particular, we found 1,153 and 408 up-regulated and 924 and 286 down-regulated differentially expressed genes (DEGs) for AM1 and AM2, respectively (Figure 3B, C). Additionally, we obtained 408 common DEGs for both antisense lines (Figure 3D). Interestingly, almost all these common DEGs exhibited similar expression trends in AM1 and AM2 (Figure 3E). To better understand these common DEGs, we performed Gene Ontology (GO) enrichment analysis using the free online tools on the Majorbio Cloud Platform (www.majorbio.com). Three GO terms, “DNA binding”, “transcription regulator activity”, and “DNA-binding TF activity” related to transcription attracted our attention, as these terms indicated that GhMYB86 regulates gene expression by regulating transcription, which is consistent with the function of GhMYB86 as a TF (Figure S4). We then checked all down-regulated genes in the GhMYB86-antisense lines. Fortunately, we found that GhTUB7 was down-regulated in GhMYB86-antisense lines, which we have previously verified and had negative effects on fiber development as revealed by transgenic methods (unpublished data). Additionally, we examined the expression of GhTUB7 in all GhMYB86 transgenic lines and found that it was suppressed in GhMYB86-overexpression lines and promoted in antisense lines (Figure 3G).
Transcriptome analysis of GhMYB86-antisense lines
(A) Principal component analysis of RNA sequencing (RNA-Seq) data for GhMYB86-antisense lines (AM1 and AM2). (B, C) The volcano diagram of up- and down-regulated genes in GhMYB86-antisense line AM1 (B) and AM2 (C). (D) Venn diagrams of differentially expressed genes (DEGs) in GhMYB86-antisense lines. (E) The expression heat map of 408 common DEGs in GhMYB86-antisense lines. (F) Hierarchical cluster tree showing co-expression modules identified by weighted gene co-expression network analysis (WGCNA) in RNA-Seq data for GhMYB86-antisense lines. Each leaf in the tree represents one gene. The major tree branches constitute three modules, labeled with different colors, including gray, turquoise, and blue. Red color represents the positive correlation between genes and traits; green color represents the negative relationships between genes and traits. Traits including fiber length and the arrangement of microtubules at the fiber tips. (G) The expression levels of GhTUB7 in GhMYB86-antisense and overexpression lines detected by quantitative reverse transcription—polymerase chain reaction (qRT-PCR). Error bars ± SEM. Each analysis was repeated with three biological replicates. All P-values are based on two-tailed Student's t-test analysis by GraphPad Prism 9. **P < 0.01; ***P < 0.001.
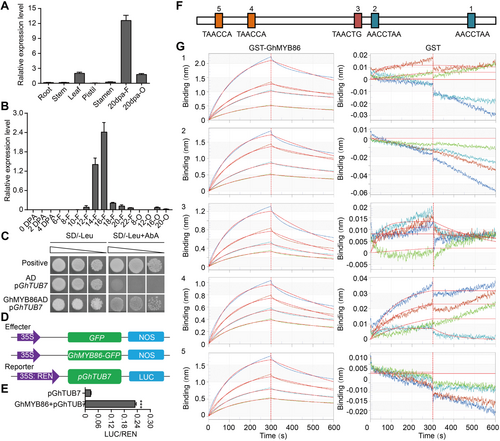
Subsequently, we found that GhTUB7 showed expression profiles similar to those of GhMYB86 (Figures 4A, B, S5). Using a yeast one-hybrid (Y1H) assay, we confirmed that GhMYB86 bound to the promoter of GhTUB7 (Figure 4C). Furthermore, using a luciferase (LUC) reporter system, we verified that GhMYB86 promoted the expression of GhTUB7 (Figure 4D, E). Moreover, we measured the binding affinity of GhMYB86 to the GhTUB7 promoter fragment in real time using biolayer interferometry (BLI) binding measurements. Using BLI binding-affinity assays, we found that GhMYB86 effectively bound to the typical MYB-binding motifs of the GhTUB7 promoter (Figure 4F, G). These results suggest that GhTUB7 is a direct target of GhMYB86 during fiber elongation.
GhTUB7 were the direct target of GhMYB86
(A, B) The expression profiles of GhTUB7 in different cotton tissues (Root, Stem, Leaf, Pistil, Stamen, 20 d post-anthesis (DPA) fiber, and 20 DPA ovule) and during fiber development (0–4 DPA indicates 0–4 ovules with fibers, 6-22-F indicates 6-22 DPA fibers, 6-22-O indicates 6–22 DPA ovules without fibers). Error bars ± SEM. Each analysis was repeated with three biological replicates. (C) GhMYB86 binds to the promoter of GhTUB7 detected by Y1H (yeast-one-hybrid) assay. (D, E) GhMYB86 promotes the expression of GhTUB7. Error bars ± SEM. Each analysis was repeated with six biological replicates. All P-values are based on two-tailed Student's t-test analysis by GraphPad Prism 9. ***P < 0.001. (F) Schematic representation of the typical MYB-binding motifs in GhTUB7 promoter. (G) GhMYB86 binds to the typical MYB-binding motifs of GhTUB7 promotor detected by biolayer interferometry (BLI) binding measurements.
GhTUB7 plays negative roles in fiber elongation
Previously, we generated overexpression and antisense transgenic lines for GhTUB7. We obtained five and six independent positive transgenic lines for both overexpressing and antisense GhTUB7 lines (Figure S6), respectively. Interestingly, much like GhMYB86-overexpression lines, the GhTUB7-overexpression lines exhibited shorter fibers, whereas the GhTUB7-antisense lines had longer fibers, similar to the GhMYB86-antisense lines (Figure 5A, B). The mature fiber lengths of GhTUB7-overexpression lines (OT1 and OT2) were 23.60 ± 0.49 mm and 23.70 ± 0.40 mm, and were reduced by 16.64% and 16.29% compared to that of recipient J14 (28.31 ± 1.27), respectively. In contrast, the mature fiber lengths of GhTUB7-antisense lines (AT1 and AT2) were 34.52 ± 0.63 mm and 34.10 ± 0.49 mm, and were increased by 21.85% and 20.44%, respectively, relative to that of J14 (Figure 5A, B). Additionally, using an in vitro cotton ovule culture system, we confirmed that the fibers of GhTUB7-overexpression lines were markedly shorter than those of the wild type after a 5-d culture period and remained shorter thereafter, whereas the fibers of GhTUB7-antisense lines were remarkably longer than that of J14 at the same period, and remained longer thereafter (Figure 5C, D). These results were consistent with the mature fiber length of GhMYB86-transgenic lines.
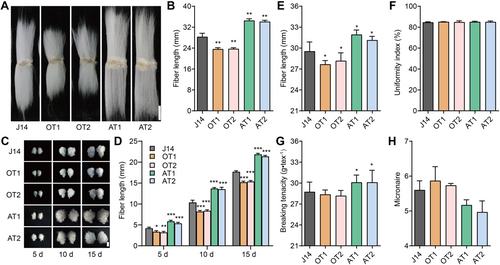
Fiber length of GhTUB7-transgenic lines
(A) Mature fibers of GhTUB7-overexpression (OM1 and OM2) and antisense lines (AM1 and AM2). Scale bar, 10 mm. (B) Mature fiber length of GhTUB7-overexpression and antisense lines. Error bars ± SEM. Each analysis was repeated with at least 20 biological replicates. (C) Dynamic fibers of GhTUB7-overexpression and antisense lines detected by in vitro ovule culture system. Scale bar, 5 mm. (D) Dynamic fiber length of GhTUB7-overexpression and antisense lines. Error bars ± SEM. Each analysis was repeated with at least 10 biological replicates. (E–H) Fiber quality (length (E), uniformity index (F), breaking tension (G), and micronaire (H)) of GhTUB7-overexpression and antisense lines. Fiber quality was evaluated using an HVI system housed at the Center for Cotton Fiber Quality Inspection and Testing at the Chinese Ministry of Agriculture. All P-values are based on two-tailed Student's t-test analysis by GraphPad Prism 9. *P < 0.05; **P < 0.01; ***P < 0.001. HVI, hvispectrum.
Additionally, we also checked the fiber quality of GhTUB7-transgenic lines. Fiber length sharply decreased by 6.32% and 6.66% in OT1 and OT2, respectively, whereas it significantly increased by 8.13% and 7.67% in AT1 and AT2, respectively. In turn, fiber strength decreased slightly in OT1 (0.12%) and OT2 (0.82%), but significantly increased by 8.57% and 8.45% in AT1 and AT2, respectively. Lastly, micronaire increased by 4.76% and 2.38% in OT1 and OT2, respectively, while it decreased by 10.71% and 11.31% in AT1 and AT2, respectively. (Figure 5E–H). In other words, the GhTUB7-overexpression lines produced much shorter fibers than recipient J14, whereas the GhTUB7-antisense lines exhibited much longer and stronger fibers. Taken together, these results confirmed that GhTUB7 is a downstream target of GhMYB86.
GhMYB86 regulates microtubule arrangement during fiber elongation
Given that both GhMYB86 and its target, GhTUB7, function negatively in fiber elongation, and as tubulin is the main protein constituent of MTs, we then examined the MT arrangement of the transgenic lines. MT fluorescence intensity per unit area from fibers of GhMYB86- and GhTUB7-overexpression lines was significantly higher than that from those of the wild type, whereas MT fluorescence intensity from fibers of GhMYB86- and GhTUB7-antisense lines were obviously lower (Figure 6A–C). These results indicated that the MT arrangements in the overexpression lines were tighter, whereas those of the antisense lines were looser. Subsequently, we examined MT orientation in fibers of GhMYB86- and GhTUB7-transgenic lines. The MT angles of the wild-type fibers were between 60° and 135°, and mainly between 60° and 90°, showing a parallel arrangement trend. In turn, the MT angles of overexpression line fibers ranged from 45° to 135°, mainly in the angle ranges of 60°–75° and 105°–120°, respectively, and showed a cross-grid pattern, while MT angles of antisense line fibers were distributed between 60° and 105°, and mainly between 75° and 90°, that is, the MTs of antisense lines were almost perpendicular to the elongation axis of the fibers and showed parallel distribution patterns (Figure 6F, G). More intriguingly, the fiber tips of GhMYB86- and GhTUB7-overexpression lines showed ectopically arranged MTs (Figure 6A, B), which in turn prevented fiber elongation, resulting in short fiber phenotypes. In contrast, the MT arrangements at the fiber tips of GhMYB86- and GhTUB7-antisense lines were similar to those of J14 (Figure 6A, B). These results suggest that GhMYB86 regulates fiber MT arrangement, and thus fiber elongation, by controlling the expression of GhTUB7.
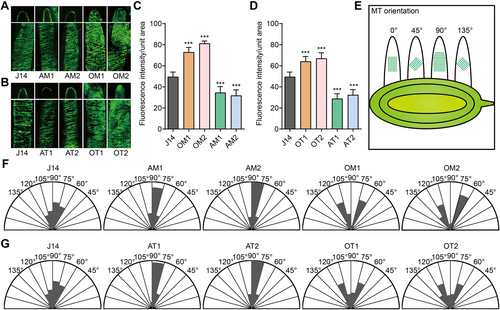
Microtubule (MT) arrangement of GhMYB86 and GhTUB7 transgenic fibers
(A) MT immunofluorescence images for fibers of GhMYB86-overexpression and antisense lines after 10-d in vitro culture. (B) MT immunofluorescence images for fibers of GhTUB7-overexpression and antisense lines. (C, D) Fluorescence intensity per unit area (80 × 20 pt) of GhMYB86- (C) and GhTUB7- (D) transgenic lines. For each line, 30 unit areas from 10 cells of 10 ovules were analyzed. All P-values are based on one-way analysis of variance (ANOVA) by GraphPad Prism 9. ***P < 0.001. (E) A demonstration for MT orientation. The average MT angle was valued between 0° and 180°. 0° refers to the direction of the elongation axis of the fiber. 90° is perpendicular to the elongation axis of the fiber. (F, G) MT orientation of GhMYB86- (F) and GhTUB7- (G) transgenic lines. More than 100 cells from 10 ovules per line were analyzed.
To further verify the relationship between GhMYB86-controlled fiber length and MT arrangement, we performed weighted gene co-expression network analysis (WGCNA) using the transcriptome data, fiber length of GhMYB86-antisense lines, and the MT arrangement at the fiber tips of these lines. A total of 324 genes were filtered out from the 408 common DEGs to the WGCNA. Co-expression networks were constructed on the basis of pairwise correlations of gene expression with fiber length, and the MT arrangement at the fiber tips across all samples. Modules were defined as clusters of highly interconnected genes, with genes within the same cluster exhibiting high correlation coefficients. We obtained three modules (labeled with different colors): turquoise, blue, and gray. Interestingly, in the turquoise module, 240 genes were identified, the expressions of which correlated positively with fiber length and negatively with MT arrangement. In turn, in the blue module, we identified 81 genes in which expression negatively correlated with fiber length and positively with MT arrangement, (Figure 3F). In particular, GhTUB7 clustered within the blue module. These results further confirmed GhMYB86-controlled fiber length negatively correlated with MT arrangement.
GhMYB86 interacts with GhMBE2
To understand the molecular function of GhMYB86 in regulating cotton fiber elongation, we performed yeast two-hybrid (Y2H) screening using GhMYB86 as the bait. Interestingly, we found that GhMYB86 interacted with the TF isoform of enolase (ENO), named GhMBE2 (Figures 7A, S6; Table S1), which was previously reported to promote cold tolerance by binding to and activating C-repeat/DRE binding factor1 (Lee et al., 2002). The expression of GhMBE2 was maintained at a high level throughout the whole plant, and was highly expressed in flowers and ovules, and showed an increasing-decreasing-increasing expression trend over fiber development (Figure 7B, C). The expression profiles of GhMBE2 indicated that it was also expressed in the fibers where it may interact with GhMYB86. We then examined the subcellular localization of GhMBE2 and found that it co-localized in the nucleus with GhMYB86 (Figure 7D). Moreover, bimolecular fluorescence complementation (BiFC) experiments suggested that GhMBE2 interacted with GhMYB86 in the nucleus (Figure 7E). This interaction between GhMYB86 and GhMBE2 was further confirmed by glutathione S-transferase (GST) pull-down assays (Figure 7F). Overall, these results indicate that GhMYB86 interacts with GhMBE2.
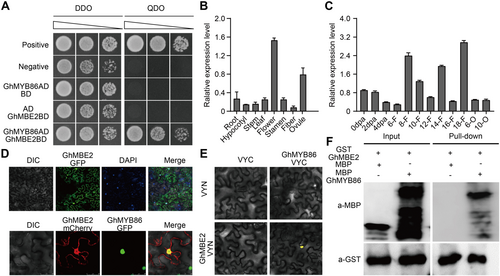
GhMYB86 interacts with GhMBE2
(A) The interaction between GhMYB86 and GhMBE2 detected by yeast two-hybrid (Y2H) assay. (B, C) The expression profiles of GhMBE2 in different cotton tissues (Root, Hypocotyl, Stem, Leaf, Flower, Stamen, 20 d post-anthesis (DPA) fiber, and 20 DPA ovule) and during fiber development (0–4 DPA indicates 0–4 ovules with fibers, 6-22-F indicates 6–22 DPA fibers, 6-22-O indicates 6–22 DPA ovules without fibers). Error bars ± SEM. Each analysis was repeated with three biological replicates. (D) Co-localization of GhMYB86 and GhMBE2. (E, F) The interaction between GhMYB86 and GhMBE2 detected by bimolecular fluorescence complementation (BiFC) and glutathione S-transferase (GST) pull-down assays. Each analysis was repeated three times for similar results obtained.
FB1 treatment induces GhMBE2 transport into the nucleus
Previously, Wang et al. (2020) reported that the main enriched biological process GO terms of the different expressed proteins induced by FB1 treatment were associated with the “hydrogen peroxide catalytic process”. More recently, ENO2 transport into the nucleus was reportedly stimulated by cold-induced H2O2 accumulation (Liu et al., 2022). Hence, we examined the effects of sphingolipids (S1P, sphingosine 1 phosphate; Cer, ceramide) and sphingolipid inhibitors (FB1; Myriocin; PDMP, 1-phenyl-2-decanoylamino-3-morpholino-1-propanol) on fiber elongation and confirmed that sphingolipids promoted fiber elongation, whereas sphingolipid inhibitors blocked it (Figure 8A). Further, using the ROS fluorescent dye 2′,7′-dichlorofluorescin diacetate (DCFDA) to stain the treated ovules, we found that the treatment of cotton ovules with sphingolipid inhibitors resulted in a burst of ROS accumulation (Figure 8A, B). Additionally, we found that when treated with sphingolipid inhibitors, the expression of GhRbohs increased and the transcripts of GhCATs decreased, which might explain the burst in ROS generation after the inhibitor treatment (Figures 8C, S7). Consistently, when treated with FB1 and H2O2, more GhMBE2 entered the nucleus (Figure 8D, E). Moreover, the interaction between GhMBE2 and GhMYB86 enhanced the promotion of GhTUB7 by GhMYB86 (Figure 8F). Therefore, we hypothesized that sphingolipids influenced ROS biosynthesis, consequently inducing the translocation of GhMBE2 into the nucleus, and then enhancing the promotion of GhTUB7 by GhMYB86, and thus regulating microtubule arrangement in fiber tips, and ultimately affecting fiber elongation (Figure 9).
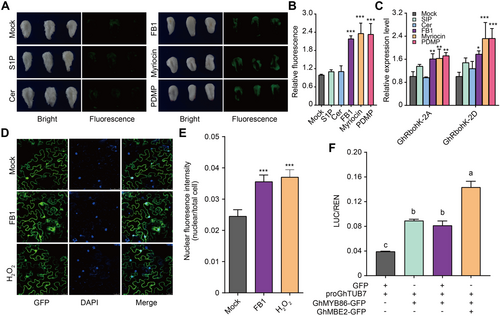
GhMBE2 enhanced the promotion of GhMYB86 to GhTUB7
(A) Fluorescence images of reactive oxygen species (ROS) detected by 2′,7′-dichlorofluorescin diacetate (DCFDA) in sphingolipid and sphingolipid biosynthesis inhibitor treated ovules, respectively. S1P, sphingosine 1 phosphate; Cer, ceramide; and FB1, fumonisin B1; Myriocin; PDMP, 1-phenyl-2-decanoylamino-3-morpholino-1-propanol; respectively. (B) Relative ROS content of sphingolipid and sphingolipid biosynthesis inhibitor treated ovules detected by DCFDA. Error bars ± SEM. Each analysis was repeated with at least four biological replicates. (C) The expression levels of GhRbohs in sphingolipid and sphingolipid biosynthesis inhibitor treated ovules. Error bars ± SEM. Each analysis was repeated with three biological replicates. (D, E) Fumonisin B1 (FB1) and H2O2 induced GhMBE2 entering into nucleus. Error bars ± SEM. Nuclear fluorescence intensity of 50 cells from 10 independent transient expressions were analyzed. (F) GhMBE2 enhanced the promotion of GhMYB86 to GhTUB7. Each analysis was repeated with six biological replicates. P-values for figure E are based on one-way analysis of variance (ANOVA) analysis by GraphPad Prism 9. Other P-values are based on two-tailed Student's t-test analyzed by GraphPad Prism 9. *P < 0.05; **P < 0.01; ***P < 0.001. For figure F, different letters indicate significant differences.
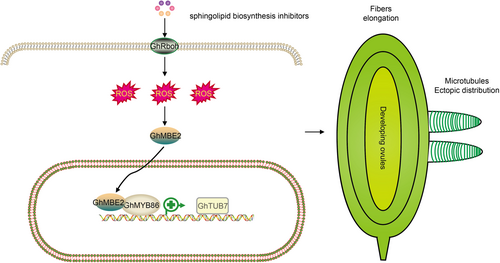
Proposed working model for GhMYB86
When treated with sphingolipid biosynthesis inhibitors, the expression levels of reactive oxygen species (ROS) generation and scavenging related genes were increased and suppressed, respectively, leading to an explosion of ROS, and then promoting the entry of GhMBE2 into the nucleus. Subsequently, nucleus localized GhMBE2 could interact with GhMYB86, which promotes the activation of GhTUB7 by GhMYB86, resulting in ectopic arrangement of microtubules at the tip of the fiber cell, and thus retarding fiber elongation.
DISCUSSION
GhMYB86 has negative roles in fiber elongation
It is well-known that R2R3 MYBs are plant-specific MYB TFs that play crucial roles in plant growth and development, and participate in the regulation of various biological processes, such as cell morphogenesis, trichome development, and response to phytohormones (Millard et al., 2019; Pratyusha and Sarada, 2022). Numerous studies have revealed that MYB TFs participate in root epidermal cell differentiation (Chen et al., 2022). The Arabidopsis R2R3MYB WEREWOLF induces epidermal cells located outside a single cortical cell (the N position) to adopt the nonhair fate by activating the expression of GL2, while promoting epidermal cells in contact with two underlying cortical cells (the H position) to adopt the root hair cell fate by activating CPC expression (Lee and Schiefelbein, 2002; Koshino-Kimura et al., 2005). R2R3 MYB GL1 acts as a positive regulator of trichome development, which forms trimeric transcriptional activators with TTG1 and GL3 to promote trichome production (Zhao et al., 2008). AtMYB59 is specifically expressed during the S phase of the cell cycle, and its overexpression inhibits root development by prolonging the mitotic metaphase (Mu et al., 2009). In cotton, MYB TFs play essential roles in fiber initiation, elongation, and SCW synthesis (Huang et al., 2013, 2016, 2019). GhMYB109 is predominantly expressed during fiber initiation and elongation periods, which may have positive roles in fiber development (Suo et al., 2003). Furthermore, the suppression of GhMYB109 results in shortened fibers by the down-regulation of the expression of fiber-related genes, including GhACO1, GhACO2, GhTUB1 and GhACT1 (Pu et al., 2008). In turn, GhMYB25 is essential for fiber initiation, and its inhibition by means of RNA interference technology leads to decreased fiber initiation rates and shortened fibers. Conversely, overexpression of this gene reportedly promotes the initiation of cotton fibers and increases the number of trichomes (Machado et al., 2009). Suppressing GhMYB25-like led to the down-regulation of GhMYB25 and GhMYB109, resulting in fiberless seeds, but did not affect trichome development in other organs, such as leaves, petioles and petal bases, or the initiation of cotton fibers (Walford et al., 2011). Meanwhile, GhMYB2 is a homolog of GL1 that can rescue the non-trichome phenotype of gl1 and promotes fiber initiation (Guan et al., 2014). In turn, GhRDL1 is mainly expressed in the ovule epidermis at the fiber initiation stage (Wang et al., 2004). Similarly, GhMYB212 is mainly expressed in the outer integument of the ovule during the fiber elongation period. This gene promotes sucrose transport from the outer seed coat to fiber cells by upregulating GhSWEET12, thereby affecting cotton fiber elongation (Huang et al., 2013; Sun et al., 2019). Similarly, GhMYB7 acts as a transcriptional activator of cotton fiber SCW deposition, and up-regulation of this gene can activate the expression of SCW biosynthesis-related genes, including: cellulose synthase genes (GhCESA4, GhCESA7, GhCESA8), lignin synthesis genes (Gh4CL1, GhCCoAOMT1, GhPAL1), and xylan synthesis genes (GhIRX9, GhIRX10, GhIRX14) (Huang et al., 2016). Overall, almost all reported cotton MYB TFs have positive roles in fiber development. Here, we identified an R2R3 MYB TF that was sharply suppressed by the sphingolipid biosynthesis inhibitor FB1 and was designated GhMYB86. GhMYB86 was mainly expressed during the transition and SCW deposition periods of fiber development, implying that it might play a role in fiber development. Furthermore, overexpression of GhMYB86 resulted in shorter fibers, whereas down-regulation of GhMYB86 led to longer fibers, indicating that GhMYB86 acts as a negative regulator of fiber elongation.
GhMYB86 inhibits fiber elongation by promoting ectopic microtubule distribution at the fiber tip
Anisotropic cell expansion in plants depends on cortical microtubules that serve as tracks along which macromolecules and vesicles are transported (Kong et al., 2015). Cotton fibers undergo vigorous elongation and during the rapid elongation period, the fiber cell-growth pattern of fiber is linear, including apical and diffusion growth (Qin and Zhu, 2011). Recently, cotton fibers were reported to be elongate in a unique tip biased diffusion growth pattern (Yu et al., 2019; Yang et al., 2020) controlled by the cytoskeleton (Stiff and Haigler, 2016). Plant cell walls are highly ordered, with cellulose micro-fibrils aligned coherently over a scale spanning hundreds of cells that have long been aligned in parallel with an array of microtubules in the cell cortex (Sankaranarayanan and Kessler, 2020). Pollen tubes are single cells that elongate from the stigma papillae at the top of the pistil to the ovules, which contain the female gametes. Cortical microtubule organization plays a pivotal role in pollen tube guidance. For instance, the cortical microtubules inside the papilla are highly anisotropic, and the pollen tube grows in a straight line (Sankaranarayanan and Kessler, 2020; Riglet et al., 2021). Interestingly, in elongating fiber cells, microtubules largely occur transverse to the fiber growth axis and are not distributed at the tip of the fiber (Yu et al., 2019; Wen et al., 2023). In the present study, we showed that GhTUB7 is a direct target of GhMYB86, which activated it. Furthermore, overexpression of GhMYB86 and GhTUB7 caused an abnormal microtubule arrangement at the fiber tips, indicating that GhMYB86 controlled fiber elongation by disrupting the tip biased diffusion growth pattern via the promotion of GhTUB7.
The GhMYB86–GhMBE2 module acts as a junction between membrane sphingolipids and microtubule cytoskeleton
Sphingolipids and sterols are the major components of lipid rafts (Cacas et al., 2016). Membrane lipid raft activity is a major index for characterizing membrane properties. Higher order cell membranes and lipid raft activity offer stable reaction platforms and an ordered dynamic environment for various physiological and biochemical reactions (Yu et al., 2004) that are closely linked to the polar elongation of cells (and Perez-Martin, 2009). The components of lipid rafts have also been shown to play key roles in fiber development. For example, VLCFAs are required for fiber development and mainly serve as precursors for sphingolipid biosynthesis (Qin et al., 2007). In addition, the composition and concentration of plant sterols influence fiber growth (Deng et al., 2016; Niu et al., 2019). Furthermore, the inhibition of sphingolipid synthesis strongly suppresses fiber cell growth (Wang et al., 2020). In the present study, we found that treatment with sphingolipid synthesis inhibitors promoted the expression of GhRobhs and suppressed the expression of GhCATs, and thus leading to a sudden increase in ROS, which in turn induced the entry of GhMBE2 into the nucleus. Subsequently, GhMBE2 already in the nucleus interacted with GhMYB86, and promoted the expression of GhTUB7, thereby disrupting the tip biased diffusion growth pattern of cotton fibers, and resulting in shorter fibers (Figure 9). Taken together, we found that the GhMYB86–GhMBE2 module acted as a junction between membrane sphingolipids and the microtubule cytoskeleton during fiber elongation. Our study has shed novel insights into the interplay between membrane lipids and the cytoskeleton in cell morphogenesis.
MATERIALS AND METHODS
Plant materials and growth conditions
The wild-type cotton cultivar Jimian 14 (J14) and all transgenic plants were grown under natural conditions in the experimental field at the College of Agronomy and Biotechnology, Southwest University, in Chongqing, China.
Vector construction and transformation
To overexpress GhMYB86 and GhTUB7, these two genes were amplified from cotton fiber complementary DNA (cDNA) using the MYB86OE and TUB7OE primers (Table S2), and using T4 connection to integrate the sequence into pLGN with modification (containing FbL2Apromoter::GhMYB86::nos (Rinehart et al., 1996) or CaMV 35S promoter::GhTUB7::nos and 35S promoter::GUS:NPTII::nos fusion genes) to construct GhMYB86 and GhTUB7 overexpression vectors, respectively.
To down-regulate GhMYB86 and GhTUB7, the antisense fragments of these two genes were amplified from cotton fiber cDNA using the antiMYB86 and antiTUB7 primers (Table S2), and using T4 connection to integrate the sequence into pLGN to construct GhMYB86 and GhTUB7 antisense vectors, respectively.
The resulting vectors were introduced into cotton plants by Agrobacterium tumefaciens-mediated transformation as previously described (Niu et al., 2019).
Fiber length measurement
Dried, mature ovules were carefully straightened using a comb before measurement. The measurements were repeated for at least 20 ovules. Fiber length evaluations of the 5-, 10-, and 15-d samples required the ovules to be immersed in 30% glacial acetic acid and heated in boiling water for 5 min until the fibers were dispersed. The treated ovules were placed on a glass slide, rinsed with water to straighten the fibers, and then measured with a ruler.
Fiber quality evaluations
Fiber quality was evaluated as previously described (Niu et al., 2019). Briefly, approximately 30 g of cotton fibers from each line were dried and ginned using a roller gin (SY-20, Jianghe Machinery Plant, Xinxiang, Henan, China) and then subjected to fiber quality evaluation using an hvispectrum system (HFT 9000, Uster Technologies, Switzerland) housed at the Center for Cotton Fiber Quality Inspection and Testing at the Chinese Ministry of Agriculture (Anyang, Henan, China).
In vitro cotton ovule culture and treatment
Cotton ovule culture was performed as previously described, with some modifications (Xu et al., 2023). Briefly, cotton bolls were collected at 2 DPA and sterilized in 0.3% (w/v) H2O2 for 10 min, followed by three washes with sterile distilled water. The ovules were removed from the bolls under sterile conditions and cultured in Beasley and Ting (BT) medium at 30°C in darkness. For the FB1 treatment assay, ovules were cultured at 30°C in darkness in BT medium with the indicated concentrations of FB1. Fiber length was measured in more than 10 cultured ovules per treatment.
Subcellular localization assay
For subcellular localization, GhMYB86 and GhMBE2 were amplified from cotton fiber cDNA using the MYB86GFP and MBE2GFP primers (Table S2) and recombined into pCAMBIA2300-35S-eYFP (enhanced yellow fluorescent protein) using the One Step Cloning Kit (Vazyme, C112-02, China) to generate the MYB86-GFP (green fluorescent protein) and MBE2-GFP vectors, respectively. The resulting constructs were introduced into Agrobacterium tumefaciens GV3101 and infiltrated into the leaves of 5–6-week-old Nicotiana benthamiana (Sparkes et al., 2006).
Fluorescence signals were detected using confocal laser scanning microscopy (Leica TCS SP8, Wetzlar and Mannheim, Germany) at 48–72 h after transient transformation.
Transcriptome analysis
The fibers of 30 ovules from four plants were collected at 20 DPA with three biological repeats and stored at −80°C at the College of Agronomy and Biotechnology, Southwest University. The samples were sent to Shanghai Majorbio Bio-pharm Technology Co., Ltd. for RNA sequencing (RNA-Seq) as previously described with some modifications (Xu et al., 2023). Briefly, messenger RNA (mRNA) was enriched using oligo(dT) magnetic beads. The quality and quantity of the sample libraries were examined using an Agilent 2100 Bioanalyzer and a Nanodrop2000. The library products were sequenced on the Illumina NovaSeq. 6000 platform. The raw data were filtered with the FASTQ_Quality_Filter tool from the FASTX-toolkit (http://hannonlab.cshl.edu/fastx_toolkit/) and aligned to the G. hirsutum genome (https://phytozome.jgi.doe.gov/pz/portal.html#!info?alias=Org_Ghirsutum_er) using HISAT2 (http://ccb.jhu.edu/software/hisat2/index.shtml). The transcriptome data were analyzed on the Majorbio Cloud Platform (www.majorbio.com), a free online platform. The significance threshold for differential expression was false discovery rate (FDR) < 0.05, and a |log2(fold change)| > 1. All common DEGs were analyzed by GO enrichment analysis on the free online tools of the Majorbio Cloud Platform (www.majorbio.com) using Goatools software (http://www.geneontology.org/). The corrected P-value was tested by Fisher's exact test. Significant enrichment of GO terms was considered for P < 0.05.
Weighted gene co-expression network analysis
Weighted gene co-expression network analysis was performed on the free online Majorbio Cloud Platform. A total of 324 genes were obtained from nine fiber samples after screening out the genes with mean transcripts per million values and variable coefficients less than 1 and 0.1, respectively, and further used for co-expression network construction by WGCNA software (version 1.63, https://cran.r-project.org/web/packages/WGCNA/index.html). Modules were identified by setting the following parameters: a soft power β of 9, a minimum model size of 30 and a merge cut height of 0.3. Gene significance values were calculated using Spearman's correlation and used to evaluate the correlations between genes and fiber length, and the arrangement of microtubules at the fiber tips.
RNA extraction and qRT-PCR analysis
Total RNA was extracted from the cotton ovule and fiber samples using a Plant Total RNA Extraction kit (Tiangen, China). First-strand cDNA was synthesized from 2 µg total RNA using a RT SuperMix Kit with gDNA wiper (Vazyme, R233-01, China). Gene-specific primers are listed in Table S2. Reverse transcription PCR was performed on a CFX96 Optical Reaction Module (Bio-Rad, Hercules, CA, USA) using ChamQ SYBR qPCR Master Mix (Vazyme, Q311-02 China) according to the manufacturer's instructions. Cotton Histone3 (GhHis) was used as internal control. Each analysis was repeated with three biological replicates.
Protein–protein interaction
For Y2H assays, the GhMYB86 gene was amplified from cotton fiber cDNA using MYB86BD primers (Table S2) and recombined into pGBKT7 to create the MYB86-BD vector. GhMYB86 and GhMBE2 were amplified from cotton fiber cDNA using MYB86AD and MBE2AD primers (Table S2) and recombined into pGADT7 to create the MYB86-AD and MBE2-AD vectors, respectively. The Y2H assays were performed using a Matchmaker Gold Yeast Two-Hybrid System (Takara, Japan) according to the manufacturer's instructions.
For the BiFC assays, GhMYB86 and GhMBE2 were amplified from cotton fiber cDNA using the MYB86SCC and MBE2SCC primers (Table S2), respectively, and were recombined into pVYNER and pVYCER, respectively, to construct the MYB86-VYN, MYB86-VYC, MBE2-VYN, and MBE2-VYC vectors, respectively. The resulting vectors were introduced into Agrobacterium tumefaciens GV3101, and then the relevant couples were co-infiltrated into the leaves of 5–6-week-old Nicotiana benthamiana (Sparkes et al., 2006).
For the GST pull-down assays, GhMYB86 and GhMBE2 were amplified from cotton fiber cDNA using the MYB86MBP and MBE2GST primers (Table S2), respectively, and recombined into pETMALC-H and pGEX4T-3, respectively, to construct the MBP-MYB86 and GST-MBE2 vectors, respectively. GST pull-down assays were performed using MagneGSTTM Particles following the manufacturer's instructions (Promega, USA). The pull-down assay was repeated three times and similar results were observed.
Protein–DNA interaction
For the Y1H analysis, the promoter of GhTUB7 was amplified from cotton genomic DNA using TUB7AbAi primers (Table S2) and recombined into the pAbAi plasmid (Takara, Japan) to generate the pAbAi-pTUB7 vector. The resulting plasmids were transformed into the yeast strain Y1H Gold for stable integration into the yeast chromosome according to the manufacturer's manual for the MatchmakerTM Gold Yeast One-Hybrid Library Screening System (Takara, Japan). MYB86-AD was transformed into the resulting lines, and interactions were assessed by adding Aureobasidin A according to the manufacturer's manual for the MatchmakerTM Gold Yeast One-Hybrid Library Screening System (Takara, Japan).
For the transient expression assay, the promoter region of GhTUB7 was amplified from cotton genomic DNA using TUB7LUC primers (Table S2) and recombined into pGreen0800 to construct the pTUB7-LUC vector. The pTUB7-LUC construct was used as a reporter, and the MYB86-GFP and MBE2-GFP vectors were used as effectors. Relevant couples were co-infiltrated into the leaves of 5–6-week-old Nicotiana benthamiana (Sparkes et al., 2006). Luciferase activity was detected using the Duo-Lite Luciferase Assay System (DD1205-02; Vazyme, China) following the instructions. Renilla luciferase activity was used as the internal control.
For BLI binding affinity measurements, the GhMYB86 gene was amplified from cotton fiber cDNA using MYB86GST primers (Table S2) and homologously recombined into pGEX-4T-3 to construct the GST-MYB86 vector. The GST-MYB86 protein was purified using MagneGST Particles, following the manufacturer's instructions (Promega, USA). The indicated GhTUB7 promoter regions were labeled with biotin. Protein–DNA binding kinetics were measured using streptavidin-coated biosensors on an Octet RED96 system (ForteBio). First, the GST-MYB86 protein was incubated with the DNA-immobilized sensor surface in the dilution buffer for 3 min. Sensors were then washed before monitoring protein association for 5 min. Next, a phosphate-buffered saline (10%)/Tween (0.5%) buffer was used to elute the protein–DNA compounds on the sensor surface for 10 min. Dissociation curves were obtained by maintaining this set up for 15 min and then transferring the sensors back to the tubes. The data were fitted to a 1:1 binding mode to calculate the association rate constants.
Reactive ixygen species detection
The ROS images and contents were determined using DCFDA (2′,7′-dichlorofluorescin diacetate, Sigma, USA) as previously described (Jambunathan, 2010).
β-glucuronidase staining
Leaf discs of transgenic plants were collected and used for histochemical detection of β-glucuronidase expression. Collected samples were incubated in a solution containing 50 mM sodium phosphate buffer (pH 7.0), 5 mM K3Fe(CN)6, 5 mM K4Fe(CN)6, 0.1% Triton X-100, and 1 mM 5-bromo-4-chloro-3-indolyl-β-glucuronic acid at 37°C (Jefferson, 1987). Images were captured directly or under a stereomicroscope (V20, ZEISS, Germany).
Phylogenetic analysis
The amino acid sequences of GhMYB86, GhMBE2, and their homologs were aligned using MEGA7 software. Phylogenetic trees were constructed with the aligned protein sequences using MEGA7 software by employing the neighbor-joining method. Bootstrap values were derived from 1,000 replicates (Kumar et al., 2016). The sequences used to construct the phylogenetic tree can be found in the national Center for Biotechnology Information (NCBI) database (https://www.ncbi.nlm.nih.gov/).
Immunofluorescence of MTs
For indirect immunofluorescence of MTs, fibers from 10-d in vitro cultured ovules were fixed with 4% v/v paraformaldehyde for 1 h in microtubule stabilizing buffer while still attached to ovules by adapting methods previously used for fibers (Seagull, 1990). The fixed fibers were digested with 1% cellulose and 1% macerozyme (Yakult, Japan) for 1 h. A mouse monoclonal anti-tubulin primary antibody (1:100, 1 h, room temperature; #T9026, Sigma-Aldrich) and AlexaFluor 488-conjugated goat-anti-mouse secondary antibody (1:200, 4°C, overnight; #A11001, Thermo Fisher Scientific, Waltham, MA, USA) were used. Dissected chalazal pieces of the ovule with attached fibers were mounted on slides with an anti-fade reagent (#P36930, Thermo Fisher Scientific) and allowed to cure (24 h, room temperature, in the dark). The coverslips were sealed with nail polish. Fluorescence signals were detected using a confocal laser scanning microscope (Leica TCS SP8, Wetzlar and Mannheim, Germany). Fluorescence intensity and MT orientation were analyzed by ImageJ.
Accession numbers
Sequence data from this study can be found in the cottonFGD database (https://cottonfgd.net/) under the following accession numbers: GhMYB86 (Gh_A08G0993), GhTUB7 (Gh_D03G1452), GhMBE2 (Gh_D07G0394), GhHis3 (Gh_D05G2150). Sequence for constructing the phylogenetic trees of GhMYB86 and GhMBE2 can be found in the NCBI database (https://www.ncbi.nlm.nih.gov/) by blasting with GhMYB86 and GhMBE2.
ACKNOWLEDGEMENTS
This study was funded by the National Natural Science Foundation of China (31571722 and 31971984), and the Genetically Modified Organisms Breeding Major Project of China (No. 2018ZX0800921B) and Fundamental Research Funds for the Central Universities (SWU-XDJH202315). We are grateful to Professor Ma Zhiying (Hebei Agricultural University) for kindly providing Jimian 14 seeds.
CONFLICTS OF INTEREST
The authors declare no conflict of interest.
AUTHOR CONTRIBUTIONS
M.L. and F.X. designed experiments. G.L., S.H., and F.X. performed experiments and collected data. Z.Z., Q.W., H.Z., X.Y, Y.H., and H.T. participated in this study and performed some of the experiments. F. X. analyzed the data and drafted the manuscript. M.L. supervised the project and reviewed the manuscript. All authors have discussed the work and edited the manuscript.
Biographies
Open Research
Data availability statement
The raw sequence data supporting the results of this article were submitted to the CNCB database (https://www.cncb.ac.cn/), and can be found with BioProject PRJCA024219. Further information and requests for data and material should be directed to and will be fulfilled by Ming Luo ([email protected]).


