Axial Diffusivity and Tensor Shape as Early Markers to Assess Cerebral White Matter Damage Caused by Brain Tumors Using Quantitative Diffusion Tensor Tractography
Summary
Aims
We investigated the usefulness of diffusion tensor tractography (DTT) for differentiating between histological pathologies and evaluating white matter (WM) damage resulting from brain tumors. We also sought to categorize the appearance of brain tumor–related WM tract changes.
Methods
A total of 18 inpatients with intracranial neoplasms were enrolled. MRI examinations were performed at 3 T using an 8-channel phased array coil. DTT was reconstruction from the raw data of diffusion tensor imaging. WM tract–based analysis of the mean diffusivity (MD), eigenvalues (λ1, λ2, λ3), and fractional anisotropy (FA) was performed by the manual placement of regions of interest (ROIs) on the color-coded FA maps using DTIStudio software. The axial diffusivity (DA, namely λ1) and the tensor shape (Cl, namely (λ1 − λ2)/3 (λ)) were also compared between groups. P values <0.05 were considered statistically significant.
Results
In cases of low-grade glioma (LGG), the tracts adjacent to the tumors displayed the highest levels of invasion. Tract disruption was mainly observed in cases of high-grade glioma (HGG). We found significant differences regarding the FA, MD, DA, and radial diffusivity between ROIs in patients with LGG or HGG. There were also significant differences in DA and tensor shape (Cl) between patients with LGG and HGG.
Conclusion
Axial diffusivity and Cl may be useful early markers for differentiating between LGG and HGG.
Introduction
Diffusion tensor tractography (DTT) is a noninvasive imaging technique that provides quantitative information about the directionality (anisotropy) and magnitude (diffusivity) of major white matter (WM) tracts in 6–256 dimensions of the human brain 1, 2. An increasing body of evidence supports a role for DTT in the quantification of demyelination and the degree of cellularity in tumor-related brain lesion 3-5.
Many studies have shown that the tensor dataset, fractional anisotropy (FA), and mean diffusivity (MD) are associated with cellular physiology and tissue microstructure. These parameters can be used as indicators of the degree of pathological change in gliomas 6-8 and have been used extensively to outline the central tumor area as well as to separate peritumoral edema from the adjacent WM structures. However, it is difficult to properly evaluate tumor grade 8 using FA or MD owing to the heterogeneity of brain neoplasms.
In this study, we find that the axial diffusivity (DA, namely λ1) and the tensor shape (Cl, namely (λ1 − λ2)/3 (λ)) are more sensitive measurements for differentiating between the histological pathologies associated with brain tumors. The differential changes in the eigenvalues of the directional diffusivity can be used to infer the underlying mechanisms of axonal degeneration 9. Diffusion tensor imaging (DTI) provides a method for multiparametric (eigenvalues) evaluation, and the combination of these parameters (λ1, λ2, λ3) can facilitate tissue characterization and classification 9, 10. Here, we combine λ1, λ2, and λ3 to differentiate between histological pathologies associated with brain tumors and evaluate WM damage. Furthermore, we attempt to categorize the appearance of WM tracts, which had been altered by the presence of brain tumors, into three patterns: disruption, displacement, and infiltration.
Materials and Methods
Subjects
This retrospective study was approved by the ethical committee of the Affiliated Drum Tower Hospital of Nanjing University Medical School. A total of 18 inpatients with intracranial neoplasms were enrolled between September 30, 2010 and October 31, 2011 at Nanjing Drum Tower Hospital. Diagnoses were made according to the WHO criteria 10, and detailed information about the patient sample is presented in Table 1.
| No. | Age | Gender | Pathogenical diagnosis | Lesion location | Clinical manifestation |
|---|---|---|---|---|---|
| 1 | 38 | M | Mixed oligoastrocytoma (WHO II) | Right frontotemporal and cerebellum | Anopia |
| 2 | 61 | M | Mixed oligoastrocytoma (WHO II) | Right frontal | None |
| 3 | 38 | M | Mixed oligoastrocytoma (WHO II) | Right frontotemporal and cerebellum | Anopia |
| 4 | 39 | M | Astrocytoma (WHO II) | Right frontotemporal | Headache and giddiness |
| 5 | 35 | F | Astrocytoma (WHO II) | Right frontal | Impairment of vision (right) |
| 6 | 46 | M | Astrocytoma (WHO II) | Right frontal | Tendon hyperreflexia |
| 7 | 47 | M | Astrocytoma (WHO II) | Right frontal | Tendon hyperreflexia |
| 8 | 74 | F | Astrocytoma (WHO II) | Pons varolii | Giddiness |
| 9 | 46 | F | Astrocytoma (WHO III) | Right frontotemporal and parietal | Headache |
| 10 | 31 | F | Astrocytoma (WHO III) | Left occipital | None |
| 11 | 57 | F | Astrocytoma (WHO III) | Left temporal | Paraphasia and Babinski sign (+) (right) |
| 12 | 51 | F | Astrocytoma (WHO III) | Right parietotemporal | Hypodynamia (left limb) |
| 13 | 48 | M | Glioblastoma (WHO III) | Right frontotemporal | None |
| 14 | 57 | M | Gliosarcoma (WHO III) | Right temporal | Headache |
| 15 | 21 | M | Simple germinoma | Left frontal and right basal ganglia | Defect of visual field (right), hypodynamia (left), hypermyotonia (left), and Babinski sign (+) (left) |
| 16 | 60 | M | Diffuse large B-cell lymphoma | Parietal | Anesthesia (right limb) |
| 17 | 45 | M | Anaplastic meningioma | Right frontal | None |
| 18 | 64 | M | Anaplastic meningioma | Left frontal | Epilepsy |
- Age in years.
- F, female; M, male.
MRI Acquisition
MRI examinations were performed at 3 T using an 8-channel phased array coil (Gradient strength 40/80 mT/m, slew rate 200/100 T/m/second, Achieva 3.0 T TX dual Medical Systems; Philips Medical Systems, Eindhoven, Netherlands).
Anatomic Imaging
The following imaging techniques were performed: T2WI (T2-TSE, TRA, 5-mm slice thickness, 1-mm gap, TR/TE 2718/80 milliseconds, voxel size 0.68 × 0.55 mm, NSA 1); T1W with and without contrast (3D-T1FFE, TRA, 5-mm slice thickness, 1-mm gap, TR/TE 230/2.3 milliseconds, flip angle 80°, voxel size 0.82 × 0.65 mm, NSA 3); Venous BOLD (3D T2-FFE with susceptibility-weighted imaging, 0.9-mm slice thickness, TR/TE 18/26 milliseconds, flip angle 10°, voxel size 0.8 × 0.79 mm, NSA 1); and Coronal FLAIR (IR, 1.5-mm slice thickness, 1-mm gap, TR/TE 7000/120 milliseconds, TI 2200 milliseconds, voxel size 1 × 0.82 mm, NSA 2). The field of view for the transverse slices was 23 × 18 × 13 cm3, and the acquisition time for the above sequences was 13 min and 25 seconds.
Diffusion Tensor Tractography
Diffusion tensor tractography was performed at the end of the routine examination and prior to the administration of gadolinium. DTT was reconstruction from the raw data of DTI. A whole-brain, single-shot, echo-planar imaging (EPI) sequence with diffusion gradients applied in 32 directions was used for DTI (TR/TE 9221/51 milliseconds, voxel size 2 × 2 mm, 2.5-mm thickness, 0-mm gap, b factor 1000 seconds/mm2). The acquisition time for DTI was 6 min and 27 seconds.
Quantitative Analysis Based on DTT
Thirty-two diffusion-weighted images were registered to the b0 volume with affine registration using 12 degrees of freedom to correct for eddy current-induced distortions. Mappings of the MD, eigenvalue (λ1, λ2, λ3), FA, and color-coded FA were generated using the DTIStudio software (version 2.4; Johns Hopkins University, Baltimore, MD, USA) 11. Tractography was conducted using a commercially available postprocessing workstation (Extended Workspace [EWS], Philips Medical Systems, the Netherlands). The tracking procedure was discontinued when a track turning angle greater than 75° occurred. A lower threshold for FA equal to 0.15 8, 12 was used as the indicator for termination of tract elongation. For the directional red, green and blue (RGB) color mapping, red indicates the left–right axis, green indicates the anteroposterior axis, and blue indicates the superior–inferior. The fiber trajectories are displayed with the colors overlaid onto gray-scale anatomic images in various three-dimensional projections.
A WM tract–based analysis of MD, eigenvalues (λ1, λ2, λ3), and FA values were determined by the manual placement of regions of interest (ROIs) on the color-coded FA maps using DTIStudio software, which was performed by a radiologist (X.Z.) who was blinded to the clinical diagnosis. We determined the MD, eigenvalue (λ1, λ2, λ3), and FA value for 5 ROIs, including the central part of the tumor, the peritumoral edema zone, the adjacent tract, the contralateral normal-appearing white matter (NAWM), and the contralateral tract on the symmetric side. “Linearity” (Cl) was defined as (λ1 − λ2)/3 (λ), where λ = (λ1 + λ2 + λ3)/3 13. The ROI for Cl was placed in the adjacent tract (ipsilateral tract) in patients with low-grade gliomas (LGG) and high-grade gliomas (HGG).
Statistical Analysis
The data were analyzed using SPSS software (version 18; Chicago, IL, USA). For comparisons between the results, two-sided paired and unpaired t-tests were used, and significance was indicated by P values <0.05. An independent sample t-test was performed to compare the values of FA, MD, DA (λ1), radial diffusivity (DR, namely (λ2 + λ3)/2), and Cl from cases of HGG with those from cases of LGG. The results are reported as the means ± the standard deviation (SD).
Results
Detection of Altered WM Tract Patterns by DTT
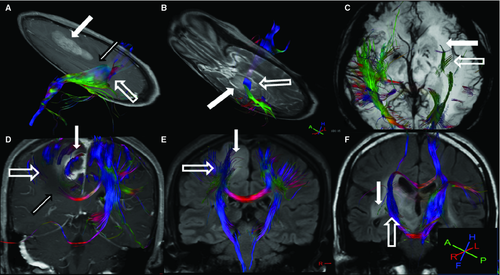
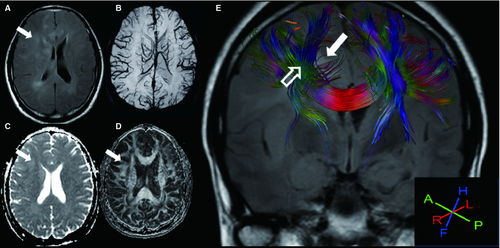
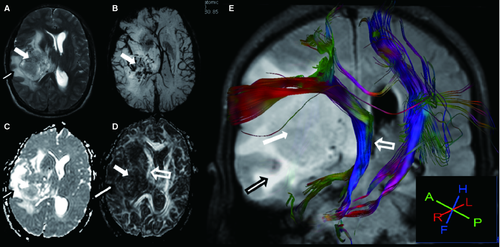
For LGG, 1 of 8 (12.5%) tracts were displaced, and 7 of 8 (87.5%) were invaded (Figures 1 and 2). For HGG, 5 of 6 (83.3%) tracts were disrupted, and 1 of 6 (16.7%) was invaded (Figures 1 and 3). Two bundles of tracts were displaced in cases of anaplastic meningioma (Figure 1A), and one tract was disrupted in cases of diffuse large B-cell lymphoma. Also, one tract was invaded in cases of primary intracranial simple germinoma (Figure 1F).


The results of the fiber-tracking procedure with 3D reconstructions of the adjacent tracts on the ipsilateral and contralateral sides of the lesion are shown in Figure 1. This figure also shows the ipsilateral corticospinal tracts that were displaced by an anaplastic meningioma (Figure 1A) in the left frontal lobe and by an astrocytoma (Figure 1B) in the pons. Although these tracts were displaced, they retained normal anisotropy measurements. Figure 1C,D show the ipsilateral inferior longitudinal fasciculus (1C) and the ipsilateral corticospinal tracts as well as the superior longitudinal fasciculus (1D), which were disrupted by the astrocytoma (WHO III). Moreover, the anisotropy was diminished in these tracts. The tracts in the peritumoral edema and the splenium of the corpus callosum were also affected. Figure 1E,F show the ipsilateral corticospinal tracts inside the oligoastrocytoma (1D) and the germinoma (1F), and these tracts retained their normal pathways.
Quantitative Data Based on DTT
The values of several parameters obtained from confirmed cases of LGG and HGG are shown in Table 2, and these summarize the mean values of the measured parameters from each ROI with the SD. We found significant differences regarding the FA, MD, DA, and DR values between tumor and NAWM, edema and NAWM, adjacent tract (ipsilateral tract) and the normal contralateral fibers. Table 3 shows the P values for the two-sided paired t-tests of the measured parameters from each ROI. We found a significant difference in the DA of the tumors and tracts between patients with LGG and those with HGG, but no significant differences were detected for the other parameters (FA, MD, and DR) or for edema. The mean and standard deviation of “linearity” (Cl) for the adjacent tracts (ipsilateral tracts) in patients with LGG and HGG were 0.18 ± 0.03 and 0.14 ± 0.03, respectively, and this difference was significant, as t = 2.485 and P = 0.025.
| ROI | Group | FA | DR | DA | MD |
|---|---|---|---|---|---|
| Tumor | LGG | 0.17 ± 0.06a | 1.21 ± 0.24a | 1.54 ± 0.25a | 1.24 ± 0.25a |
| HGG | 0.17 ± 0.05a | 1.10 ± 0.32a | 1.31 ± 0.18a | 1.20 ± 0.31a | |
| Edema | LGG | 0.29 ± 0.11a | 0.92 ± 0.30a | 1.51 ± 0.22a | 1.07 ± 0.27a |
| HGG | 0.25 ± 0.11a | 1.07 ± 0.26a | 1.39 ± 0.18a | 1.22 ± 0.23a | |
| Tract | LGG | 0.38 ± 0.03c | 0.82 ± 0.22c | 1.53 ± 0.18c | 0.90 ± 0.08c |
| HGG | 0.37 ± 0.06c | 0.99 ± 0.31c | 1.34 ± 0.21c | 1.06 ± 0.12c | |
| NC tract | LGG | 0.44 ± 0.02 | 0.63 ± 0.09 | 1.23 ± 0.07 | 0.82 ± 0.04 |
| HGG | 0.45 ± 0.03 | 0.61 ± 0.08 | 1.29 ± 0.05 | 0.83 ± 0.04 | |
| NAWM | LGG | 0.42 ± 0.05 | 0.65 ± 0.07 | 1.24 ± 0.08 | 0.83 ± 0.07 |
| HGG | 0.42 ± 0.08 | 0.64 ± 0.08 | 1.23 ± 0.09 | 0.84 ± 0.06 |
- a DA = λ1, and DR = (λ2 + λ3)/2.
- b FA, fractional anisotropy; DR, radial diffusivity; DA, axial diffusivity; MD, mean diffusivity; LGG, low-grade glioma; HGG, high-grade glioma; NC tract, normal contralateral tract; tumor, within the tumorous tissue; tract, white matter tract adjacent to the tumor; NAWM, contralateral normal-appearing white matter; DTT, diffusion tensor tractography; ROI, regions of interest.
- c Different from NC tract (P < 0.05 pairwise t-test).
- d Different from NAWM (P < 0.05 pairwise t-test).
| ROI | Group | FA | DR | DA | MD |
|---|---|---|---|---|---|
| Tumor | t | −0.109 | 0.774 | 2.148 | 0.267 |
| Sig. | 0.915 | 0.468 | 0.048a | 0.793 | |
| Edema | t | 0.746 | −1.117 | −1.201 | −1.244 |
| Sig. | 0.467 | 0.282 | 0.248 | 0.233 | |
| Tract | t | 0.087 | −1.285 | −2.039 | −1.104 |
| Sig. | 0.932 | 0.218 | 0.047a | 0.287 |
- DA, axial diffusivity; DR, radial diffusivity; FA, fractional anisotropy; HGG, high-grade glioma; LGG, low-grade glioma; MD, mean diffusivity; ROI, regions of interest.
- a LGG is different from HGG (P < 0.05 pairwise t-test).
Discussion
Firstly, this study demonstrated that tractography was an effective method for detecting tumor-mediated alterations in WM architecture; the invaded tracts were mainly adjacent to the tumors in LGG patients, and the disrupted tracts were adjacent to the tumors in HGG patients. Secondly, we found that DA and Cl allowed for the differential diagnosis of LGG and HGG, and this technique may be complementary to the traditional use of FA and MD markers to distinguish between these types of tumors.
Diffusion tensor tractography is uniquely suited for providing information regarding the integrity of the tissue microstructure 1, 5, 14, which will help clinical physicians to determine the glioma grade and to differentiate between different types of tumors 1. Fiber tracking was performed in a manner such that the primary eigenvector represented the orientation of the axons in the WM, and the intervoxel connectivity was modeled using the primary eigenvector. The three eigenvalues (denoted as λ1, λ2, λ3) corresponded to the three diffusivities along the principal axes of the diffusion tensor, and the λ1(DA) was the eigenvector associated with the largest eigenvalue 15. The directional components that contributed to MD and FA in the WM could be separated according to their orientation along the WM tracts (DA) or perpendicular to the WM tracts (DR). The FA value represents the fraction of the tensor that can be assigned to anisotropic diffusion. In the current study, the decreased FA and increased MD values that were detected in the tumor-adjacent tracts, as compared to the contralateral side, for both LGG and HGG were likely due to Wallerian degeneration and destruction of myelin in myelinated axonal fibers 16. These alterations in the FA and MD values for the tumor-adjacent tracts were in agreement with the study by Ferda 6, which demonstrated an association between the character of the damage in the WM fibers and the change in the FA value owing to a combination of extracellular edema and infiltration by tumor elements.
DA and Cl (linearity) were introduced to indicate the “cigar-shaped” tensor ellipsoid (Westin Metrics) 13, 17. Therefore, our report extends these observations by exploring the changes in the DA and Cl to describe the nature of the tumor-adjacent tracts. We found larger decrease of DA and Cl in HGG than LGG group. The DA and Cl values were significantly different between cases of LGG and HGG, but the FA values were not. Therefore, we can imply the DA and Cl values might be complementary to FA values for the differential diagnosis of gliomas. One potential explanation of this result may be found by performing an objective evaluation of the real FA values of gliomas with different grades; as there are large inter-individual differences in FA, the comparison of FA values between the damaged area and the contralateral WM has been suggested 6. This finding may also help to explain the exact nature of WM involvement in gliomas, as the altered states of WM caused by the tumor may affect the measurement of diffusion tensor anisotropy and orientation 13, 17. In tumors with a high degree of myelin sheath disintegration, reduced anisotropy has been observed compared to the NAWM 6. The mechanism of this finding may involve numerous factors. Firstly, there was displacement of NAWM tracts by the expansive behavior of the tumor with relatively well-preserved anisotropy. Intact WM tracts resulting from bulk mass displacement by a tumor, such as a meningioma (Figure 1A), may retain normal anisotropy and remain identifiable in a new location 1, 6. However, the ipsilateral corticospinal tracts and superior longitudinal fasciculus surrounded the surface of the gliosarcoma owing to mechanical compression (Figure 3). Both cases showed normal-appearing tumor-adjacent tracts, but the pathological alterations in the tumor-adjacent tracts were completely different. In the patient with gliosarcoma, the DA, Cl, and FA values in the ipsilateral corticospinal tract were reduced to 32%, 35%, and 28.7%, respectively, as compared to the contralateral tract. This normal-appearing tract in the malignant tumor may account for the relatively mild functional deficit in these patients. Secondly, there were infiltrated fibers within the preserved pathway of the tracts, which demonstrated some loss of anisotropy but retention of sufficient directional organization such that the tract remained identifiable on directional DTI maps. The 3D tractography registered with FLAIR, as shown in Figure 2, revealed that the high T2 signal in the lesion of an LGG patient was spread along the WM tracts. Thirdly, the directional organization of the fiber tracts was disrupted by infiltrating tumors, resulting in a loss of directional organization and diffusion anisotropy 13. As shown in Figure 1C,D, the ipsilateral inferior longitudinal fasciculus, the ipsilateral corticospinal tracts, and the superior longitudinal fasciculus were disrupted by an astrocytoma (WHO III). Therefore, a combined mechanism, involving both the displacements and measurements of DA and Cl, would be proposed for a differential diagnosis. The decreased DA and Cl values resulted in a complete loss of anisotropy owing to complete Wallerian degeneration in the tracts.
One limitation of this study was the resolution of DTT at 2 × 2 × 2.5 mm, which led to substantial partial volume effects, including multiple populations of fibers with different orientations within a pixel. Another limitation was small number of patients, which could be solved by long-term collection. Additional limitations included the subjective selection of the regions for evaluating the diffusion parameters and the motion susceptibility of the high-resolution-segmented EPI approach, which limited its utility for uncooperative patients.
In conclusion, 3D tract reconstruction, which can provide sensitivity for detecting microstructural changes in the brain, may complement the identification of macrostructural changes by conventional MRI and allow for the differential diagnosis of brain tumors and related diseases. Quantitative fiber tracking can be used to determine various fiber parameters (FA, DA, DR, MD, and Cl) of WM structures using a fiber-tracking algorithm. This study showed that DA and Cl may be used as early markers to differentiate between LGG and HGG.
Acknowledgments
This work was supported by Key talent person project of Jiangsu province (the 12th 5-year plan of National Ministry of Health, RC2011013, B.Z.), Key project grant from Medical Science and technology development Foundation, Nanjing Department of Health (ZKX10006, B.Z.), The National Natural Science Foundation of China (30971010, 30670739, X.Y.), and the 973 Program from the Ministry of Science and Technology of China (2009CB21906, X.Y.).
Conflict of Interest
The authors declare no conflict of interest.


