Same same but different: A Web-based deep learning application revealed classifying features for the histopathologic distinction of cortical malformations
Abstract
Objective
The microscopic review of hematoxylin-eosin–stained images of focal cortical dysplasia type IIb and cortical tuber of tuberous sclerosis complex remains challenging. Both entities are distinct subtypes of human malformations of cortical development that share histopathological features consisting of neuronal dyslamination with dysmorphic neurons and balloon cells. We trained a convolutional neural network (CNN) to classify both entities and visualize the results. Additionally, we propose a new Web-based deep learning application as proof of concept of how deep learning could enter the pathologic routine.
Methods
A digital processing pipeline was developed for a series of 56 cases of focal cortical dysplasia type IIb and cortical tuber of tuberous sclerosis complex to obtain 4000 regions of interest and 200 000 subsamples with different zoom and rotation angles to train a neural network. Guided gradient-weighted class activation maps (Guided Grad-CAMs) were generated to visualize morphological features used by the CNN to distinguish both entities.
Results
Our best-performing network achieved 91% accuracy and 0.88 area under the receiver operating characteristic curve at the tile level for an unseen test set. Novel histopathologic patterns were found through the visualized Guided Grad-CAMs. These patterns were assembled into a classification score to augment decision-making in routine histopathology workup. This score was successfully validated by 11 expert neuropathologists and 12 nonexperts, boosting nonexperts to expert level performance.
Significance
Our newly developed Web application combines the visualization of whole slide images with the possibility of deep learning–aided classification between focal cortical dysplasia IIb and tuberous sclerosis complex. This approach will help to introduce deep learning applications and visualization for the histopathologic diagnosis of rare and difficult-to-classify brain lesions.
Key Points
- Deep learning algorithms aid histopathological diagnosis in difficult-to-classify epileptogenic brain lesions such as focal cortical dysplasia type IIb and tuberous sclerosis complex
- Classifying histology features were extracted from the convolutional neuronal network and blended into a simple-to-use scoring system for brightfield microscopy
- We developed an open-source, Web-based application for colleagues to use this algorithm in the histopathology routine
- Expert and nonexpert pathologists were invited to test the system; the performance of nonexperts was boosted to the expert level
1 INTRODUCTION
Deep learning has shown remarkable success in medical and nonmedical image-classification tasks in the past 5 years,1, 2 finding its way into applications for digital pathology such as classification, cell detection, and segmentation. Based on these tasks, more abstract functions like disease grading, prognosis prediction, and imaging biomarkers for genetic subtype identification have been established.4, 5 Successful examples include utilization in different types of cancer detection/classification/grading,6, 7 classification of liver cirrhosis,8 heart failure detection,9 and classification of Alzheimer plaques.10
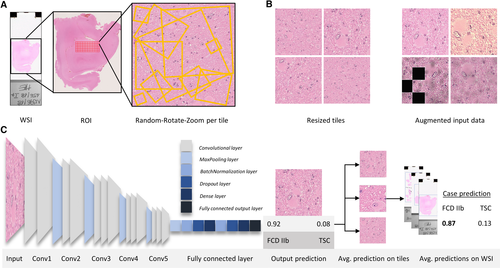
The most commonly used deep learning architectures are convolutional neural networks (CNNs; Figure 1C). CNNs are assembled as a sequence of levels consisting of convolutional layers and pooling layers, followed by fully connected layers with a problem-specific activation function in the end.11 Each convolutional layer consists of feature maps connected with an area of the previous layer and a set of specific weights for each feature map. The convolutional layer is followed by pooling layers, which compute the maximum or average of a group of feature maps. This pooling operation merges related values into features and reduces the dimension by taking input from multiple overlapping feature maps. This combination enables the CNN to correlate groups of local values to detect patterns as well as making motifs invariant to the exact location in the images.12 In other words, CNN will learn features in images without explicitly showing, segmenting, or marking important features in a given motif.
Malformations of cortical development (MCDs) represent common brain lesions in patients with drug-resistant focal epilepsy, and surgical resection is a beneficial treatment option.13, 14 Among the many MCD conditions described in the literature, focal cortical dysplasia (FCD) and cortical tuber of tuberous sclerosis complex (TSC) share histopathological communalities difficult to distinguish at the microscopic level. TSC is a variable neurocutaneous disorder involving benign tumors and hamartomatous lesions in different organ systems, most commonly in the brain, skin, and kidneys. TSC is caused by autosomal dominant mutations in the TSC1 (hamartin) and TSC2 (tuberin) genes. TSC is mainly diagnosed clinically if two major features or one major and two minor features are present, following the international TSC diagnostic criteria.15
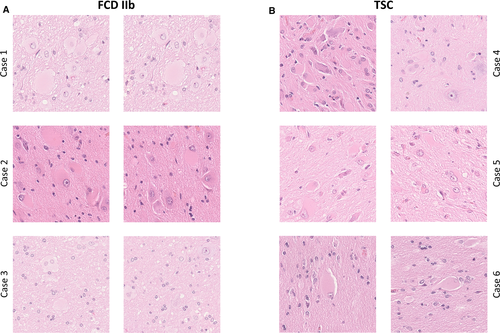
FCDs are a heterogenous subgroup of MCDs, which can be located throughout the cortex. FCDs can be classified using the three-tiered International League Against Epilepsy (ILAE) classification system, subdividing the FCDs based on histopathological findings including abnormal radial and tangential cortical lamination, dysmorphic neurons, balloon cells, and adjacent to other principal lesions.16 The subtype FCD IIb is histomorphologically characterized by dysmorphic neurons and balloon cells, disrupted cortical lamination, and blurred boundaries between gray and white matter.16 In routine histopathology workup, TSC can hardly be distinguished from FCD IIb; in particular, balloon cells are not discernible from giant cells in TSC patients. Additional histomorphologic similarities and differences include the following. In cortical tubers, a disrupted cortical lamination without discrimination of individual cortical layers as well as blurred gray and white matter boundaries can also be observed. A significant increase in heterotopic neurons in deep white matter can be detected in both entities.17 A decrease in neuronal densities in the region of dysplasia can be observed in TSC as well as FCD.17, 18 Microcalcifications are more common in cortical tubers, whereas they are rarely present in FCD.19 The astrocytic reaction in TSC is a topic of ongoing research.20, 21 For these reasons, stating a definite diagnosis based on the histomorphological findings alone is difficult (Figure 2).
In this study, we present a proof-of-concept deep learning approach to classify FCD IIb and TSC and to visualize the underlying distinguishing features, which currently are not reliably discernible by pathologists in hematoxylin-eosin (H&E)-stained slides. This process is possible by computing guided gradient-weighted class activation maps (Guided Grad-CAMs), which mark the important histomorphological features the CNN uses to distinguish these entities. In addition, we implemented a custom slide review platform and invited 11 expert neuropathologists as well as 12 nonexperts from 10 different countries to participate in a survey to distinguish FCD IIb and TSC at the H&E-stained whole-slide image (WSI) level. Our approach might be a powerful concept for classifying and analyzing difficult-to-diagnose pathologic entities and additionally gaining insight into what aids the diagnosis of CNNs, making deep learning more comprehensible for pathologists in the future.
2 MATERIALS AND METHODS
2.1 Dataset and region of interest
To train and evaluate our CNN, H&E-stained tissue slides of 56 patients, who had undergone epilepsy surgery and were diagnosed at the European Neuropathology Reference Center for Epilepsy Surgery, were collected. The samples were subsequently digitized using a Hamamatsu S60 scanner.
Overall, the dataset consisted of 141 WSIs from 56 patients, 28 patients with FCD IIb, and 28 patients with genetically confirmed TSC. H&E stainings were included due to the proven potential of CNNs to extract information not visible to the human observer in H&E slides,5, 22 thus eliminating the need for more complex and expensive immunostainings.
The whole dataset was divided into 50 cases used for training and validation along with six cases as an independent test set to evaluate the model's performance. We ensured that a patient was either in the training and validation set or the unseen test set.
The WSIs of our dataset were reviewed by two expert neuropathologists of the European reference center for epilepsy in Erlangen using the 2011 ILAE classification of FCD.16
The region of interest (ROI) on an individual slide was defined as areas with high balloon cell and/or dysmorphic neuron counts along with the surrounding white matter and deep cortical layers. This ROI selection improves the ability of the CNN to detect the most subtle features in histomorphologically challenging regions, while avoiding biases through insignificant areas in WSIs.
These ROIs were extracted at ×20 magnification and cropped into smaller tiles of 2041 × 2041 pixels, using QuPath,23 to further preprocess and feed into our model.
2.2 CNN architecture
A VGG16 CNN architecture pretrained on ImageNet was implemented,3 using the open-source Python packages Keras24 with TensorFlow backend. VGG16 was chosen because it yielded the best results with the least overfitting on a small training and validation subset out of several state-of-the-art network architectures, including NasNetMobile, Xception, DenseNet121, and ResNet50.25-28 The basic network architecture was not changed and consisted of one Input layer, five convolutional blocks each ending in a MaxPooling2D layer merging into a custom top layer beginning with a GlobalMaxPooling2D layer followed by two blocks of batch normalization,29 Dropout (0.5, 0.5) and Dense layers merging into the fully connected output layer (SoftMax activation to produce individual output probabilities; Figure 1C).
2.3 Preprocessing and data augmentation
Image preprocessing is an important step in every computer vision task to augment the number of samples, to prevent overfitting, and to support the model against invariant aspects that are not correlating with the label.30, 31 In our approach, we mixed our novel random-rotate-zoom technique with classical image augmentation techniques. The initial 2041 × 2041 ROIs were cropped at ×20 magnification. From these ROIs, new subsamples with random zoom and rotation were generated, resulting in subsamples of the initial tile scaled at ×0.1 to ×2, as shown in (Figure 2A, tile extraction and random-rotate-zoom example). These subsamples were then normalized and resized to obtain 300 × 300 pixel images. The 300 × 300 images were additionally augmented using the open-source, Python-based library, imgaug,32 with a random composition of shear, blur, sharpen, emboss, edge detect, dropout, elastic transformations, and color distortion including contrast adjustments, brightness changes, and permutation of hue (all augmentations applying to either the whole image or an area of the image; Figure 1B). This process is implemented through a custom Keras image generator. This image generator streams 50 training images, randomly generated, of every tile as an input into the CNN, using the described preprocessing method. By means of such procedures, there was no need to save any additional images to disk and, with random permutations on every training epoch, we maximized the learning efficacy and robustness of the neural network (Figure 4B).
2.4 Training and evaluation
Training was performed with a batch size of 128, using the Adam-Optimizer and a cyclic learning rate (cLR)33 oscillating between 10−8 and 10−3 every quarter epoch, with a schedule to drop the cLR if validation loss did not improve for 10 epochs. Training performance was controlled using accuracy, loss, and area under the curve (AUC) as metrics where plotted every epoch.
As a first step, base layer weights were frozen, only training the custom top layer with a cLR (10−3-10−5). In a second step, the whole model was trained including the base layers with a very low cLR (10−6-10−8), thus maintaining the basic image-classification patterns of the pretrained model and preventing overfitting. Model parameters were saved for every reduction of validation accuracy, and the best parameters were used for predictions on the unseen test set.
We further evaluated model performance with 10-fold cross-validation and a training and validation split of 0.9, while maintaining the original case distribution and without having any training and validation slide overlap.
To evaluate model performance on the unseen test set, tiles were generated using our random-rotate-zoom technique with 100 iterations on every test tile, which were then individually predicted and averaged to obtain the prediction of a WSI. In the next step, the predictions on multiple WSIs of one case were averaged to obtain the prognosis for the whole case (Figure 1C, prediction process). To further assess testing performance, the classification results were evaluated by accuracy, adjusted geometric mean, area under the receiver operating characteristic curve (AUCROC), sensitivity, precision, and F1 score (harmonic mean of precision and sensitivity).
2.5 Visualization
Grad-CAMs and Guided Grad-CAMs have been shown to be useful tools to understand how the model is analyzing the images and revealing the features of relevance for the classification task.34, 35 Grad-CAMs are a form of localization maps based on a given image passing through the trained model to generate the class gradient, setting all other class gradients except the class of interest to zero and backpropagating the rectified convolutional features to compute a Grad-CAM.35 Depending on the convolutional layer, different degrees of detailed spatial information and higher-level semantics are displayed. According to the original paper, we expected the penultimate convolutional layer (block5_conv3) to have the best visualization results for our purpose. This Grad-CAM can be visualized using different colormaps to better understand at which regions of a given image the model is focusing. Guided Grad-CAM is a combination of Grad-CAM’s “heatmaps” and guided backpropagation merged with pointwise multiplication to achieve pixel-level resolution of discriminative features.35 We performed our studies based on Gildenblats' open-source implementations of Grad-CAM and Guided Grad-CAM for Keras,36 using our own models and adaptations of the code for our task-specific problems.
This combination formed an optimal foundation to gain insight into which histomorphological features at the region and pixel level, not discernible to the human eye, were relevant to distinguish between these two entities.
2.6 Slide review and online survey
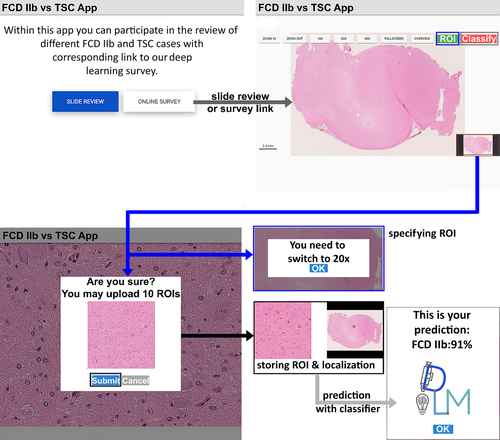
We invited 12 nonexperts and 11 expert neuropathologists from 10 different countries to participate in a survey to histopathologically distinguish TSC from FCD IIb samples using H&E staining only. The nonexpert cohort was composed of pathology residents, anatomy department faculty, and medical students. None of them had previous experience in neuropathology and were given, therefore, a short introduction to what histomorphological findings are typical in both entities. We developed a custom Web application for online slide review using Django and VueJs frameworks and openslide for WSI visualization. A three-step, Web-based review and agreement system was offered. In the first round, 20 H&E specimens representing 20 cases had to be microscopically reviewed by both groups without any further information. All participants could answer "FCD IIb," "TSC," and "I don't know" to prevent guessing. These answers were collected with a LimeSurvey questionnaire. None of the reviewers had access to the results of the other reviewers. The same set of slides were presented in random order in the second round together with the four-tier score of distinguishing features extracted from our CNN visualization. Answers were collected with the same LimeSurvey answering catalog. All reviewers were instructed to also take snapshots at ×20 magnification of regions they deemed important and submit the images from these regions via the Web application. We then implemented an online classifier into the application that incorporated the trained model on the server side. The online classifier worked as follows. An image could be taken directly from a WSI at ×20 magnification and a predefined size at review and was subsequently stored on the server and classified by the integrated model. In this way, we ensured that the image fulfilled certain quality criteria prior to prediction by the model to obtain an averaged diagnosis over all the ROIs of one WSI of one review participant (Figure 3). In the third step, we invited all reviewers to test the online classifier using their previously defined ROIs from the second round.
2.7 Hardware
We implemented our approach on a local server running Ubuntu (18.04 LTS) with one NVIDIA GeForce GTX 1080Ti and one NVIDIA Titan XP, AMD CPU (AMD Ryzen Threadripper 1950X 16 × 3.40 GHz), 128 Gb RAM, CUDA 10.0, and cuDNN 7.
2.8 Availability and implementation
The datasets generated and analyzed during the presented study are not publicly available, but parts of the pipeline used in this project including training and visualization are available on our project homepage (https://github.com/FAU-DLM/FCDIIb_TSC).
3 RESULTS
3.1 Validation and test performance
All CNNs were trained to classify the ROIs containing balloon cells and giant cells of FCD IIb and cortical tuber, respectively, as well as surrounding tissue. First, we performed a study to determine which model to use for our classification task, ranging from VGG16 to models with more trainable parameters, that is, ResNet50, DenseNet121, NasNetMobile, and Xception. We evaluated all of these models on a small training and validation subset, with validation accuracy ranging from 75% (Xception) to 92% (VGG16) after 40 epochs (Figure S1B). We decided to implement VGG16 for our approach, as it yielded the best validation results with little overfitting on the validation subset, low training times, and good architecture for visualization. In the next study, we compared our random-rotate-zoom preprocessing method with a direct ROI extraction of 300 × 300 pixel tiles on another training and validation subset to determine whether our approach improves classification performance and prevents overfitting. The results showed the superiority of the random-rotate-zoom technique over direct ROI extraction, as validation accuracy was higher (Figure S1A).
Based on these studies, we built our final VGG16 model with a custom top layer for extended batch normalization with random-rotate-zoom preprocessing and additional data augmentation (Figure 1C). To assess the whole training set and select the best-performing model for our final prediction, we evaluated our models via 10-fold cross-validation. The overall cross-validation performance is shown in Figure 4A, with validation accuracy averaging at 94% (91%-97%) and AUCROC averaging 0.91 (0.89-0.95). During training, validation accuracy mostly stayed above training accuracy, and validation loss stayed below training loss values, indicating little to no overfitting on the training dataset.
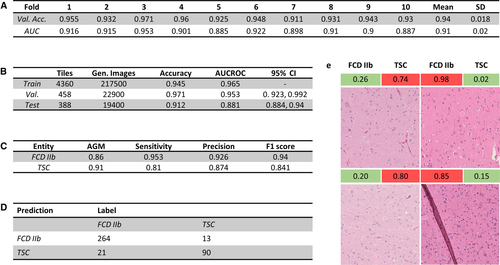
The best-performing model in cross-validation was picked to classify the unseen test set, scoring an overall accuracy of 91.2% on the tile level while not misclassifying a single case in our unseen test set (Figure 4C). Additional performance metrics from testing are shown in Figure 4C. The confusion matrix for the single tile predictions on the holdout test set is shown in Figure 4D. The results indicated a good overall performance for a classification task not easy to accomplish even for expert neuropathologists.
To analyze problems and pitfalls of the trained CNN, resident neuropathologists reviewed the most confident wrongly classified tiles (tiles with a high accuracy for the wrong label) to depict possible disruptive factors. The inspection of misclassified tiles showed folding (2/34) and stripy artifacts (6/34) due to tissue processing as well as some areas being slightly out of focus, thereby making it more difficult to classify on a per tile basis (Figure 4E).
3.2 Model visualization
We further investigated morphological features relevant to the classification task of both FCD IIb and TSC using Grad-CAMs and Guided Grad-CAMs. A total of 10 000 Grad-CAM and Guided Grad-CAM heatmaps were generated and reviewed by three resident neuropathologists. Although ROIs extracted via random-rotate-zoom reveal better classification results for visualization purposes, a stable magnification level turned out to be better for the generation of accurate heatmaps (data not shown). This result is expected, as the model can fit more precisely to a single magnification level but does not generalize as well when tested on the unseen test set.
The analysis of the generated Guided Grad-CAMs revealed matrix reaction as an important feature distinguishing between cortical tuber and FCD IIb. In TSC patients, the matrix reaction was fibrillar and strandlike throughout our visualized test set (Figure 5A). In contrast, the matrix reaction in FCD IIb specimens was diffuse and granular. Another new feature was that astrocytes and their nuclei played an important role in the morphological distinction between FCD IIb and TSC. Smaller nuclei of astrocytes with more condensed chromatin were a hallmark of FCD IIb (Figure 5B), whereas larger nuclei of astrocytes with uncondensed chromatin structure were mainly found in TSC (Figure 5B).
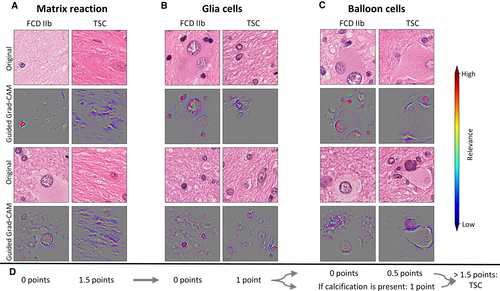
Surprisingly, balloon cells themselves were hardly focused on for the distinction of these two entities. The CNN often focused on the cytoplasm, cell wall, and some chromatin sprinkles of balloon cells in TSC patients. An interesting finding in TSC patients was halo artifacts around balloon cells occurring in the majority of our dataset (Figure 5C). It is important to note that the CNN, even in images with artifacts like marker or small empty areas, did not target these structures to classify the tile.
After analyzing and recognizing these patterns, our next task was to assemble these findings into a classifying score applicable in the routine diagnostic workup. We empirically developed the classifying score based on the frequency of observed patterns and ranked points thereof. A sum of >1.5 points would be in favor of TSC as a final diagnosis (Figure 5D). The four categories and their value for the classification system were as follows: (1) different matrix reactions were most frequently seen in the visualized test set; 1.5 points were granted if TSC's bulky and strandlike matrix reaction was observed in a WSI (Figure 5C); (2) a distinct feature of astrocytes was uncondensed and bigger nuclei in TSC samples, which was frequently recognized, thus contributing 1 point to the score; (3) the halolike balloon cell artifacts in TSC samples were granted 0.5 points and were less often evident; and (4) the presence of calcification is suggestive for TSC and rarely seen in FCD IIb; it was thus granted 1 point.19
4 SLIDE REVIEW AND ONLINE SURVEY
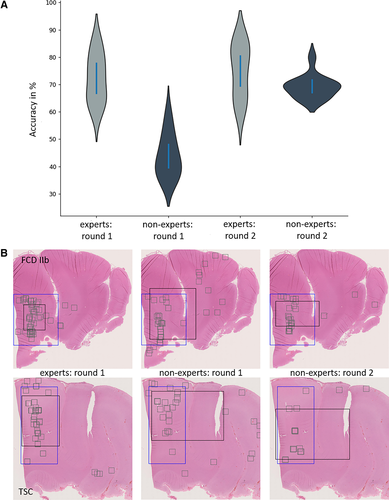
We statistically analyzed the 20 case reviews (10 FCD IIb and 10 TSC, shuffled after the first round) of both experts and nonexperts. The baseline accuracy in our expert cohort was 72.3% and improved by 4% to 76.5% (statically nonsignificant; paired t test, P = .49). The nonexpert group had a baseline accuracy of 43.8%, which improved significantly by 25.4% to 69.2% (paired t test, P < .001). Both cohorts differed statistically significantly in the first round (P < .001), but the difference was statistically nonsignificant in our second round of review (unpaired t test, P = .17; Table S1). It is also interesting to note that the nonexpert group chose more ROIs in the region of pathology, with a more homogenous distribution and smaller averaged areas in the second round when using the deep learning–based classification score (Figure 6B).
5 DISCUSSION
We developed a deep learning approach to help diagnose difficult-to-classify histopathologic entities and used CNNs to extract novel distinguishing features. We then used this information to develop a classification score that was validated through a new Web-based application for histopathology diagnostics.
First, we evaluated different state-of-the-art model architectures to identify the most suitable for our purpose in terms of (1) best classification results, (2) least overfitting, and (3) best to visualize. Among all evaluated networks, we chose VGG, as it accomplished these needs (see Results). It is interesting to note, however, that models with higher network parameter counts and more complex architectures overfitted the given training data.37 In addition, VGG16 visualization through Guided Grad-CAMs has recently been used in successful applications in medical research.38 The next step was to augment our use-case dataset through appropriate preprocessing. Small datasets are of major concern for deep learning tasks and likely result in overfitting to the given training data, yielding inaccurate results in the independent test set.39 We could show the benefit of effectively multiplying our data by a new random-rotate-zoom technique in addition to classical image preprocessing from direct patch extraction for the given task. This protocol is informed by daily histopathology practice using different optical zoom ranges of the microscope to extract all available histomorphological information. Further and independent work is needed, however, to confirm the benefit of such a preprocessing pipeline over direct patch extraction for deep learning tasks in digital pathology.
Another important goal was to extract classifying features from our model using the Guided Grad-CAM approach. Interestingly, the extracted features were recognizable by our pathologists and translated into a new classification scheme. Patterns of matrix reaction and a halo artifact around balloon cells were novel and not yet described. The feature of condensed nuclei of astrocytes in FCD IIb compared to the uncondensed and bigger nuclei of astrocytes in TSC confirmed prior studies of the role of astrocytes in TSC and represented also a stable histomorphologic correlate in H&E-stained sections.20, 21 Finally, the deep learning–derived histopathology criteria were confirmed in an independent review trial with expert neuropathologists and nonexperts in which the classification performance of the nonexpert group was boosted to an expert level, which was not significantly different from the expert group.
5.1 Limitations and potential solutions moving into the future
A well-recognized obstacle in digital pathology represents batch effects including variation in staining intensity or fixation artifacts.10, 40 We contained such batch effects in our input data through hand-picked ROIs and normalization. However, more sophisticated H&E normalization standards needed to be developed to allow a comprehensive application of deep learning for the large spectrum of disease conditions.41 In addition, integration of cell-type–specific brain somatic gene information into disease classification will advance inter- and intraobserver consistency of histopathology diagnosis as well as a better understanding of underlying pathomechanisms.42
Cortical tubers resected in clinically established TSC are not always uniform, however, and can be split into different subtypes with the possibility of different pathogenetic mechanisms.43 In FCD IIb, common pathogenetic mechanisms with TSC are discussed in numerous studies.44, 45 In our study, we focused on the search for different stable histomorphologic patterns throughout both entities, hence no further subdivision was required. Overall, the ground truth is a relevant topic in state-of-the-art supervised deep learning approaches, as the labeled “gold standard” data vary in terms of interobserver agreement.46
Further groundwork needs to be done to increase the interobserver agreement, possibly through the development of finer visualization techniques and the adoption of unsupervised deep learning methods that help separate subtypes without the need for labeled data.
Our dataset was small with respect to deep learning standards, especially when compared to datasets collected by Imagenet, with a compilation of million images and thousands of unique samples per class.47 But this will be an impossible task when studying rare brain diseases. Our dataset of 56 cases is extraordinarily large. It was collected with the help of the archives of the European Epilepsy Brain Bank48 and exceeded many previous endeavors in size and sophistication of preprocessing. Such sample numbers exceed what most pathologists will see in their lifetime. Hence, we call for multicenter collaborations to obtain sufficiently large datasets to train sophisticated models for rare entities in the field of epilepsy-pathology and to develop open-access online tools for consultation if a certain disease is suspected. Although such online tools are not yet approved for diagnostic use, the positive feedback from our user cohorts is most promising. Further questioning revealed that the underlying visualization techniques (Guided Grad-CAMs) have aided particularly the nonexpert cohort to advance the idea of the underlying pathology. We can imagine facilitating elaborated classification and visualization methods as teaching tools for medical students and pathology trainees. We hope to help disseminate Web-based digital pathology tools into regions of the world where genetic testing or advanced neuropathology expertise is not a common or even available standard.49, 50
In conclusion, our study demonstrated the successful use of deep learning in the diagnosis of histomorphologically difficult-to-classify MCD entities. Morphological features learned by the system and relevant for the classification of FCD IIb and cortical tuber were then integrated into a four-tiered classification score successfully validated through a Web-based application, thereby boosting the yield of diagnostic accuracy in a nonexpert group to expert level performance. These results are promising and will help to amplify CNN visualization and deep learning methodologies in the arena of digital pathology.
ACKNOWLEDGMENTS
The present work was performed in fulfillment of the requirements of Friedrich-Alexander University Erlangen-Nürnberg for J.K. to obtain a Dr Med degree. We thank NVIDIA for the donation of a Titan XP.
CONFLICT OF INTEREST
None of the authors has any conflict of interest to disclose. We confirm that we have read the Journal's position on issues involved in ethical publication and affirm that this report is consistent with those guidelines.
AUTHOR CONTRIBUTIONS
I.B., R.C., S.J., and J.K. conceived the presented idea. S.J. and J.K. wrote the code, designed the model and computational framework, and analyzed the data. J.K. and S.J. wrote the manuscript in consultation with I.B. and R.C., who also provided clinical and neuropathologic data interpretation and case selection. R.C., I.B., A.M.-F., F.S., H.M., P.N., M.H., F.R., S.-H.K., E.A., R.G., S.V., A.P., S.W., C.N., M.S., S.K., V.S., S.R., P.E., M.E., A.B., and K.K. contributed to the slide review, critical data analysis, and interpretation of the results. All authors provided critical feedback and commented on the manuscript.


