Upregulated SPAG6 correlates with increased STAT1 and is associated with reduced sensitivity of interferon-α response in BCR::ABL1 negative myeloproliferative neoplasms
Abstract
Sperm-associated antigen 6 (SPAG6) has been identified as an oncogene or tumor suppressor in various types of human cancer. However, the role of SPAG6 in BCR::ABL1 negative myeloproliferative neoplasms (MPNs) remains unclear. Herein, we found that SPAG6 was upregulated at the mRNA level in primary MPN cells and MPN-derived leukemia cell lines. The SPAG6 protein was primarily located in the cytoplasm around the nucleus and positively correlated with β-tubulin expression. In vitro, forced expression of SPAG6 increased cell clone formation and promoted G1 to S cell cycle progression. Downregulation of SPAG6 promoted apoptosis, reduced G1 to S phase transition, and impaired cell proliferation and cytokine release accompanied by downregulated signal transducer and activator of transcription 1 (STAT1) expression. Furthermore, the inhibitory effect of interferon-α (INF-α) on the primary MPN cells with high SPAG6 expression was decreased. Downregulation of SPAG6 enhanced STAT1 induction, thus enhancing the proapoptotic and cell cycle arrest effects of INF-α both in vitro and in vivo. Finally, a decrease in SPAG6 protein expression was noted when the STAT1 signaling was blocked. Chromatin immunoprecipitation assays indicated that STAT1 protein could bind to the SPAG6 promoter, while the dual-luciferase reporter assay indicated that STAT1 could promote the expression of SPAG6. Our results substantiate the relationship between upregulated SPAG6, increased STAT1, and reduced sensitivity to INF-α response in MPN.
Abbreviations
-
- AML
-
- acute leukemia
-
- BMMC
-
- bone marrow mononuclear cell
-
- CALR
-
- calreticulin
-
- CDK4
-
- cyclin-dependent kinase 4
-
- ET
-
- essential thrombocythemia
-
- IDA
-
- iron deficiency anemia
-
- IgG
-
- immunoglobulin G
-
- IL
-
- interleukin
-
- IMDM
-
- Iscove's modified Dulbecco's medium
-
- INF
-
- interferon
-
- IP
-
- immunoprecipitation
-
- MDS
-
- myelodysplastic syndrome
-
- MPL
-
- thrombopoietin receptor
-
- MPN
-
- myeloproliferative neoplasm
-
- PCNA
-
- proliferating cell nuclear antigen
-
- PMF
-
- primary myelofibrosis
-
- PV
-
- polycythemia vera
-
- qPCR
-
- quantitative PCR
-
- ROC
-
- receiver operating characteristic
-
- shCtrl
-
- negative control virus
-
- SPAG6
-
- sperm-associated antigen 6
-
- STAT
-
- signal transducer and activator of transcription
-
- TNF-α
-
- tumor necrosis factor-α
1 INTRODUCTION
Myeloproliferative neoplasms are hematological malignancies with a chronic clinical course and risk of thrombosis and transformation to acute leukemia. Polycythemia vera, ET, and PMF are the three main entities of classical breakpoint cluster region BCR::ABL1 negative MPNs.1 It has been established that three mutually exclusive driver mutations responsible for the constitutive activation of the JAK/STAT signaling pathway occur in the genes encoding for JAK2, MPL, or CALR, with the JAK2V617F mutation being the most frequent (PV ≥ 95%; ET/PMF approximately 50%–60%)2 contributing to disease phenotype, transformation, and progression.3
Current treatment regimens for MPN involve cytoreductive therapy, aspirin, and novel drugs targeting specific gene mutations.4, 5 Although the novel JAK inhibitors have demonstrated rapid and sustained reductions in splenomegaly and improvements in constitutional symptoms and quality of life irrespective of the mutational background, they have shown limited impact in inducing complete hematological remissions with normalization of blood counts or reverse bone marrow fibrosis.6, 7 Interferon-α is a cytokine that can bind to the heterodimeric INF-α receptor and induce TYK2- and JAK1-mediated phosphorylation of STAT1 and other STAT proteins, thus promoting expression of genes under the control of the INF-stimulated response elements with antiviral and antitumor properties.8, 9 Previous studies on MPN have highlighted the ability of INF-α to induce significant clinical, hematological, molecular, and histopathological responses, either in its unmodified or pegylated form.10-12 Despite its efficacy in molecular response and potential disease-modifying capabilities, INF-α carries the risk of adverse events, including autoimmunity, liver toxicity, and depression.11, 12 This raises questions on the optimal therapeutic dose for patients to improve tolerability. However, molecular markers for assessing response have been lacking. Therefore, it is of great clinical significance to identify novel biomarkers for predicting the sensitivity of MPNs to interferon therapy and optimizing individual treatment strategies.
Mammalian SPAG6 was initially identified as a cancer-testis antigen13 and subsequently found to act as an oncogene or tumor suppressor in human cancers. Some studies have indicated that the promoter of SPAG6 genes is methylated in bladder, lung, and breast cancers and neuroblastoma cell lines,14-17 resulting in gene silencing. In contrast, the expression levels of SPAG6 in hematological malignancies MDS,18 MPN,19 lymphoma,20 and AML21 have been reported to be upregulated. Aberrant expression of SPAG6 could affect the occurrence and development of human cancer by regulating the apoptosis, proliferation, metastasis, and invasion of tumor cells and confers a worse clinical prognosis.21-24 In addition, downregulation of SPAG6 was found to enhance the effect of apoptosis-inducing drugs,25 while overexpression of SPAG6 might be the reason why some cancers are resistant to microtubule-targeting medicine,26 suggesting that SPAG6 expression might affect the efficacy of antineoplastic agents.
To the best of our knowledge, the role of SPAG6 in the initiation and progression of MPN and its underlying mechanism have not been previously described. In the present study, we provide hitherto undocumented evidence of the significant upregulation of SPAG6 in MPN-derived leukemia cells regulated by STAT1, yielding pro-oncogenic effects. Moreover, we substantiate that downregulation of SPAG6 could impair the autocrine function of inflammatory cytokines, reduce reactivation of the JAK-STAT pathway, and sensitize the INF-α response by promoting STAT1 induction in MPN.
2 MATERIALS AND METHODS
2.1 Patient samples
Bone marrow mononuclear cells were collected from newly diagnosed patients with MPN (ET = 34; PV = 11) and controls (normal/healthy donor = 6; IDA = 20) at the Hematology Department of the First Affiliated Hospital of Chongqing Medical University between 2021 and 2022. The demographic information and clinical data of each patient and control were collected by clinical specialists and summarized in Tables 1 and S1, respectively. The BMMCs were extracted by density gradient centrifugation using Lymphoprep (BD Biosciences) and cultured in DMEM medium containing 10% FBS (PAN Biotech).
| Variable | SPAG6-low | SPAG6-high | p value |
|---|---|---|---|
| Number of patients (total) | 22 | 23 | 0.666 |
| ET, n (%) | 16 (72.7) | 18 (78.3) | |
| PV, n (%) | 6 (27.3) | 5 (21.7) | |
| Male/female, n (%) | 11/11 (50.0/50.0) | 11/12 (47.8/52.2) | 0.884 |
| Age (years), mean (range) | 52.14 (27–79) | 49.26 (19–77) | 0.593 |
| At diagnosis | |||
| WBC (×109/L), mean (range) | 13.47 (4.54–32.87) | 12.57 (5.89–23.18) | 0.635 |
| Hemoglobin (g/L), mean (range) | 150.95 (108–206) | 147.82 (114–201) | 0.714 |
| Platelet count (×109/L), mean(range) | 691.63 (173–1368) | 867.43 (320–1971) | 0.119 |
| Gene mutation, n (%) | 0.136 | ||
| JAK2 | 17 (77.3) | 12 (52.1) | |
| ET | 11 (50.0) | 7 (30.4) | |
| PV | 6 (27.3) | 5 (21.7) | |
| CALR | 2 (9.1) | 4 (17.4) | |
| ET | 2 (9.1) | 4 (17.4) | |
| PV | 0 (0.0) | 0 (0.0) | |
| MPL | 1 (4.5) | 1 (4.3) | |
| ET | 1 (4.5) | 1 (4.3) | |
| PV | 0 (0.0) | 0 (0.0) | |
| Triple-negative | 2 (9.1) | 6 (26.1) | |
| ET | 2 (9.1) | 6 (26.1) | |
| PV | 0 (0.0) | 0 (0.0) | |
| Interferon inhibition rate, % | 55.08 (39.79–67.41) | 49.20 (32.04–66.93) | 0.039 |
- Abbreviations: ET, essential thrombocythemia; PV, polycythemia vera; SPAG6, sperm-associated antigen 6; WBC, white blood cell count.
2.2 Cell lines and cell culture
Human leukemia cell lines THP-1, CCRF, SKM-1, HL-60, K562, BALL, and HEL.92.1.7 were cryopreserved by our team. Specifically, THP-1, CCRF, SKM-1, BALL, and HEL.92.1.7 cells were cultured in RPMI-1640 medium containing 10% FBS (PAN Biotech), HL-60 cells were cultured in IMDM medium containing 20% FBS (PAN Biotech), and K562 cells were cultured in IMDM medium containing 10% FBS (PAN Biotech). Human MPN-derived leukemia cell lines SET-2 and UKE-1 were donated by Professor Zhijian Xiao, Chinese Academy of Medical Sciences and Peking Union Medical College. SET-2 cells were cultured in RPMI-1640 medium containing 20% FBS (Gibco), and UKE-1 cells were cultured in IMDM supplemented with 10% FBS (Gibco), 10% horse serum (Procell), and 1 mM hydrocortisone (STEMCELL Technologies). Cells were all cultured at 37°C in a humidified incubator with 5% CO2.
2.3 Knockdown, forced expression of target genes
The lentiviral vectors were purchased from Gene Pharma. The coding sequences of overexpressed human SPAG6 were cloned into LV5 (EF-1a/GFP and Puro) vector. The shRNA of lentivirus targeting the human SPAG6 mRNA sequence (5′-GCCATAAAGAATATCCTGCAA-3′) and its negative control (5′-TTCTCCGAACGTGTCACGT-3′) were cloned into LV3 (H1/GFP and Puro) vector. The sequences of siRNA for STAT1 were synthesized by Gene Pharma, provided in Table S2. Transfection was carried out according to the manufacturer's instructions.
2.4 Plasmid construction and dual luciferase reporter assay
The SPAG6 promoter-luciferase reporter plasmid (psiCheck2-SPAG6-promoter) containing the SPAG6 promoter region was constructed in the psiCheck2 plasmid. Gene STAT1 (NM_001384880.1) was inserted into plasmid pcDNA3.1 to construct the STAT1 overexpression plasmid (pcDNA3.1-STAT1). Luciferase reporter plasmids carrying WT SPAG6 promoter were cotransfected with either STAT1 overexpression plasmids or vector control plasmids in 293T cells. A dual luciferase reporter assay (Promega) was undertaken according to the manufacturer's instructions.
2.5 Chromatin immunoprecipitation assay
SET-2 cells were cross-linked with 1% formaldehyde for 10 min at room temperature and terminated by adding glycine (1.25 M). Fixed cells were harvested in an SDS buffer with a protease inhibitor and then sonicated to generate DNA fragments of 200–1000 bp in length. The sheared chromatin-lysed extracts were incubated overnight at 4°C with the anti-STAT1 Ab or controls (anti-RNA polymerase II Ab/rabbit IgG) with rotation. After IP of the cross-linked protein/DNA complexes, the cross-linking was reversed to release the DNA. Polymerase chain reaction was carried out with the input DNA or the immune precipitate products, and the primers used are listed in Table S1. The PCR products were then separated by agarose gel electrophoresis.
2.6 Animal model
Female BALB/ca-nu mice (4 weeks) were purchased from Beijing HFK Bioscience Co., Ltd and raised under specific pathogen-free conditions. SET-2-shSPAG6 and SET-2-shCtrl xenograft mice were established by s.c. injecting approximately 10 million cells into the flanks of 5-week-old mice. After 3 days, mice were randomized into control or drug treatment groups and treated with saline solution or 3 μg/kg peg-interferon α-2b every week for 4 weeks. Tumor size and bodyweight were measured twice a week. Tumors were removed, measured, and weighed after drug treatment for 28 days. Tumor volumes were calculated using the formula: V = 1/2(L × W2), where L represents length and W represents width. Mouse femurs, internal organs, and the xenograft tumors were collected and soaked in 4% paraformaldehyde (femurs were then slowly decalcified) and were embedded in paraffin, sectioned (thickness 3 μm), and dewaxed. Mouse tissues were stained with H&E. The histological examination was carried out on tumor sections after TUNEL, immunohistochemical, and immunofluorescent staining, as described previously.19 More information on the Abs used is provided in Table S3.
The detailed methods for RT-qPCR, western blot analysis, immunocytochemistry and double immunofluorescence, measurement of cytokines, cell viability assay, apoptosis and cell cycle assay, colony formation assay, and statistical analysis are described in Data S1.
3 RESULTS
3.1 Downregulation of SPAG6 impairs cell proliferation and cytokine release, promotes apoptosis, and reduces G1 to S phase transition
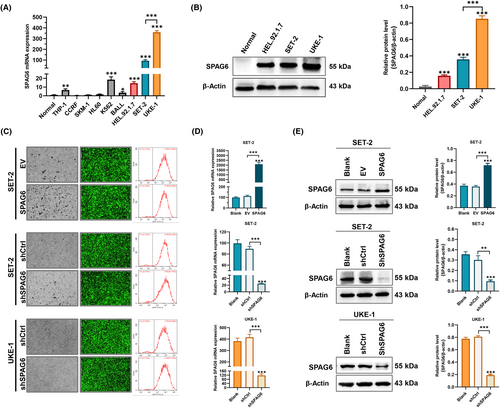
Initially, we detected the SPAG6 mRNA expression levels in healthy donors and leukemia cell lines THP-1, CCRF, SKM-1, HL-60, K562, BALL, HEL.92.1.7, SET-2, and UKE-1, and found that SPAG6 mRNA was highly expressed in K562, HEL.92.1.7, SET-2, and UKE-1 cells (Figure 1A). HEL.92.1.7, SET-2, and UKE-1 cells are commonly used for research on the underlying mechanisms of MPN. To support our findings, a western blot experiment was undertaken to confirm the upregulation of SPAG6 protein expression in the above three cell lines (Figure 1B). Then we successfully established stable cell lines of SET-2 and UKE-1 with either SPAG6 overexpression or SPAG6 knockdown. These cell lines were derived from MPN patients with known medical histories, making them more representative of MPN biology. UKE-1 cells with the highest SPAG6 expression were only transfected with lentivirus encoding shRNA against SPAG6 and its control virus. Transfection efficiencies of the established cell lines were assessed by fluorescence microscopy and flow cytometry, revealing that the efficiencies were >90% (Figure 1C). The RT-qPCR and western blot analysis validated the successful overexpression or knockdown of the mRNA (Figure 1D) and protein (Figure 1E) expression levels of SPAG6.
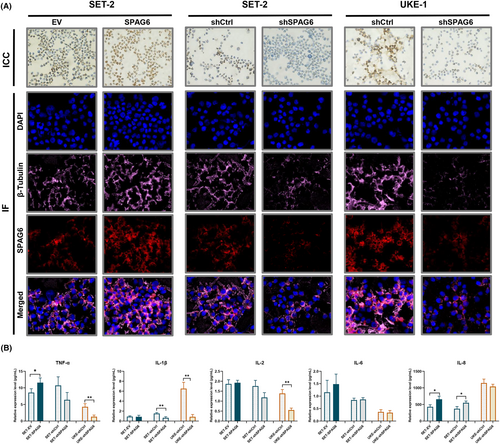
Immunocytochemical and double immunofluorescence staining was used to clarify the subcellular localization patterns of the SPAG6 protein. The findings revealed that SPAG6, a microtubule-associated protein,22 showed nucleic and cytoplasmic subcellular localization patterns but was primarily located in the cytoplasm around the nucleus (Figure 2A) and was positively correlated with β-tubulin expression (Figure 2A, lower panels). To further elucidate whether SPAG6 affects the autocrine function of MPN-derived cells by regulating the microtubule system, inflammatory cytokines in culture supernatants were analyzed (Figure 2B). In SET-2 cells, overexpression of SPAG6 increased the concentration of TNF-α. In contrast, knocking down SPAG6 led to a decrease in the concentration of IL-1β. Interestingly, both overexpression and knockdown of SPAG6 resulted in increased levels of IL-8. In UKE-1 cells, the levels of TNF-α, IL-1β, and IL-2 in the UKE-shSPAG6 group were significantly lower compared to the UKE-shCtrl group. This indicates that knocking down SPAG6 in UKE-1 cells resulted in a decrease in the levels of TNF-α, IL-1β, and IL-2.
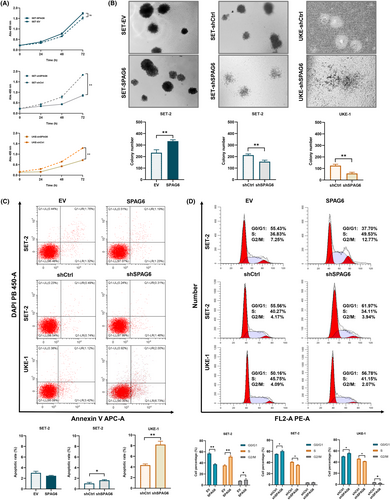
To investigate the biological effects of SPAG6 on MPN cells, CCK-8, colony formation, apoptosis, and cell cycle assays were carried out in the aforementioned cells. As shown in Figure 3A, the CCK-8 assay confirmed that the knockdown of SPAG6 in SET-2 and UKE-1 cells could significantly inhibit cell proliferation ability. In contrast, forced expression of SPAG6 had no major impact on SET-2 cell proliferation over time. The methylcellulose-based colony formation assay verified that forced expression of SPAG6 in SET-2 cells resulted in a significant increase in the number of clones, while knockdown of SPAG6 in SET-2 and UKE-1 cells showed an opposite effect (Figure 3B). Furthermore, forced expression of SPAG6 in SET-2 cells showed no significant effect on either percentage of annexin V+/DAPI− early apoptotic cells or annexin V+/DAPI+ late apoptotic cells, but downregulation of SPAG6 in SET-2 and UKE-1 cells significantly increased the percentage of total apoptotic cells (Figure 3C). In addition, flow cytometry showed that forced expression of SPAG6 in SET-2 cells promoted G1 to S cell cycle progression, while inhibition of SPAG6 promoted G1/G0 phase arrest in SET-2 and UKE-1 cells (Figure 3D).
3.2 Downregulation of SPAG6 sensitizes MPN cells for INF-α response in vitro
There is an increasing consensus suggesting that INF-α is important in MPN treatment.10-12 Accordingly, we sought to investigate whether SPAG6 expression affected the response of MPN to INF-α. First, we determined the inhibitory effect of INF-α on MPN-derived leukemia cells. As shown in Figure 4A, downregulation of SPAG6 could increase the inhibitory effect of INF-α on SET-2 and UKE-1 cells, resulting in a significant decrease in the IC50 value in shSPAG6 groups (SET-2, IC50 = 59.89; UKE-1, IC50 = 26.57) compared with the shCtrl groups (SET-2, IC50 = 98.04; UKE-1, IC50 = 61.75). Nevertheless, overexpression of SPAG6 in SET-2 cells had no significant impact on the inhibitory effect of INF-α. To standardize the experimental conditions, we used the IC50 concentration of INF-α in each group for subsequent experiments. The peak inhibition effects of INF-α were reached at 48 h. Meanwhile, the peak inhibition effects were maintained for 72 h in the shSPAG6 groups, but the inhibitory effects of the SPAG6 overexpression and control groups decreased at 72 h.
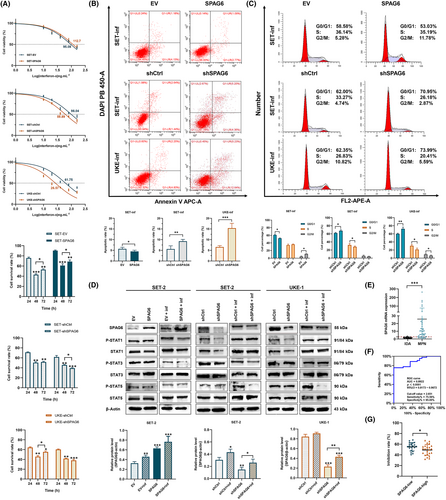
Cells were then treated with the IC50 concentration of INF-α in each group for 48 h; the apoptosis rate and cell cycle were detected by flow cytometry. The results showed a significant increase in apoptotic rate (Figure 4B) and percentage of cells in the G1 phase (Figure 4C) treated with INF-α. Importantly, the INF-treated SPAG6-knockdown groups displayed the highest levels of G1/G0 phase arrest and apoptosis, while forced expression of SPAG6 showed the opposite effect. As various STAT proteins are involved in INF-α signaling and crucial to determine the effects of INF-α response,8, 9 we examined the primary STAT proteins and their phosphorylation levels (Figure 4D). Western blot analysis showed that the expressions of STAT1 and p-STAT1 were decreased following SPAG6 knockdown but yielded no significant change in the SPAG6 overexpression cells. Interestingly, after treatment with INF-α, STAT1 and p-STAT1 were induced to similar levels in both SPAG6-knockdown and its negative control groups but were lower in SPAG6 overexpression group compared with its empty vector control. As a result, STAT1 induction levels were significantly higher in shSPAG6 cells, while forced expression of SPAG6 showed the opposite effect. At the same time, lower STAT5 phosphorylation was observed in the SPAG6-knockdown groups treated with INF-α. Furthermore, with increased expression of STAT1, the expression of SPAG6 was upregulated in INF-treated cells.
In the present study, the inhibitory effects of INF-α were observed in primary MPN cells. Given that PV and ET share similar pathobiological and clinical features, while PMF presents with different clinical characteristics and poses challenges in bone marrow aspiration, only ET and PV patient samples were included in this study. The BMMCs collected from 34 patients of newly diagnosed ET and 11 patients of newly diagnosed PV were cultured and treated with INF-α of the same concentrations of 50 ng.mL−1 for 48 h. At the same time, RT-qPCR was carried out using RNA extracted from whole bone marrow cells of the above 45 patients and 20 IDA cases (Figure 4E). The SPAG6 mRNA expression in IDA cases was comparable to healthy donors and used as the experimental control for this study.21 The results revealed that SPAG6 mRNA expression levels were significantly upregulated in patients with MPN compared to controls (p < 0.01). Based on the SPAG6 mRNA expression levels, a ROC curve was plotted, and the results yielded an area under the ROC value was 0.8922, with a sensitivity of 75.56% and a specificity of 95.00% (Figure 4F), indicating the significant value of SPAG6 in distinguishing patients with MPNs from cancer-free controls, consistent with our previous research.19 In addition, according to the median value of SPAG6 mRNA levels (9.39), patients were divided into SPAG6-low or SPAG6-high groups. As shown in Figure 4G and Table 1, the inhibition rates of INF-α on primary MPN cells were lower in the SPAG6-high group compared to the SPAG6-low group (p < 0.05). Nevertheless, no significant differences were observed in sex, age, blood corpuscle parameters, and the three driver gene mutations JAK2, CALR, and MPL (Table 1; p > 0.05).
3.3 Downregulation of SPAG6 inhibits tumor growth and sensitizes INF-α response in vivo
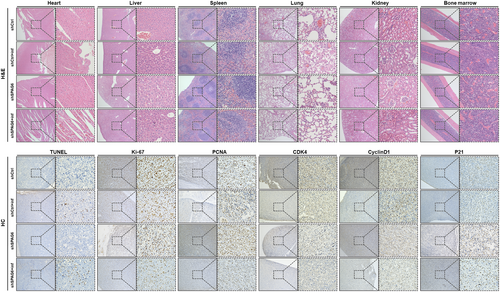
To explore the biological significance of downregulated SPAG6 on the antitumor activity of INF-α in vivo, xenografts mice were established. After 3 days, mice bearing established xenografts were randomized into control or treatment groups and were treated with placebo or peg-INF-α-2b as indicated (Figure 5A). Weight loss of mice began on day 14 in placebo groups, whereas sustained weight loss began on day 21 in INF groups (Figure 5B). All mice survived until the end of the treatment period. Mice were then killed, and tumorigenesis-related phenotypes were measured. The tumor size (Figure 5C), volume (Figure 5D), and weight (Figure 5E) were reduced in shSPAG6-transduced xenograft mice compared to shCtrl-transduced controls. Significantly, the shSPAG6-transduced xenograft mice treated with INF showed a marked reduction in tumor volume and weight compared to shSPAG6-transduced placebo controls. Moreover, tumor tissue sections underwent immunofluorescence staining of p-STAT1 and p-STAT5 (Figure 5F), and the results showed a significant decrease in p-STAT1 staining intensity in shSPAG6 tumors which recovered to the same level as the shCtrl group after treatment with INF. In addition, downregulation of p-STAT5 was observed upon INF-α treatment in shSPAG6 groups. Furthermore, infiltration of leukemic cells and organ toxicity of INF were assessed by H&E staining. As shown in the upper panels of Figure 6, no signs of leukemic cell dissemination, myelosuppression, or morphological and structural abnormality of internal organs were observed. Finally, immunohistochemistry analysis was used to detect the expression levels of markers related to apoptosis (TUNEL), proliferation (Ki-67 and PCNA), and cell cycle (CDK4, cyclin D1, and P21) in tumor tissues. The results suggested that INF treatment and SPAG6-knockdown significantly decreased Ki-67, PCNA, CDK4, and cyclin D1 and significantly increased TUNEL and P21 expression (Figures 5G and 6, lower panels).
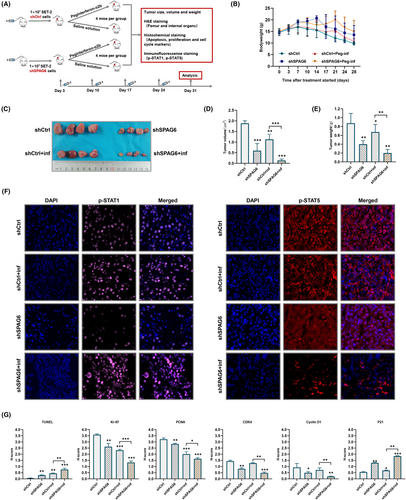
3.4 STAT1 binds to SPAG6 promoter and promotes its expression
In order to ascertain the role of STAT1 signaling in regulating SPAG6 expression, we chemically inhibited STAT1 activation in HEL.92.1.7, SET-2 and UKE-1 cells by pre-incubating them with fludarabine (5 μM, 48 h). Interestingly, SPAG6 protein expression was downregulated when STAT1 expression was inhibited and not activated (Figure 7A). Next, we performed transient silencing of the STAT1 transcription factor. In line with our previous results, a decrease in SPAG6 protein expression was noted when STAT1 signaling was blocked (Figure 7B).
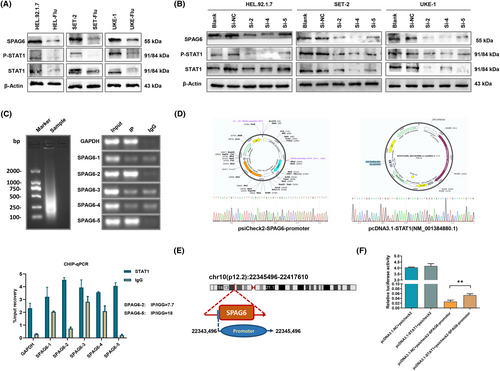
To gain insights into whether STAT1 could bind to the SPAG6 promoter and affect SPAG6 expression, promoter analysis in the JASPAR database revealed multiple STAT1-binding promoter regions of the SPAG6 gene (Table S4). We then undertook a Ch-IP assay in MPN-derived leukemia cells SET-2 with high expression of STAT1. Five pairs of PCR primers (Table S2) were used to amplify five separate segments of the SPAG6 promoter. As shown in Figure 7C, amplification products were observed in two short DNA fragments corresponding to 520–507 nt (SPAG-2, IP/IGG = 7.7) and 1612-1602 nt (SPAG-5, IP/IGG = 18) of the SPAG6 promoter. To further confirm that SPAG6 is a functional target of STAT1, we constructed luciferase reporter plasmids carrying WT SPAG6 promoter (Figure 7D, left panel) and the STAT1 overexpression plasmids (Figure 7D, right panel). A dual luciferase reporter assay was undertaken and revealed that overexpressing STAT1 did not affect the luciferase activity of the vector control plasmid itself, while cotransfection with STAT1 overexpression plasmid significantly increased WT SPAG6 luciferase reporter activity compared to the plasmid carrying WT SPAG6 promoter only (Figure 7F).
4 DISCUSSION
It is widely thought that SPAG6 plays crucial promoting roles in malignancy, as indicated by numerous experiments and clinical studies.20-22 Nevertheless, an increasing body of evidence suggests that SPAG6 also exerts tumor suppressor effects under specific conditions.14-17 Notably, the expression levels of SPAG6 in hematological malignancies have been reported to be upregulated compared with common types of solid tumors.18-21 Our previous studies on various leukemia cell lines showed that SPAG6 promoted the growth of hematologic malignant cells by affecting different signaling pathways and connoted with the worse clinical prognosis of MDS and AML patients.18, 21, 27 The present study found that SPAG6 was significantly upregulated in MPN patients and MPN-derived leukemia cell lines. Forced expression of SPAG6 resulted in a significant increase in clone formation and promoted G1 to S cell cycle progression. Conversely, inhibition of SPAG6 promoted apoptosis, impaired cell proliferation, and reduced G1 to S phase transition. The above functional assays substantiated the tumor-promoting function of SPAG6 in MPN.
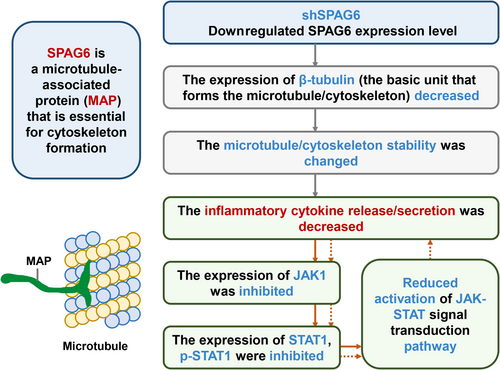
Unlike the heterogeneous subcellular localization patterns in bone marrow biopsy samples from MPN patients,19 our findings revealed that the SPAG6 protein in MPN-derived cells was primarily located in the cytoplasm around the nucleus. After forced expression of SPAG6, an increased β-tubulin expression was observed, while the knockdown of SPAG6 yielded the opposite effect. These results suggest that SPAG6 might regulate the microtubule/cytoskeleton system by affecting tubulin expression. Myeloproliferative neoplasms serve as a disease model characterized by chronic inflammation of cancer, wherein JAKs are constitutively activated by autocrine mechanisms. Within this context, numerous inflammatory cytokines, including TNF-α, INF-γ, IL-1, IL-2, IL-6, IL-8, IL-12, and growth factors, play critical roles. These cytokines contribute to the development of debilitating symptoms associated with the disease and fuel the selective expansion of the neoplastic clone.28, 29 Previous studies have shown that microtubules influence many cellular functions, including cytokine secretion and vesicular and organelle transport.30, 31 Cooley et al. reported that reduced INF-γ release from activated global SPAG6-deficient mice CD8+ T cells was due to defective secretion.32 Interestingly, in the present study, downregulation or forced expression of SPAG6 affected the concentrations of cytokines in the supernatant of the cell culture. Moreover, we found that the expressions of JAK1 (Figure S1) and STAT1 were decreased following SPAG6 knockdown, which might be caused by reduced reactivation of the JAK-STAT pathway due to reduced cytokine release (Figure 8). Thus, the secretion of inflammatory cytokines was further reduced, forming a positive feedback loop. Sperm-associated antigen 6 is a tubulin-binding protein.22 In addition to its role in classic primary cilia and microtubule organizing center formation, it is highly conceivable that SPAG6 can regulate several other microtubule/cytoskeletal functions, such as the release/secretion of cytokines.
Given its antiapoptotic and antiproliferative effects, INF-α is important in MPN treatment.10-12 It exerts its pro-apoptotic effect by inducing TNF-related apoptosis-inducing ligand (TRAIL) and/or Fas/FasL to interact with their receptors while downregulating a variety of cyclins and interfering with all mitotic cell cycle phases, primarily within G1, but may also prolong the G2 and S phases of the cell cycle.33, 34 In our present study, the inhibitory rate of INF-α on the primary MPN cells with high SPAG6 expression was decreased. Conversely, downregulation of SPAG6 enhanced pro-apoptotic and cell cycle arrest effects of INF-α both in vitro and in vivo. Previous research has shown that STAT1 is a pivotal downstream mediator of INF signaling in MPN.8, 9 As a transcription factor, the first STAT family member, STAT1, can transcriptionally increase the expression of various pro-apoptosis genes that regulate cell death.35 Zhang et al. showed that STAT regulates the expression of multiple cell cycle regulatory genes such as p21, p27Kip1, and cyclin D1.36 Kalmer et al. established a clonogenic assay from mononuclear cells of MPN patients to analyze the in vitro INF-α response and found that basal STAT1 expressions in the colonies were significantly lower in responders than nonresponders, but STAT1 expression was induced to similar levels in both responders and nonresponders after treatment with INF-α.37 In line with this research, we found that the expression of STAT1 decreased following SPAG6 knockdown. However, following treatment with INF-α, the expression of STAT1 recovered to the same level as the negative controls, indicating a higher induction level of STAT1 following downregulation of SPAG6. As a result, we observed that with activation of STAT1, TUNEL and P21 expression levels were increased, while Ki-67, PCNA, cyclin D1, and CDK4 decreased, promoting cell apoptosis and impairing cell proliferation. The above findings suggest that the downregulation of SPAG6 might sensitize the response to INF-α, and this effect could be associated with enhanced levels of STAT1 induction in MPN.
It has been suggested that the relative ratio of the different STAT proteins is crucial to determine the effects of the INF-α response.38 We observed increased phosphorylation of STAT1 in addition to downregulation of p-STAT5 following INF-α treatment in shSPAG6 cells, thereby shifting the STAT1/STAT5 ratio towards a more STAT1-dominated INF-α response, accounting for the reduced cell proliferative activity, as STAT1 plays a major role in mediating the antiproliferative effects of INF-α,39 while activated STAT5 is linked to survival signals and has been described as a transcription factor for hypoxia-inducible factor 2α, the expression of which induces aerobic glycolysis and upregulates genes involved in glucose metabolism to support the rapid proliferation of tumor cells.40, 41 Therefore, the benefits of INF treatment in downregulated SPAG6 groups can be attributed to a certain extent to the suppression of STAT5 phosphorylation, which was not observed in the negative controls.
Despite the results generated from most studies supporting the antineoplastic effect of STAT1,36 accumulating evidence suggests that STAT1 also exerts a tumor-promoting function.42-44 In some malignant phenotypes, STAT1 can act as an oncoprotein or tumor suppressor in the same cell type, depending on the specific genetic background.45, 46 In this present study, we found that STAT1 was highly expressed in MPN-derived leukemia cell lines. Interestingly, we found that the expressions of SPAG6 tended to be upregulated in INF-treated cells with increased expression of STAT1. Promoter analysis of STAT family factors of STAT1, STAT2, STAT3, STAT4, STAT5a, STAT5b, and STAT6 in the JASPAR database revealed that only STAT1 has multiple binding regions on the SPAG6 promoter. We then chemically inhibited STAT1 activation and performed transient silencing of STAT1; a decrease in SPAG6 protein expression was noted when the STAT1 signaling was blocked. Finally, the Ch-IP assay showed that the STAT1 protein binds to the SPAG6 promoter, and the dual luciferase reporter assay indicated that STAT1 might contribute to the upregulation of SPAG6 expression. These results suggest that STAT1 might regulate SPAG6 expression and shows pro-oncogenic activity in MPN.
In summary, we revealed SPAG6 upregulation in MPN-derived leukemia cells and primary cells of MPN patients. We provide hitherto undocumented evidence that STAT1 protein binds to the SPAG6 promoter and induces its expression, showing pro-oncogenic activity. The downregulated expression of STAT1 following SPAG6 knockdown might be caused by impaired reactivation of the JAK-STAT pathway due to reduced cytokine release. Downregulation of SPAG6 could sensitize INF-α response through the enhanced levels of STAT1 induction and downregulation of p-STAT5 in MPN. Consequently, lower INF-α dosages might be effective in achieving similar rates of molecular remission for SPAG6-low patients compared to those observed in SPAG6-high patients. The present study could have limitations due to the challenges associated with obtaining bone marrow samples and conducting primary cell culture and treatment. As a result, the sample size used in this study is limited, emphasizing the need for further research and experimentation to validate our findings.
AUTHOR CONTRIBUTIONS
Li Ding designed and performed the research, and wrote the paper. Jie Luo and Beibei Zhao participated in performing in vitro research. Juan Du and Linyi Zhang collected and analyzed clinical samples. Jin Luo and Shirui Pan participated in performing in vivo research. Xinyu Yan and Junnan Li supervised the experiment and revised the paper. Lin Liu provided financial support, gave advice on design, and critically revised the manuscript. All authors approved all versions including the final version, and are responsible for the accuracy and integrity of all aspects of the manuscript.
ACKNOWLEDGMENTS
We are thankful to the Experimental Research Center of The First Affiliated Hospital of Chongqing Medical University (Chongqing, China) for the site and technical support.
FUNDING INFORMATION
The present study was supported by the National Natural Science Foundation of China (grant no. 82070130).
CONFLICT OF INTEREST STATEMENT
The authors declare that they have no competing interests.
ETHICS STATEMENT
Approval of the research protocol by an institutional review board: This study was approved by the Ethics Committee of The First Affiliated Hospital of Chongqing Medical University (approval no. 2021–109; Chongqing, China).
Informed consent: Written informed consent was obtained from all participants (consent was obtained from parents/guardians for minors).
Registry and the registration no. of the study: N/A
Animal Studies: All animal experiment experiments were performed under an Institutional Animal Care and Use Committee-approved protocol of Chongqing Medical University (approval no. 2022-K464; Chongqing, China), and guidelines for the proper use of animals in research and animal welfare were followed.


