SOX2 is required to maintain cancer stem cells in ovarian cancer
Funding Information
National Natural Science Foundation of China, (Grant/Award Number: 81472443, 81572572)
Abstract
Ovarian cancer cells can form spheroids under serum-free suspension culture conditions. The spheroids, which are enriched in cancer stem cells, can result in tumor dissemination and relapse. To identify new targetable molecules in ovarian cancer spheroids, we investigated the differential expression of genes in spheroids compared with that under monolayer culture conditions by qPCR microarray. We identified that SOX2 is overexpressed in spheroids. We then proved that SOX2 expression was increased in successive spheroid generations. Besides, knockdown of SOX2 expression in SKOV3 or HO8910 ovarian cancer spheroid cells decreased spheroid formation, cell proliferation, cell migration, resistance to Cisplatin treatment, tumorigenicity, and the expression of stemness-related genes and epithelial to mesenchymal transition-related genes, whereas overexpression of SOX2 in SKOV3 or HO8910 ovarian cancer cells showed the opposite effects. In addition, we found that SOX2 expression was closely associated with chemo-resistance and poor prognosis in EOC patients. These results strongly suggest that SOX2 is required to maintain cancer stem cells in ovarian cancer. Targeting SOX2 in ovarian cancer may be therapeutically beneficial.
Epithelial ovarian cancer (EOC) is one of the most common malignancies of the female reproductive system with an estimated 21 290 new cases and 14 180 deaths in the USA each year.1 Approximately 70% of EOC patients are diagnosed in the advanced stages, with metastasis beyond the ovary,1 which has generally been a therapeutic challenge in clinical practice. Previous reports have indicated that serous ovarian carcinoma is responsible for approximately 70% of EOC cases,2 and the most aggressive subtype, high-grade serous ovarian cancer (HGSOC), accounts for 90% of these serous carcinomas3 and two-thirds of all ovarian cancer deaths.4 Recent studies indicate that HGSOC develops from an occult intraepithelial carcinoma in the fimbria of the fallopian tube and involves the ovary secondarily.5 Direct tumor dissemination is a major metastasis approach to EOC, which is often accompanied by the formation of ascites. Previous studies have demonstrated anchorage-independent, autonomous, three-dimensional (3D) spherical structures in EOC patient ascites,6 which contain a small subpopulation of tumor-propagating cells capable of organizing spheroids.7 These three-dimensional cellular aggregates serve as the vehicle for dissemination in the peritoneal cavity, protecting cells from anoikis induced by stress in the extracellular compartment.8, 9
The cancer stem cell (CSC) model postulates that tumors are organized hierarchically with a subset of rare tumor cells that possess the capability to self-renew and generate diverse tumor cells. CSCs are also characterized by resistance to cytotoxic agents and are therefore associated with cancer initiation, development, and therapeutic resistance.10 Because of the instability of the CSC phenotype and the absence of specific cell-surface markers, CSCs have typically been defined and studied based on functional assays in relation to these properties. Therefore, there are two gold standards for evaluating the presence of CSCs: tumorigenesis with a low number of cells in serial xenotransplantation assays and the ability to form in vitro tumorospheres when plated at low density in nonadherent cultures in “sphere”-forming assays.11 In addition, several studies have demonstrated that cells forming spheres are enriched in CSCs, leading to the development of distant metastases and resistance to chemotherapy.12, 13
A recent study suggests that 3D cell–cell interaction influences cell structure, adhesion, mechanotransduction, and specific intercellular signaling in response to soluble factors that in turn regulate overall cell function in ways that differ dramatically from traditional two-dimensional (2D) monolayer culture formats.14 Moreover, it is now well accepted that the 3D local microenvironment in all spherical cancer models could enhance cell survival and drug resistance through strong cell–cell contacts and might offer a hypoxic microenvironment favorable to cancer stemness.15 However, the molecular mechanism regulating the formation of 3D multicellular aggregates is lacking. Therefore, in this study, we used microarray analysis to compare OC spheroid structures with monolayer cultures and identify oncogenic genes regulating the formation of multicellular aggregates with the aim of identifying novel targets for disrupting spheroid formation and blocking cancer metastasis.
Materials and Methods
Cell culture and spheroid culture
Human EOC cell lines SKOV3 and HO8910 were obtained from the China Center for Type Culture Collection (CCTCC, Wuhan University, China). Both cell lines were maintained in DMEM/F12 medium supplemented with 10% (v/v) fetal bovine serum. Adherent cells were maintained at 37°C in 5% CO2 and detached using trypsin/ethylenediaminetetraacetic acid (EDTA) solution. Spheroids were generated from both SKOV3 and HO8910 cells after plating at a density of 500 cells/mL into ultra-low attachment 6-well culture plates (Corning, NY, USA). Spontaneously generated spheroids were cultured in a serum-free DMEM/F12 medium supplemented with 2% B-27 Supplement without vitamin A (Invitrogen, Carlsbad, CA, USA), 20 ng/mL basic fibroblast growth factor (FGF, Peprotech, Rocky Hill, NJ, USA), 20 ng/mL epidermal growth factor (EGF, Peprotech), 10 ng/mL leukemia inhibitory factor (LIF, Peprotech) and insulin-transferrin-selenium (ITS, Invitrogen). Fresh medium was added every 3 days, and spheroids were cultured for approximately 2 weeks before they reached a diameter of approximately 150 μm. The spheres were collected by gentle centrifugation, then dissociated with accutase (Invitrogen) and mechanically disrupted with a pipette. The resulting single cell suspension was then centrifuged and re-suspended in serum-free medium to allow for the re-forming of spheres.
PCR microarrays
Polymerase chain reaction (PCR) array human cancer stem cells (catalog no. PAHS-176Z) from SABiosciences were used to identify the gene expression profiles of SKOV3 monolayer cells and SKOV3 spheroid cells. The arrays were performed in triplicate for each condition.
qPCR
cDNA were prepared from isolated total RNA, and the relative expression levels of SOX2, DLL1, BMI-1, β-catenin, KLF4, OCT4, NANOG, LIN28, LIN28B, ALDH1A1, E-CADHERIN, VIMENTIN, ABCB1, ABCG2 and ABCC6 to β-actin were measured by a SYBR Green (Takara) real-time PCR assay. Primer sequences are shown in Table S1.
Stable transfection of SOX2 shRNA
Recombinant lentiviral shRNA targeting SOX2 (shSOX2) and scrambled control shRNA (shNC) were purchased from GenePharma (Shanghai, China). The sequences of shRNA were (shSOX2) 5′-GGGACATGATCAGCATGTATC-3′ and (shNC) 5′-TTCTCCGAACGTGTCACGT-3′. Lentiviral particles were added to cells at a multiplicity of infection of 10. After 24 h, the medium was replaced with full medium and then passaged into selective medium with 2 μg/mL of puromycin until resistant cell colonies formed and antibiotic induced cell death ceased. The knockdown efficiency was evaluated using qRT-PCR analysis.
Transfection of SOX2 plasmid DNA
The SOX2 plasmid DNA used to overexpress the SOX2 gene in the SKOV3 cells and HO8910 cells was purchased from Genechem (Shanghai, China). Cells were transfected with 4 μg of SOX2 plasmid DNA using Lipofectamine 3000 transfection reagent (Invitrogen) according to the manufacturer's protocol. After transfection for 48 h, cells were harvested for further analysis.
Transfection of DLL1, LIN28B, OCT4 and β-catenin siRNA
RNA duplexes were obtained from GenePharma. The strand sequences of siRNA for human DLL1, LIN28B, OCT4 and β-catenin were 5ʹ- GAGAACAGCUACUCCUGUATT-3ʹ, 5ʹ-GGAGAUAGAUGCUACAACUTT-3ʹ, 5ʹ- GGAUGUGGUCCGAGUGUGGTT-3ʹ and 5ʹ-GUCAACGUCUUGUUCAGAATT-3ʹ respectively. Cells cultured in 6-well plates were transfected with 20 nM siRNA duplexes per well using the Lipofectamine 2000 reagent (Invitrogen) according to the manufacturer's protocol. After transfection for 48 h, cells were harvested for further analysis.
Cell proliferation assay
Ovarian cancer cells were seeded in 12-well culture plates at a density of 1 × 10⁴ cells/well and cultured for 4 days in normal growth medium (DMEM/F12 medium supplemented with 10% fetal bovine serum). Cells were harvested using a trypsin/EDTA solution and washed twice with phosphate-buffered saline (PBS). Cell numbers were determined by counting viable cells under a microscope after trypan blue staining.
EdU assay
A 5-ethynyl-2′- deoxyuridine (EdU) DNA cell proliferation kit (RiboBio, Guangzhou, China) was used to evaluate cell proliferation activity according to the manufacturer's instructions. Tumor cells were seeded in triplicate at a concentration of 5 × 10³ cells/well in 96-well plates. After 24 h, cells were fixed with 4% formaldehyde for 30 min and treated with 0.5% Triton X-100 for 10 min at room temperature for permeabilization. Then, after incubated with EdU staining for 1 h, all cells were counterstained with Hoechst33342 (blue) for 30 min. The proportion of EdU-incorporated cells was defined as the proliferation rate.
Colony formation assay
Ovarian cancer cells were seeded in six-well plates at a density of 500 cells and cultured until visible colonies appeared. The colonies were fixed with 4% formaldehyde for 30 min and stained with crystal violet for at least 1 h, and the colonies in each well were photographed.
Scratch wound healing assay
Cells were seeded into six-well plates and cultured until 80%–90% confluence. A scratch wound was introduced on the cell monolayer using a 10 μL pipette tip. The cells were washed with PBS to remove the cell debris and then grown in serum-free growth media. The migration of cells into the wound area was observed at the designated time points (0, 12 h, 24 h, 48 h and 72 h). For quantification, the wound gap was measured using Image-Pro Plus 6.0, (Media Cybernetics, Inc., Rockville, Maryland, USA) and the average wound gaps are shown after normalization to 0 h.
Transwell migration assay
The cell density was adjusted to 5 × 10⁵ cells/mL with serum-free DMEM/F12 medium, and 100 μL of this suspension was added to each transwell insert (6.5-mm diameter, polycarbonate membrane with 8-μm pore membrane; Corning Costar, Cambridge, MA, USA) in triplicate. The lower chamber was incubated with 600 μL of DMEM/F12 medium supplemented with 15% fetal bovine serum. After incubation for 24 h at 37°C, non-migration cells were removed with a cotton swab. The numbers of cells that had migrated to the lower surfaces of each filter were determined by counting the cells in five different places under the microscope (100×) after staining with crystal violet.
Chemotherapy resistance assay
Cells were seeded at 5 × 10³ cells per well (96-well plates, Corning) in 100 μL DMEM/F12 medium supplemented with 2% fetal bovine serum (FBS). After being treated with 0 to 100 μM Cisplatin for 48 h (n = 3 per drug dose), cells were stained with 100 μL sterile MTT (3-(4, 5-dimethylthiazol-2-yl) 2, 5-diphenyl tetrazolium bromide) dye (0.5 mg/mL, Sigma, St. Louis, MO, USA) for 4 h at 37°C, followed by the addition of 100 μL extraction buffer. After an overnight incubation, absorbance at 570 nm was measured using wells without cells as blanks on an iMark microplate reader (Bio-Rad, Hercules, California, USA; Serial No. 10601). The 50% inhibitory concentration (IC50) values were calculated by linear interpolation.
In vivo xenograft transplantation
All of the procedures involving animals in this study were in accordance with the ethical standards of the Institutional Animal Care and Use Committee of Tongji Medical College, Huazhong University of Science and Technology. Control-shRNA-infected and SOX2-shRNA-infected SKOV3-spheroid cells were harvested during exponential growth of the cell culture. Four-week-old female BALB/c-nu nude mice (Beijing Vital River, China) were randomly divided into two groups (six mice in each group). The cells were serially diluted (104, 103 and 102 cells) and mixed with Matrigel (BD Biosciences, San Jose, CA, USA) at 1:1. The mixtures were implanted subcutaneously into the right side of the scapular region of each mouse. On the indicated dates after the injection of cells, tumor volumes were determined using an external caliper. The following formula was used to calculate tumor volume: tumor volume (mm3) = tumor length (mm) × tumor width (mm) × tumor width (mm)/2. All mice were killed by cervical dislocation on day 32 after injection. Subcutaneous tumors were surgically excised, weighed, and photographed.
Immunohistochemistry
The SOX2 expression was examined in 53 paraffin-embedded EOC tissues by immunohistochemistry (IHC) analysis using rabbit anti-human SOX2 antibody (1:100, Abcam, Cambridge, UK). The clinical and pathological characteristics of these patients were summarized in Table 1. Only cells associated within tumors were scored, stromal and vascular staining was excluded. Positive cells were indicated by the presence of brown staining in the nuclear. Immunohistochemical results were evaluated under a light microscope by two independent two reviewers, and a staining score (0–9) was determined by multiplying the positive proportion score (0, 0%; 1, <10%; 2, 10%–50%; 3, ≥50%) with the staining intensity score (0, negative; 1, faint yellow; 2, brown–yellow; 3, dark-brown). The median score was used as the cutoff value to define the high and low expression of SOX2.
| Clinicopathological Characteristics | No. of Cases | SOX2 expression No. (%) | |||
|---|---|---|---|---|---|
| high | low | P-value | χ2 | ||
| Age at diagnosis (years) | 0.041 | 4.18 | |||
| <45 | 12 | 3 (25%) | 9 (75%) | ||
| ≥45 | 41 | 24 (58.54%) | 17 (41.46%) | ||
| FIGO stage† | 0.026 | 4.93 | |||
| I and II | 15 | 4 (26.67%) | 11 (73.33%) | ||
| III and IV | 38 | 23 (60.53%) | 15 (39.47%) | ||
| Tumor categories‡ | 0.941 | 0.01 | |||
| Type I | 12 | 6 (50%) | 6 (50%) | ||
| Type II | 41 | 21 (51.22%) | 20 (48.78%) | ||
| Chemotherapy resistance§ | 0.000 | 13.93 | |||
| Yes | 17 | 15 (88.24%) | 2 (11.76%) | ||
| No | 36 | 12 (33.33%) | 24 (66.67%) | ||
| Relapse | 0.039 | 4.25 | |||
| Yes | 30 | 19 (63.33%) | 11 (36.67%) | ||
| No | 23 | 8 (34.78%) | 15 (65.22%) | ||
| Death | 0.008 | 7.14 | |||
| Yes | 22 | 16 (72.73%) | 6 (27.27%) | ||
| No | 31 | 11 (35.48%) | 20 (64.52%) | ||
- †According to FIGO (International Federation of Gynaecology and Obstetrics) classification (2009).‡TypeImainly includes low-grade serous carcinoma (LGSC), endometrioid carcinoma, clear-cell carcinoma, mucinous carcinoma and malignant Brenner tumor. Type II mainly includes high grade serous carcinoma (HGSC), undifferentiated carcinoma and carcinosarcoma.§Chemo-resistant tumors were defined as those with relapse within 6 months after completing chemotherapy or progress during the primary chemotherapy.
Statistical analysis
All data were expressed as mean ± SD (n ≥ 3). Statistical significance of differences was analyzed by two-tailed Student's t-test. The distributions of the clinicopathologic events were evaluated using χ2 test (categorical data). Kaplan–Meier survival curve with the log-rank test was used to measure progression-free survival (PFS) and overall survival (OS) of patients. A value of P < 0.05 was considered statistically significant. Data analyses were carried out using the SPSS 16.0 statistical software package (IBM, Armonk, NY, USA).
Results
Gene expression profiles of EOC spheroids
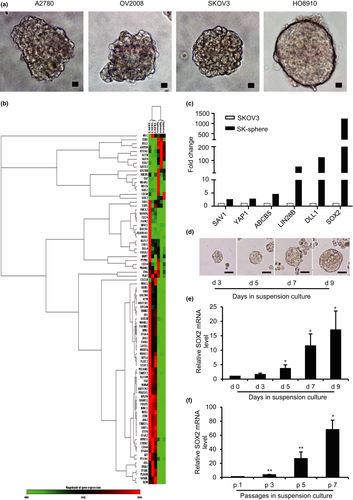
EOC cell lines A2780, OV2008, SKOV3 and HO8910, when grown under non-adherent conditions, formed 3D aggregates with distinct features. A2780 and OV2008 cells formed branching spheroids, whereas SKOV3 and HO8910 cells formed compact round multicellular aggregates (Fig. 1a). To identify the key factor driving EOC spheroid formation, we compared the expression profiles of monolayers and spheroids SKOV3 cultures using a CSC focused PCR array. Unsupervised hierarchical clustering demonstrated distinct profiles of 3D vs 2D cultures, and analysis of variance-based statistical analysis identified 53 genes differentially expressed in spheroids compared with monolayers (P < 0.05). Among them, six genes were upregulated >2-fold and 47 genes were downregulated >2-fold in spheroids versus monolayers (Fig. 1b,c and Table S2). Notably, SOX2 was one of the most significantly upregulated genes in the SKOV3 spheroids compared with the monolayers (1223-fold; Student's t-test P < 0.05; Fig. 1c).
SOX2 expression in spheroids
SOX2 was recently recognized as a cancer stem cell-associated gene. To determine whether expression of SOX2 is related to the development of CSCs in ovarian cancer, the expression levels of SOX2 were consecutively evaluated during the spheroid culture of SKOV3 and HO8910 ovarian cancer cells. SKOV3 and HO8910 cells were dissociated into single cells and seeded into culture plates with a non-adhesive coating; spheroids, known to contain the enriched CSC population,12, 13 appeared after 3 days of culture (Fig. 1d) and grew steadily for up to 2 weeks. The expression of SOX2 was analyzed by qRT-PCR on days 3, 5, 7, and 9 of spheroid culture. The results showed that the SOX2 mRNA in SKOV3 and HO8910 spheroids was significantly increased on day 5 and progressively increased on days 7 and 9 (Fig. 1e; Fig. S1a). Because self-renewal is an important property of CSCs, we analyzed the expression of SOX2 in SKOV3 and HO8910 spheroids during serial passage and found that the mRNA level of SOX2 gradually increased from passage 1 to passage 7 (Fig. 1f; Fig. S1b). These results indicate a correlation of SOX2 expression level with the development of spheroids in ovarian cancer cells.
SOX2 promotes EOC spheroid formation
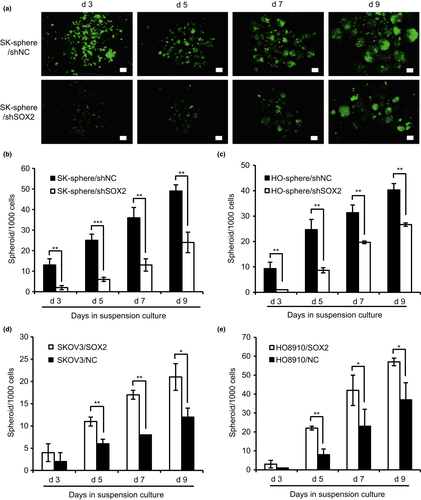
To determine whether SOX2 is involved in the regulation of CSC-like characteristics, we tested the effect of SOX2 knockdown and overexpression on spheroid formation in SKOV3 and HO8910 ovarian cancer cells. Cells derived from SKOV3 spheroids (SK-sphere) and HO8910 spheroids (HO-sphere) were infected with lentiviral shRNA against SOX2 (shSOX2) or a lentiviral harboring scrambled control (shNC). Compared with the control, the SK-sphere/shSOX2 and HO-sphere/shSOX2 cells expressed significantly lower levels of SOX2 (Fig. S2a,b). Moreover, parent SKOV3 and HO8910 cells were transfected with an overexpression plasmid DNA for SOX2 or a scrambled control. Compared with the negative control, the SOX2 levels were dramatically increased in SKOV3/SOX2 and HO8910/SOX2 cells (Fig. S2c,d). In addition, as shown in Figure 2, the number of spheroids generated from SK-sphere/shSOX2 and HO-sphere/shSOX2 cells was significantly smaller than the number generated by the control cells (Fig. 2a–c). In contrast, SKOV3/SOX2 and HO8910/SOX2 cells generated many more spheroids than the control cells (Fig. 2d,e). These results indicate that SOX2 contributes to spheroid formation in ovarian cancer cells.
Since the PCR array showed that in addition to SOX2, DLL1 and LIN28B were also strongly up-regulated in cancer cells grown under non-adherent condition, we also assessed the effect of DLL1 and LIN28B on CSCs properties. DLL1 and LIN28B were depleted in SK-sphere and HO-sphere cells by siRNA transfection (Fig. S3a,b). Compared to the cells transfected with control siRNA, the sphere formation capacity was decreased by 29.26%, 36.50% and 46.28% in the SK-sphere/siDLL1, HO-sphere/siDLL1 and SK-sphere/siLIN28B cells, respectively (Fig. S4a–e). However, the number of spheroids generated from HO-sphere cells was not significantly affected by LIN28B downregulation (Fig. S4f).
It is recognized that OCT4 and SOX2 work together closely to regulate a large set of genes that are essential for the self-renewal and pluripotency of embryonic stem cells (ESCs).16 Besides, we considered that β-catenin may be the potential downstream gene of SOX2. Therefore, we also tested the effect of OCT4 or β-catenin knockdown on CSCs properties and found that OCT4 or β-catenin knockdown all decreased the sphere formation capacity by a similar magnitude to the effects of SOX2 knockdown in the SK-sphere cells and HO-sphere cells (Fig. S5a–d, Fig. S6a–d).
SOX2 promotes proliferation and migration of EOC cells
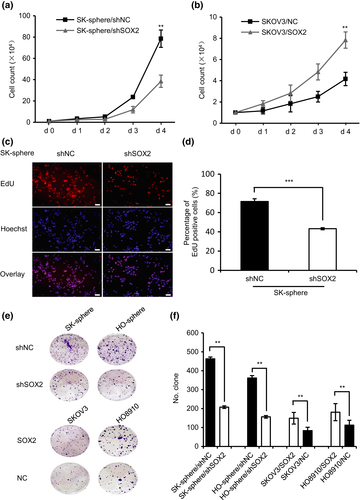
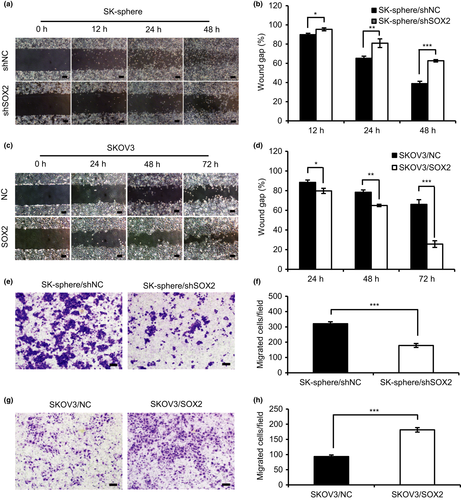
To determine whether SOX2 is involved in aggressive progression in ovarian cancer, we tested the effect of SOX2 expression on the proliferation and migration properties of ovarian cancer cells. As shown in Figure 3(a) and Figure S7(a), cell counting assays revealed that cell proliferation was decreased in the SK-sphere/shSOX2 and HO-sphere/shSOX2 cells compared with that in the control, whereas the SKOV3/SOX2 and HO8910/SOX2 cells showed a significant increase in proliferation (Fig. 3b; Fig. S7b). Similarly, EdU assays revealed that the proliferation activity in SK-sphere/shSOX2 cells was decreased by approximately 30% relative to that in the control (Fig. 3c,d). In addition, colony formation assays indicated that, compared with that of the control cells, the clonogenicity was reduced in SK-sphere/shSOX2 and HO-sphere/shSOX2 cells, whereas it was enhanced in SKOV3/SOX2 and HO8910/SOX2 cells (Fig. 3e,f). Cell migration was measured by scratch wound healing assay and transwell migration assay. SOX2 knockdown decreased cell migration in SK-sphere and HO-sphere cells, whereas SOX2 overexpression significantly increased cell migration in SKOV3 (Fig.4a–h) and HO8910 cells (Fig. S8a–h). These results suggest that SOX2 expression stimulates cell proliferation and migration in ovarian cancer cells.
SOX2 promotes resistance to chemotherapy in EOC cells
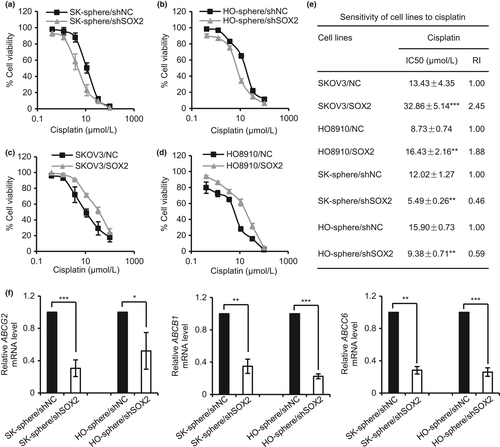
To assess whether SOX2 expression is involved in the regulation of chemoresistance, a key characteristic of CSC, in ovarian cancer, the sensitivities of SK-sphere/shSOX2, HO-sphere/shSOX2, SKOV3/SOX2 and HO8910/SOX2 cells to cisplatin were assessed by MTT assay. As shown in Figure 5, the SK-sphere/shSOX2 and HO-sphere/shSOX2 cells exhibited a left-shifted dose-survival curve and became more sensitive to cisplatin than the control cells (Fig. 5a,b). In contrast, SKOV3/SOX2 and HO8910/SOX2 cells exhibited a right-shifted dose-survival curve and became more resistant to cisplatin (Fig. 5c,d). Compared with that of the corresponding control cells, the IC50 values for cisplatin were 2.17- and 1.70-fold lower in the SK-sphere/shSOX2 and HO-sphere/shSOX2 cells, respectively, and 2.45- and 1.88-fold higher in the SKOV3/SOX2 and HO8910/SOX2 cells, respectively (Fig. 5e). In addition, qPCR showed that knockdown of SOX2 in SK-sphere and HO-sphere cells led to decreased expression of genes encoding drug efflux transporters ABCB1, ABCG2, and ABCC6 (Fig. 5f). These results suggest that SOX2 confers cisplatin resistance in ovarian cancer, which might be due to increased drug efflux.
It was proposed that except for the sphere formation capacity, chemotherapy resistance is another important characteristic feature of CSCs. Therefore, the sensitivities of SK-sphere/siDLL1, HO-sphere/siDLL1, SK-sphere/siLIN28B and HO-sphere/siLIN28B cells to cisplatin were also assessed by MTT assay. As shown in Figure S9, all of the SK-sphere/siDLL1, HO-sphere/siDLL1, SK-sphere/siLIN28B and HO-sphere/siLIN28B cells exhibited a left-shifted dose-survival curve and became more sensitive to cisplatin than the control cells (Fig. S9a–d). Compared with that of the corresponding control cells, the IC50 values for cisplatin were 1.75- and 1.56-fold lower in the SK-sphere/siDLL1 and SK-sphere/siLIN28B cells, respectively, and it were 1.72- and 1.82-fold lower in the HO-sphere/siDLL1 and HO-sphere/siLIN28B cells, respectively (Table S3). Besides, we also found that OCT4 or β-catenin knockdown decreased the IC50 of cisplatin by a similar magnitude to the effects of SOX2 knockdown in the SK-sphere cells and HO-sphere cells, respectively (Fig. S10 a–d, Table S3).
SOX2 promotes expression of stemness- and EMT-related genes in EOC cells
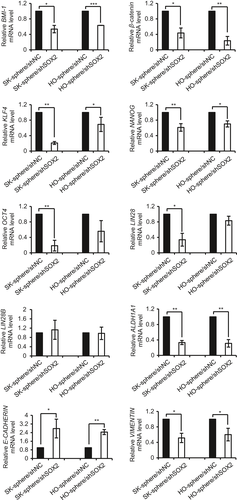
Expression of stemness- or CSC-related genes and EMT-related genes in spheroid cells transfected with shSOX2 or control were analyzed by qPCR. As shown in Figure 6, knockdown of SOX2 led to downregulation of stemness- or CSC-related genes, including BMI-1, β-catenin, KLF4, OCT4, NANOG and ALDH1A1. Moreover, knockdown of SOX2 significantly decreased the expression of VIMENTIN and increased the expression of E-CADHERIN relative to that of control cells, which showed that SOX2 is involved in the EMT process in CSCs (Fig. 6). Taken together, these results suggest that SOX2 expression is positively correlated with the expression of genes related to CSC-like characteristics in EOC cells.
SOX2 knockdown inhibits the tumorigenic of EOC spheroid cells
To determine whether the knockdown of SOX2 influences the tumorigenesis of EOC spheroid cells, athymic nude mice were inoculated with either SK-sphere/shSOX2 or SK-sphere/shNC control cells. Cells were serially diluted (102, 103, and 104 cells) and subcutaneously injected. As shown in Figure 7(a), all the mice harboring SK-sphere/shNC cells developed tumor xenografts. And 103 or 104 SK-sphere/shSOX2 cells were also able to initiate tumor formation in all mice, whereas the rate of tumor formation was 50% (3/6) in the group receiving the injection of 102 SK-sphere/shSOX2 cells. Measureable tumors generated from 104 cells and 103 cells were detected on day 11 and day 20 after injection, and tumors were removed on day 32. Compared with the control group, SOX2 knockdown significantly delayed tumor onset and decreased tumor volume (Fig. 7a–c). When tumors were weighed on day 32 after sacrificing mice, the SK-sphere/shSOX2 tumors weighed significantly less than the SK-sphere/shNC tumors (Fig. 7d). These results indicate that SOX2 is essential for the tumor-initiating potential of EOC spheroid cells.

SOX2 expression is associated with chemo-resistance and poor prognosis in EOC patients
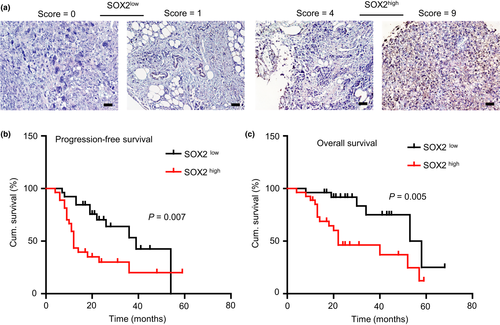
Since SOX2 plays a critical role in maintaining CSCs properties, we would like to further investigate its role in chemoresistance and relapse in EOC patients. So, we examined the expression of SOX2 by IHC in 53 EOC specimens. The SOX2 expression scores ranged from 0 to 9, with a median of 3 (Fig. 8a). The high SOX2 expression was significantly associated with age at diagnosis (P = 0.041), FIGO stage (P = 0.026), chemotherapy resistance (P = 0.000), relapse (P = 0.039) and death (P = 0.008) were found significantly associated with SOX2 high expression (Table 1). The patients were followed up for 4 to 68 months (median, 23 months). Kaplan-Meier survival analysis indicated that the patients with a high SOX2 expression had a significantly shorter survival (PFS, P = 0.007, Fig. 8b; OS, P = 0.005, Fig. 8c) than those with a low SOX2 expression.
Discussion
Through microarray analysis, we identified SOX2, a key member of the high-mobility group domain family, as being upregulated in EOC spheroids compared with monolayer cultures. We demonstrated that SOX2 functions as an oncogene in epithelial ovarian cancer cells by promoting CSC-like characteristics including spheroid formation, cell proliferation, cell migration, drug resistance, and tumorigenic potential. Our data indicate a novel target for disrupting the formation of spheroids and inhibiting functions of ovarian CSCs.
In the current study, we demonstrated significant differences in gene expression under 3D conditions between SKOV3 cells and monolayer cultures. Similarly, another study compared the expression profiles of IGROV1 monolayers and spheroid cultures using Affymetrix microarrays and identified a specific gene network activated under 3D conditions relative to monolayer cultures.17 It is worth noting that the SKOV3 and IGROV1 cell lines are derived from serous and endometrioid adenocarcinoma, respectively; therefore, the results of the two studies are not entirely concordant mainly due to the heterogeneity of ovarian cancer. Furthermore, several studies have explored the biological and molecular features of cells grown in 3D and 2D cultured counterparts and have demonstrated that EOC cells cultured in 3D differentially express adherens junction proteins and are frequently more chemoresistant than the same cells cultured as 2D monolayers.18-20 In addition, recent data suggest that 3D conformation can induce the expression of proteins associated with metastasis and drive tumor progression via increased ECM deposition, cross-linking, and remodeling.21 Importantly, 3D tumor spheroids are able to produce ECM components such as tenascin C to partially create their CSC niche22 and offer a hypoxic microenvironment favorable to maintaining cancer stemness.15 Taken together, identifying the key factor that regulates the growth of spheroids is highly significant.
In this study, we identified that SOX2, a transcription factor expressed in various types of embryonic and adult stem cells,23, 24 is the most upregulated transcription factor in ovarian tumor spheroids. A previous report suggested that SOX2 is pivotal for the early development and maintenance of undifferentiated ESCs.23 SOX2 is also one of the key transcription factors initially used to derive induced pluripotent stem (iPS) cells from fibroblast cells.25 Recently, enhanced SOX2 expression has been detected in several epithelial tumors, such as lung cancer, breast cancer, esophageal cancer and ovarian cancer.26-31 In ovarian cancer, several studies have proved that the expression of SOX2 gradually increases from benign and borderline to malignant ovarian tumors. Positive correlations between SOX2 expression and disease stage and tumor differentiation have been reported,30 and SOX2 expression has also been associated with the poor clinical outcome of ovarian cancer.31 Similarly, SOX2 was also found to be a prognostic marker for detecting the early recurrence of breast cancer.32 In our study, we also found that SOX2 protein expression was closely associated with chemo-resistance and poor prognosis in EOC patients, which was consistent with the previous studies. Emerging data indicate that SOX2 expression is also enhanced in CSCs and positively contributes to the stemness of CSCs in several tissues, such as lung, skin and breast.29, 33-38 As observed in osteosarcoma,36 we found that 3D cultures enriched for ovarian CSCs induced increased SOX2 expression in serial replating assays, which is consistent with our microarray results. To explore whether SOX2 expression is sufficient to mediate stemness in EOC cells, we modulated SOX2 expression in EOC cell lines by SOX2 knockdown and overexpression. The data presented demonstrate that targeting SOX2 expression in ovarian CSCs disrupts sphere formation and chemotherapy resistance in vitro and tumorigenicity in vivo, whereas SOX2 overexpression in EOC cell lines shows the opposite effect. These results are consistent with those reported in a previous study that showed that SOX2 expression was associated with stem cell state in human ovarian carcinoma.38
The mechanism of SOX2 regulation in CSCs was recently identified in various tumors. In cutaneous squamous cell carcinomas, SOX2 was required for tumor growth in mouse and human, in which it enhanced Nrp1/Vegf signaling to promote the expansion of TICs along the tumor-stroma interface.35 In addition, Basu-Roy et al. found that SOX2-knockdown in osteosarcoma cells can reduce osteospheres formation, invasion and migration, as well as tumor formation in immunocompromised mice.36 Furthermore, the important role of SOX2 in maintaining the stemness of osteosarcoma cells may contribute to its antagonism against the tumor-suppressive Hippo pathway.39 In breast cancer, SOX2 was identified to promote the tumor-initiating capacity of breast cancer cells by reprogramming non-genomic estrogen signaling.37 To elucidate potential mechanisms of SOX2 regulation in ovarian spheroids, we performed qPCR analysis to explore the downstream of the SOX2 gene. We showed that downregulation of SOX2 gene in spheroid cells reduced the expression of CSC-related genes, such as BMI-1, β-catenin, KLF4, OCT4, NANOG and ALDH1A1. As is known, KLF4, OCT4, NANOG and SOX2 are pluripotency genes, which can promote the maintenance of pluripotency.40 Furthermore, in our study, we found that OCT4 knockdown has similar effects on CSC properties with that of SOX2 knockdown in the SK-sphere cells and HO-sphere cells, suggesting that SOX2 and OCT4 may regulate CSCs properties through the same pathway. In addition, a previous study reported that β-catenin was an important pathway activated in spheroids,17 and its activation has been implicated in the self-renewal and survival of hematopoietic, cutaneous and gastrointestinal stem cells.41-43 The data obtained from the current study indicate that SOX2 downregulation in ovarian spheroids is followed by the decreased expression of β-catenin. Besides, we also identified that SOX2 and β-catenin have a similar effect on the maintenance of CSCs. As is known, the wingless pathway, which is an upstream regulator of β-catenin, is required for the maintenance of somatic stem cells in the Drosophila ovary.44 Moreover, SOX2 was reported to directly bind to β-catenin and transcriptionally regulate osteoblast differentiation through the Wnt pathway.45 Therefore, we postulate that SOX2 may directly bind to β-catenin and activate the Wnt/β-catenin pathway to maintain the stemness of ovarian spheroids. However, future investigations should strive to verify this mechanism.
In summary, our study highlights the role of SOX2 in the maintenance of CSC characteristics of ovarian tumor spheroids. Blocking SOX2 function in ovarian cancer may be considered a basis for developing novel and effective therapeutic strategies targeting CSCs.
Acknowledgements
This research was supported by National Natural Science Foundation of China (81472443, 81572572).
Disclosure Statement
The authors have no conflict of interest.


