Exome-wide single-base substitutions in tissues and derived cell lines of the constitutive Fhit knockout mouse
Funding Information: Ohio State University College of Veterinary Medicine; Government of Egypt; Ohio State University Wexner Medical Center; National Cancer Institute
Abstract
Loss of expression of Fhit, a tumor suppressor and genome caretaker, occurs in preneoplastic lesions during development of many human cancers. Furthermore, Fhit-deficient mouse models are exquisitely susceptible to carcinogen induction of cancers of the lung and forestomach. Due to absence of Fhit genome caretaker function, cultured cells and tissues of the constitutive Fhit knockout strain develop chromosome aneuploidy and allele copy number gains and losses and we hypothesized that Fhit-deficient cells would also develop point mutations. On analysis of whole exome sequences of Fhit-deficient tissues and cultured cells, we found 300 to >1000 single-base substitutions associated with Fhit loss in the 2% of the genome included in exomes, relative to the C57Bl6 reference genome. The mutation signature is characterized by increased C>T and T>C mutations, similar to the “age at diagnosis” signature identified in human cancers. The Fhit-deficiency mutation signature also resembles a C>T and T>C mutation signature reported for human papillary kidney cancers and a similar signature recently reported for esophageal and bladder cancers, cancers that are frequently Fhit deficient. The increase in T>C mutations in −/− exomes may be due to dNTP imbalance, particularly in thymidine triphosphate, resulting from decreased expression of thymidine kinase 1 in Fhit-deficient cells. Fhit-deficient kidney cells that survived in vitro dimethylbenz(a)anthracene treatment additionally showed increased T>A mutations, a signature generated by treatment with this carcinogen, suggesting that these T>A transversions may be evidence of carcinogen-induced preneoplastic changes.
Recombinant mouse models are frequently used in preclinical studies of cancer initiation, progression, and treatment, but there have been few reports of genome sequencing of tumors developed in these models. Evaluation of such sequences is important for comparison to the many human cancer genome sequences for which mouse recombinant strains are models. In mouse models for mutant Kras lung and pancreatic cancer,1, 2 mutant Kras expression occurs early in most cells of the targeted organ and all mice develop cancer within months. In human pancreatic preneoplasias, mutant KRAS is frequently observed, but cancer will take >10 years to develop3 with concomitant development of extensive genome instability;4, 5 similar genome instability after a long development process occurs in human lung cancers.6 Thus, understanding the roles of extensive genome instability in parallel with suppressor loss and oncogene activation, through comparison of genome-wide sequencing results in human cancers versus mouse model cancers may allow optimal design of preneoplastic models for future preclinical therapeutic studies.
The human FHIT gene encompasses the chromosomal fragile site FRA3B (murine Fra14A2) and is frequently altered in cancers.7 Expression of FHIT, a “caretaker” gene whose loss of expression initiates genome instability and leads to replication stress and DNA double-strand breaks,8, 9 is lost or reduced in >50% of human cancers10 and occurs early in the preneoplastic process.11, 12 Fhit−/− mice develop more spontaneous tumors by 2 years of age than WT counterparts, including Muir–Torre syndrome-like sebaceous tumors, indicative of genome instability, and are several-fold more susceptible to carcinogen induction of tumors.13, 14
To understand how loss of a specific genome caretaker, such as Fhit, initiates genome instability and leads to clonal expansion and preneoplastic changes, we assessed whole exome sequences (WES) from cell lines and tissues of constitutive Fhit knockout versus WT mouse strains, before and after short-term carcinogen treatment. We examined in detail the numbers and types of single-base changes that accumulate in Fhit-deficient exomes to assess types and nucleotide contexts of Fhit loss-associated mutations, to further our understanding of the relationship between Fhit loss and genome instability, to identify mutation signature(s), and to compare to sequences in other murine cancer models.
Materials and Methods
Fhit−/− constitutive knockout mouse strain and C57Bl6/J (B6) backcrosses
In 2000, the original Fhit−/− mouse was produced in the 129SvJ mouse strain and backcrossed to B6.13, 14 Mice of this early backcross strain, designated 1st backcross, were previously examined for evidence of genome instability by copy number variation analyses (Jackson Laboratory Facility, Bar Harbor, ME, USA) and WES analysis (EdgeBio, Gaithersburg, MD, USA);9 the JAX and EdgeBio services have since been discontinued. The 1st backcross mice, 95.2% B6 single nucleotide polymorphisms (SNPs) by Taconic Background Strain Characterization Panel (GENCON-1449), were further backcrossed using the Taconic Speed Congenics Service to reduce the 129 strain contribution to <1%. A mouse from this 2nd backcross strain was used for additional WES analysis at Genome Quebec (Montreal, Quebec, Canada).
Mouse cell lines and tissues
1st backcross
We previously established embryo fibroblast and kidney epithelial cell lines from Fhit+/+ and −/− tissues and determined that these cells show genome copy number gains and losses.9 Kidney epithelial cell lines were: (i) Fhit+/+ mouse (+/+ kidney); (ii) Fhit−/− mouse (−/− kidney); (iii) single colony isolated from the −/− cell line (−/− clone 6); (iv) cells surviving dimethylbenz(a)anthracene (DMBA) treatment of the −/− cell line (−/− DMBA survivors).
Mouse tissues were obtained from livers of three +/+ and three −/− mice (10–14 days of age), one per group untreated, one per group receiving a single DMBA treatment and killed 1 week later, and one per group receiving a single DMBA treatment and killed 4 weeks later.9
Nutritionally stressed cell lines (−/− NS1, −/− NS4) were isolated from the early passage −/− Kd3 line (established from a single kidney of Fhit−/− 5-week-old mouse); +/+ cells did not survive this nutritional stress. See Table 1 for a summary of the cell lines and tissues used.
| Sample name | Description | WES facility | Mouse ID |
|---|---|---|---|
| 1st backcross | |||
| −/− Kidney | Kidney cell line | EdgeBio | 2100 |
| −/− Clone 6 | Kidney cell line | EdgeBio | 2100 |
| −/− DMBA survivors | Kidney cell line | EdgeBio | 2100 |
| −/− NS1 | Kidney cell line | Genome Quebec | 2300 |
| −/− NS4 | Kidney cell line | Genome Quebec | 2300 |
| −/− | Liver tissue | EdgeBio | 2200 |
| −/− 1 week DMBA | Liver tissue | EdgeBio | 2201 |
| −/− 4 week DMBA | Liver tissue | EdgeBio | 2202 |
| 2nd backcross | |||
| −/− Kidney tissue | Kidney tissue | Genome Quebec | 3507 |
| −/− Lung tissue | Lung tissue | Genome Quebec | 3507 |
| B6 control | |||
| +/+ Kidney | Kidney cell line | EdgeBio | 2110 |
| +/+ | Liver tissue | EdgeBio | 2210 |
| +/+ 1 week DMBA | Liver tissue | EdgeBio | 2211 |
| +/+ 4 week DMBA | Liver tissue | EdgeBio | 2212 |
- 1st backcross kidney cell lines were established from culture of a kidney from a Fhit+/+ 30-day-old B6 mouse (+/+ cell line) or a kidney from a Fhit−/− 30-day-old mouse (−/− kidney). The −/− clone 6 cell line was established from a single colony isolated from the −/− kidney cell line at passage 22. To establish the −/− dimethylbenz(a)anthracene (DMBA) survivor cell line, the −/− kidney cell line at passage 22 was treated with 20 μM DMBA for 24 h, plated for a colony assay and a mass culture of surviving colonies were grown for DNA preparation. The +/+ kidney DNA for whole exome sequences (WES) was prepared at passage 22. DNAs were isolated from each of the above cell lines for copy number variation, single nucleotide polymorphism analysis, and exome sequencing.9 An additional mouse kidney cell line was established from culture of a single kidney from Fhit−/− 5-week-old mouse (−/− Kd3 cell line). Nutritionally stressed cell lines (−/− NS1 and −/− NS4) were isolated from the early passage −/− Kd3 line. Lines NS1 and NS4 were stressed beginning at early culture passages and genomic DNA was isolated and sent to Genome Quebec for WES. 2nd backcross cell line, kidney and lung tissue DNA was extracted from a mouse from the F4 generation after speed backcrossing and sent to Genome Quebec for WES. NS, nutritionally stressed.
Exome sequencing
Sample preparation and exome sequencing of genomic DNAs from −/− mouse kidney and lung tissue and −/− NS1 and −/− NS4 mouse kidney cell lines were carried out by Genome Quebec. Samples were prepared using (Agilent, Santa Clara, CA, USA) SureSelect Mouse All Exon Kit; sequencing was done using (Illumina, San Diego, CA, USA) HiSeq 2000. Reads mapping and variants calling were carried out by Genome Quebec using the current MUGQIC DNA-Seq analysis protocol; BCFtools called the variants using B6 as the reference genome.15 The average read depth was 89.79–98.71 for kidney and lung tissue DNAs and 78.6–81.37 for kidney cell line DNAs; the number of bases read were ~3.5 times more than the number of bases read for samples sequenced by EdgeBio. Exome data was filtered to remove single base substitutions (SBSs) with low mapping quality (<10), variants calling score (<10), and reads depth (<10). Exome sequencing of genomic DNAs from mouse kidney cell lines and liver tissues and quality filtering was as described previously.9
As DNAs sent for exome sequencing had <1% (2nd backcross) or ~5% (1st backcross) 129 genome contribution, we removed SNPs contributed by the 129 mouse genome; data for individual chromosomes was downloaded from the Mouse Phenome Database16 by selecting the option to compare two mouse strains (129X1/SvJ and B6) and selecting CGD-MDA1, Broad2, JAXSNP1, and CGD-IMP2 datasets. Lists of all SNPs were downloaded; the available sequencing data for chromosome 7 was of very poor quality in all four datasets. The list of 129 SNPs was individually compared to the list of SBSs for each sequenced sample. Filtering was carried out to remove possible additional 129 SNPs (especially those on chromosome 7) or possible B6/drift mutations: SBSs common to (i) all +/+ and −/− samples were removed from each dataset; (ii) all +/+ samples and not found in any −/− sample were removed from each +/+ dataset; (iii) all −/− DNAs and not found in any +/+ DNA were removed from each −/− dataset; (iv) one +/+ and at least one −/− DNA were removed from all datasets; (v) both −/− NS1 and −/− NS4 kidney cell lines and one other −/− DNA and not found in any +/+ DNAs were removed from each −/− dataset. Additionally, SBSs not found in genes were removed from the datasets of the −/− kidney and lung tissues and −/− NS1 and −/− NS4 kidney cell lines sequenced by Genome Quebec. Note that filtering was applied to all samples; see Figure S1 for an outline of the application of filtering methods. For all exome data analysis, only SBSs passing the above filtering steps were used. Trinucleotide contexts of SBSs were determined using the UCSC genome browser.17
Statistics
All P-values were determined by one-tail paired Student's t-test using R t-test function. The three +/+ and −/− liver tissues were combined to generate the two groups used for the paired t-test.
Validation of SBSs
Genomic DNA used in PCR amplification reactions to validate individual and multiple SBSs was extracted as described previously.9 Genomic DNAs from 129SvJ and B6 mice were used as control DNAs for validation of mutations. Primers were designed to amplify selected loci with predicted individual or multiple SBSs; PCR amplification and sequencing was carried out using gene-specific primers and standard PCR and sequencing conditions. See Table S1 for a list of all genes containing SBSs and Table S2 for a list of primer pairs.
Results
Single base substitutions in +/+ and −/− tissue and cell line DNAs
Cell lines
The study of SBSs in +/+ and −/− kidney cell lines involved exome sequencing of DNAs from the following: (i) +/+ kidney; (ii) −/− kidney; (iii) −/− clone 6; (iv) −/− DMBA survivors; (v) −/− NS1; and (vi) −/− NS4. Tissues. Single base substitutions studies in +/+ and −/− tissues involved exome sequencing of DNAs from: (i) +/+ liver control; (ii) +/+ 1 week DMBA; (iii) +/+ 4 weeks DMBA; (iv) −/− liver control; (v) −/− 1 week DMBA; (vi) −/− 4 weeks DMBA; (vii) −/− kidney; and (viii) −/− lung. All samples were filtered as described in 2 and Figure S1 before additional analysis was carried out.
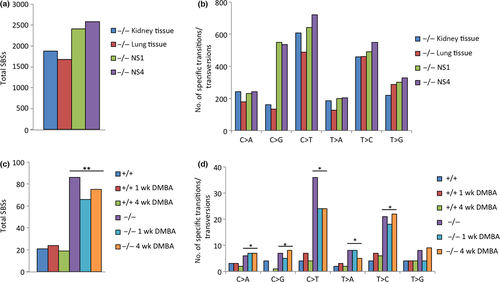
The −/− kidney and −/− lung tissue, as well as the −/− NS1 and −/− NS4 kidney cell line DNAs each showed more than 1500 total SBSs (Fig. 1a) and increased numbers of C>T and T>C SBSs compared to other SBS types (Fig. 1b). The −/− NS1 and −/− NS4 kidney cell line DNAs also revealed increased numbers of C>G SBSs compared to other SBS types (Fig. 1b).
Additionally, the −/− DMBA survivor kidney cell line demonstrated more than 300 exome SBSs, an increased number of SBSs compared to +/+, −/−, and −/− clone 6 kidney cell lines; the −/− DMBA survivor cell also showed differences in nucleotide transition and transversion SBSs compared to the +/+, −/−, and −/− clone 6 cell lines, particularly increased T>A SBSs (Fig. S2).
In light of this exome data on spontaneous SBSs in −/− cells and tissues, we were interested in comparing the numbers and types of SBSs in +/+ and −/− liver tissue DNAs using exome sequence data from six liver tissues with and without DMBA treatment (+/+, +/+ 1 week, +/+ 4 weeks, −/−, −/− 1 week, and −/− 4 weeks).9 Our analysis revealed a significant increase in the overall SBS load (Fig. 1c) and significantly increased numbers of most nucleotide transitions and transversions (C>A, C>G, C>T, T>A, and T>C SBSs) (Fig. 1d) in −/− versus +/+ liver tissues, based on exome sequences representing ~2% of the genome.
Mutation signatures in −/− cells and tissues
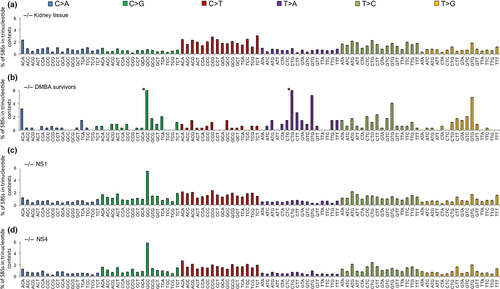
In a landmark study of more than 7000 human cancers of 30 types, >20 mutation signatures were identified18 including some associated with known cancer risk factors and DNA mismatch repair deficiency. There were also signatures for which there was no known exposure or risk factor. We examined the exome SBS signatures of Fhit−/− kidney tissue and DMBA survivors, NS1 and NS4 Fhit−/− kidney cell lines (Fig. 2) for similarities to these published signatures, particularly for C>G, T>A, C>T, and T>C SBSs.
C>G SBSs
The general mutation pattern for C>G SBSs is similar in the three kidney cell lines (Fig. 2b–d), particularly for the prominent peak for the GCC context SBSs. As the mutation pattern for C>G SBSs is found only in kidney cell lines, these SBSs may arise as a consequence of culturing in vitro.
T>A SBSs
The −/− DMBA survivor signature (Fig. 2b) is characterized by an increase in the number of T>A SBSs in the CTG and GTG trinucleotide contexts. DMBA has been shown to generate T>A mutations.19
C>T and T>C SBSs
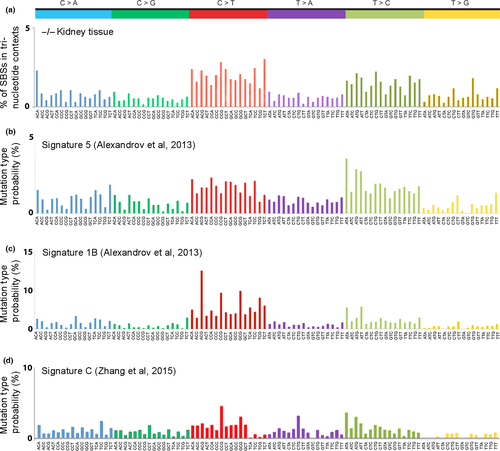
In addition to the mutation similarities among the signatures for the −/− kidney tissue, NS1, and NS4 exomes, there is also similarity to the signature associated with “age at diagnosis” in human cancers18 (compare Fig. 3a,c), as there are peaks for C>T transitions at ACG, CCG, and GCG trinucleotide sequences; these mutations likely arise as a result of spontaneous deamination at CpG dinucleotides. The age at diagnosis signature reflects the SBSs that have accumulated in normal tissues during a lifetime, suggesting these SBSs are independent of specific exposures, which vary among people (signature 1B,18 reproduced in Fig. 3c for comparison). Additionally, the signature for the −/− kidney tissue shows a similarity to the human papillary kidney cancer signature 518 (compare Fig. 3a,b), as both signatures display increased C>T and T>C transitions and similar levels of C>A, C>G, T>A, and T>G transversions.
Validation of selected SBSs in −/− DNAs
Confirmation of mouse WES data was carried out by PCR amplification and Sanger sequencing of amplified products of the kidney cell and kidney, lung, and liver tissue-derived DNAs. Single base substitutions selected for verification focused on SBSs located within exons and unique to a specific sample or tissue type. After design of specific primers, PCR amplification was carried out and amplification products sequenced to confirm presence of the alteration(s). Single base substitutions were visually confirmed for 34 of 70 (49%) SBSs analyzed from the −/− samples (Fig. S3). Also note that 6 of the 70 SBSs were found to be unfiltered 129 SNPs, so that really 34 of 64 (53%) were confirmed SBSs. Sequencing validation did not seem to be influenced by low (0.2–0.3) allele frequency values. Visual confirmation was by: (i) analyzing the chromatogram to identify the base altered at the SBS site, and if the base was the same as the listed “alternate allele”, the predicted SBS was confirmed; and (ii) if the chromatogram showed that two peaks were present at the same site, the predicted SBS was confirmed if one peak was the same as the listed “reference allele” and the other peak was the same as the listed “alternate allele” (Fig. S3). See Table S3 for summary of validated SBSs.
Mutated genes
Single base substitutions in −/− WESs found in validated genes of interest likely perform some function in normal cellular processes that, when disrupted by SBSs, contribute to cellular transformation and preneoplastic changes; for example, Mutyh, Tpx2, Nek9, Zfat, and Dlc1 (Table S3), genes that have roles in DNA repair, chromosomal instability, replication stress response, cell survival, and regulation of the Wnt/β-catenin signaling pathway.20-24 Additionally, the −/− kidney cell lines harbored the previously reported mutant Trp53 gene.9 Whole exome sequence analysis also predicted that validated SBSs in specific genes (Rbm12, Lgsn, and Obfc1) would result in the generation of premature stop codons in the encoded proteins. These findings suggest possible preneoplastic changes dependent on Fhit loss that could affect processes involved in tumorigenesis.
Data submission
Data have been submitted to the Sequence Read Archive database; accession numbers SRA: SRP046420 and BioProject: PRJNA260539.
Discussion
Fhit loss and genome instability
Loss of Fhit protein expression occurs in human precancerous lesions of lung, breast, cervix, and other organs.25, 26 Fifteen percent of Fhit−/− mice showed atypical hyperplasia of lymphoid tissue, a preneoplastic condition, and developed a spectrum of spontaneous tumors;14 carcinogen exposure caused a dramatic increase in tumor development in −/− mice versus +/+ mice; 20% of Fhit−/− mice in early generation 129SvJ intercross mice developed sebaceous tumors similar to those observed in Lynch syndrome-associated Muir–Torre syndrome but without evidence of mismatch repair associated microsatellite instability,13 providing early evidence of loss of Fhit caretaker function.8 Such sebaceous cancers in humans are now known to occur either through Fhit loss or deficiency in mismatch repair genes.27, 28 Results of these early studies of tumor susceptibility of the Fhit knockout mouse strain, together with the current demonstration of increased SBSs in −/− tissues and cells, illustrate the plasticity of the Fhit−/− genome, which underlies the susceptibility to spontaneous preneoplasias and induced tumors.
Fhit deficiency-associated mutation signatures
The SBS signatures compiled from WES of −/− kidney and lung tissue and −/− NS1 and −/− NS4 kidney cell lines revealed accumulation of >1000 SBSs and increased numbers of C>T and T>C SBSs (Fig. 1a,b) relative to the B6 WES, with a signature similar to the age at diagnosis mutation signature18 (Fig 3c, signature 1B), with peaks of mutations, similar but not identical to peaks in the Fhit−/− signature; compare the C>T and T>C peaks for the −/− kidney tissue and the signature 1B signatures in Figure 3, revealing the nucleotides at which spontaneous SBSs accumulate in the absence of selective pressure in an environment of Fhit loss. This age at diagnosis signature was observed in most types of human cancer, including cancers (e.g. kidney, lung, and pancreas) in which Fhit loss frequently occurs.7
Signature 5 of Alexandrov et al.,18 also somewhat similar to the “Fhit” signature as noted in Figure 3, is identified as a signature of unknown origin, although it also shows C>T and T>C mutations most prominently, as also observed in bladder29 and esophageal cancers,30 where this signature is also noted as due to unknown origin. Signature 5 was observed in 14.4% (a frequency second only to the APOBEC3B signatures) of the total cancers,18 some not widely shown to involve major changes in Fhit (thyroid, myeloma, medulloblastoma, and glioma low grade) and others well known to involve loss of Fhit expression (B-cell lymphoma, squamous cell lung cancer, adenocarcinoma of lung, and cancer of esophagus and bladder). This signature may be due to exposure to a thus far unidentified carcinogen that may lead to loss of Fhit expression in fractions of these cancers or to a combination of carcinogen exposure and Fhit loss. Another possibility is an unknown exposure that causes replication stress and imbalance in nucleotide pools for DNA synthesis.
C>T transitions, prominent SBSs in −/− kidney and lung tissue and −/− NS1 and −/− NS4 kidney cell line exomes, can be generated through spontaneous deamination31 or DNA replication errors32 at CpG dinucleotides. Single base substitution peaks for 5′-ACG, 5′-CCG, 5′-GCG, and 5′-TCG sequences, where the central C transitions to T, include such dinucleotide sequences.
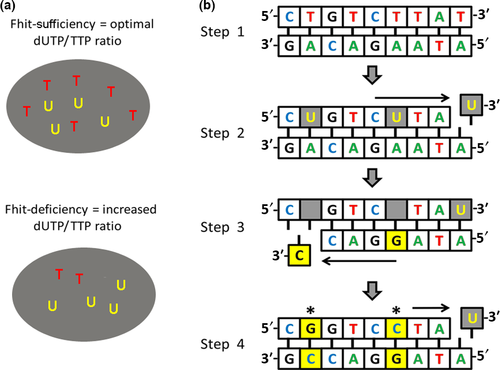
The increase in T>C SBSs in −/− exomes may be due in part to the imbalance of dNTPs, particularly thymidine triphosphate, as a consequence of decreased TK1 expression (Fig. 4). The T>C transitions observed in the Fhit−/− tissues may thus be due to the increased ratio of dUTP:TTP, allowing misincorporation of dUTP in place of TTP. Incorporation of dUTP into genomic DNA is a major source of abasic sites due to enzymatic removal of uracil by uracil DNA glycosylase.33 Depending on the involved translesion polymerase, DNA replication preferentially inserts a guanine or a cytosine across from abasic sites; following another round of DNA replication, this results in a T>C or a T>G SBS.34, 35 Thus, the T>C transitions shown in Figure 2(a,c,d) may be a specific SBS signature of Fhit-deficient cells.
Another aim of our study was to seek evidence of preneoplastic changes in the DNA of DMBA survivor kidney cells and livers of DMBA-treated mice. Exome sequences of the liver DNAs of DMBA-treated mice of 1- and 4-week duration did not reveal a DMBA-specific SBS signature or increase in mutations. In contrast, the −/− DMBA survivor kidney cell line showed an increase in T>A SBSs compared to +/+ and −/− kidney cell exomes. Genes with validated T>A SBSs (Cpne5, Lgsn, Mutyh, Pfkp, Tfap2b, Tpo, and Tpx2) are important for functions such as apoptosis,36 DNA repair,20 and tumor development.21 Treatment with DMBA has been shown to generate T>A mutations,19 with adenines and guanines as the major targets of DNA modification.37 The results suggest that the T>A transversions observed in the −/− DMBA survivor cells are evidence of DMBA-induced preneoplastic changes.
Mutation signatures of Fhit−/− and other model exomes
Our examination of elevated levels of SBSs in Fhit-deficient tissues and cultured cells gives a fuller picture of the mild genome instability associated with Fhit loss and provides a basis for consideration of the relevance of genome instability in mouse versus human models of cancer development. With the recent publication of genome-wide sequencing of mouse models of cancer development in comparison with analogous human cancers38, 39 it is becoming clear that genome instability may play a larger role in development of human cancers than in relevant mouse models.5 For example, mouse models of mutant Kras-induced lung and pancreatic cancers uniformly develop cancers in all mice after months rather than the 10–20 year latency observed for analogous human cancers developing from Kras-mutated preneoplasias, (2-5, 38) suggesting that mouse models may not need extensive genome instability for cancer development. If genome instability is not a prerequisite for cancer development in mouse models of human cancers, does this diminish their usefulness as preclinical models for understanding and treating human cancers? Perhaps so; thus, it may be useful to examine more mouse models involving the type of genome instability observed in human cancers.
Results of several recent mouse genome sequencing studies address this question. Whole exome sequencing of DNAs from adenomas of three mouse models of non-small-cell lung cancer, induced by exposure to carcinogens or by genetic activation of mutant Kras,38 showed that, although the carcinogen-induced tumors carried the same initiating mutation in Kras as in the Kras genetic model,40, 41 carcinogen-induced tumor exomes had far more SBSs compared with tumors of the Kras genetic model;38 Kras genetic model tumors showed a higher level of copy number alterations, suggesting carcinogen-induced and genetically engineered models develop tumors through different routes.38 The carcinogen-induced tumors displayed signatures of the initiating carcinogen as well as additional C>T mutations at CpG sites. A notable signature was not present for the genetically induced tumors.
Would genome sequencing of carcinogen-induced cancers in Fhit-deficient mouse strains reveal allele gain/loss and SBS signatures similar to the Kras mutant-associated adenomas reported in Westcott et al.,38 or signatures similar to carcinogen-induced human lung and pancreatic cancers? We propose that determining the answers to these questions concerning mutation signatures of tumor models in Fhit-deficient mice will provide useful information about development of mutation signatures associated with development of preneoplastic and neoplastic lesions that resemble mutation development in analogous human lesions, as well as providing models for prevention of progression of such preneoplasias.
Acknowledgments
We thank Thomas Ludwig of Ohio State University (OSU) for 129 genomic DNA and Mathieu Bourgey of McGill University, Genome Quebec Innovation Centre, for assistance with bioinformatics analysis. We acknowledge the Plant-Microbe Genomics Facility and Genomics Shared Resource at the OSU Comprehensive Cancer Center for assistance in sequencing analyses. This work was supported by a training grant fellowship from the OSU College of Veterinary Medicine (9T32 OD010429 to MSS), a fellowship from the Egyptian government (to IO), a predoctoral fellowship from the OSU Wexner Medical Center (to CEW), and the National Cancer Institute (CA120516 and CA154200 to KH).
Disclosure Statement
The authors have no conflict of interest.


