Prognostic factors and survival outcome of primary pulmonary acinar cell carcinoma
Fan-jie Meng and Zhao-nan Sun contributed equally to this work.
Funding information: National Natural Science Foundation of China, Grant/Award Number: 81601411
Abstract
Purpose
The objective of our study was to investigate the epidemiologic characteristics and prognostic factors in patients with pulmonary acinar cell carcinoma (PACC).
Methods
PACC patients diagnosed between 1975 and 2016 were identified from the Surveillance, Epidemiology, and End Results (SEER) database. The trend in PACC incidence was assessed using joinpoint regression software. Overall survival (OS) and disease-specific survival (DSS) were evaluated using the Kaplan–Meier method and log-rank test. Univariate and multivariate Cox regression analysis was performed to identify the independent prognostic factors for OS and DSS. Nomograms to predict survival possibilities were constructed based on the identified independent prognostic factors.
Results
A total of 2918 patients were identified with PACC. The mean age was 65.2 ± 8.95 years with a female to male of 1.6:1. The incidence of PACC steadily increased by an annual percentage change (APC) of 3.2% (95% CI 2.1–4.4, p < 0.05). Multivariate Cox regression analysis revealed that age, gender, race, stage, grade, tumor size, number of positive lymph nodes, surgery, and chemotherapy were independent prognostic factors for survival. Nomograms specifically for PACC were constructed to predict 1- and 5-year OS and DSS possibility, respectively. The concordance index (C-index) and calibration plots showed the established nomograms had robust and accurate performance.
Conclusion
PACC was rare but the incidence has been steadily increasing over the past four decades. Survival has improved in recent years. Surgery or chemotherapy could provide better OS and DSS. The established nomograms specifically for PACC were robust and accurate in predicting 1- and 5-year OS and DSS.
INTRODUCTION
The most common type of lung cancer is pulmonary adenocarcinoma. It usually starts in the peripheral airways as non-small-cell lung cancer.1 Primary pulmonary acinar cell carcinoma (PACC) is an uncommon type of lung adenocarcinoma with an unknown cause. It accounts for less than 0.1% of all cases.2 PACC was first introduced in 1972 and has been widely recognized since then.3 To diagnose the tumor, the pathologists investigate the carcinoma cells microscopically. Subtypes are indicated according to the observation of the primary pathological pattern of histology.4 A growing number of studies are being conducted to determine the impact of this lung cancer with a favorable prognosis. The most recent revisions to the National Comprehensive Cancer Network's recommendations have increased the need for further information about PACC.5
The SEER database (Surveillance, Epidemiology, and End Results) is an authoritative cancer statistics database in the United States that records the incidence, mortality, and disease status of millions of patients with malignant tumors. SEER is an excellent source for researchers who suffer from a limited amount of data.6 In addition, the extensive sample size and statistical validity of the SEER database contribute to the superior value of SEER-based studies.7 Similar to those rare diseases, no standardized proposal is available for PACC. Our present knowledge of PACC is mainly derived from case reports or review.8 There have not been reported studies on the pathogenesis, treatment, and survival of PACC at the level of extensive cohorts. The SEER database makes a promising asset for research into PACC even though prospective data or clinical trials are somewhat restricted.9 In the present study, we characterized the prevalence, proportional factors, and survival risks of PACC with the SEER database. We also described independent prognostic factors of PACC and attempted to establish prognostic nomograms to support us in evaluating prognosis precisely.
MATERIALS AND PROCESSES
Patients
From 1975 to 2016 we retrieved data on PACC patients diagnosed using the SEER*Stat software from the SEER database. To reduce the danger of secondary pulmonary involvement in terminal systemic or neighboring acinar cell carcinoma, we focused on the identification of PACC with initial sites limited to the lungs and bronchi and no prior tumor. International Classification of Diseases for Oncology, 3rd edition (ICD-O-3) histologic codes 8550/3 was adopted to define acinar cell carcinoma, and site-specific code (ICD-O-3/WHO 2008) “lung and bronchus” was applied to classify acinar cell carcinoma, mainly confined to the lung and bronchus. All available qualified patients were enrolled basing on pathological verification. Patients were excluded if their message was inadequate.
Our study included the following demographic and clinicopathological variables: age, sex, race, year of diagnosis, surgery, radiation, chemotherapy, survival months, vital status, and cause of death. Race was classified as white, black, and others (American Indian/Alaskan Native or Asian/Pacific Islander). To evaluate the survival curves of PACC over the past years, we also classified patients with PACC according to the year of diagnosis. The main aims of our investigation were overall survival (OS) and disease-specific survival (DSS).
Statistical analyses
The incidence rates of PACC were calculated per 100 000 persons and age-adjusted to the 2000 US Standard Population using SEER*Stat (version 8.3.8). Annual percentage changes (APCs) were calculated using the National Cancer Institute join-point regression analysis program (version 4.8.0.1). Estimated OS and DSS were calculated with the Kaplan–Meier method and compared by log-rank test. The Cox regression model was applied in the univariate and multivariable analysis.
The results of Cox regression analysis in the patients were combined to construct the nomograms for predicting 1-, 3-, and 5-year OS and DSS, respectively. The nomogram performance was assessed using Harrell's concordance index (C-index), which could estimate the discrimination between the predicted and actual survival. We also built calibration curves to identify whether the predicted and actual survival were in agreement.
All statistical analysis was performed using R software (version 4.3.0). The R package included survival, survminer, rms, rmda, and ggplot2. Statistical significance was set at a two-sided p value <0.05.
RESULTS
Demographics and incidence of PACC patients
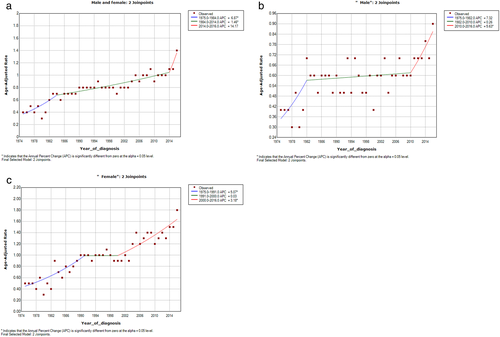
The survey characterized 2918 patients with PACC from 1975 to 2016. The incidence rate has grown consistently over the years, with an APC of 3.2% (95% CI 2.1–4.4, p < 0.05) (Figure 1(a)). The trend appears to be more pronounced in the male group. (Figure 1(b),(c)). The age-adjusted annual incidence of PACC was 0.4 per 100 000 in 1975 and increased to 1.4 per 100 000 in 2016. The mean age at diagnosis was 65.2 ± 8.95, with a wide range of 22–79 years. The whole cohort consisted of 1140 (39.1%) males and 1778 (60.9%) females. The majority of patients were white (79.7%). The characteristics of PACC patients in the cohort are described in Table 1.
| Characteristic | No. of patients | Percentage (%) |
|---|---|---|
| Total | 2918 | 100 |
| Age at diagnosis | ||
| Mean ± SD | 65.2 ± 8.95 | |
| Median(rang) | 66 (22–79) | |
| Sex | ||
| Male | 1140 | 39.1 |
| Female | 1778 | 60.9 |
| Race | ||
| White | 2327 | 79.7 |
| Black | 237 | 8.2 |
| Asian/Indian | 299 | 10.2 |
| Others | 55 | 1.9 |
| Year of diagnosis | ||
| 1975–1994 | 53 | 1.8 |
| 1994–2005 | 444 | 15.2 |
| 2005–2016 | 2421 | 82.9 |
| Grade | ||
| I | 455 | 15.5 |
| II | 1633 | 55.9 |
| III | 470 | 16.1 |
| IV | 10 | 0.3 |
| Other/unclassified | 350 | 12.0 |
| Stage | ||
| IA | 621 | 21.3 |
| IB | 338 | 11.6 |
| IIA | 132 | 4.5 |
| IIB | 88 | 3.0 |
| IIIA | 173 | 5.9 |
| IIIB | 22 | 0.7 |
| IV | 211 | 7. |
| Other/unclassified | 1333 | 45.8 |
| Tumor size (cm) | ||
| ≦1 | 137 | 4.7 |
| 1–3 | 1352 | 46.3 |
| 3–5 | 470 | 16.1 |
| 5–7 | 148 | 5.1 |
| >7 | 65 | 2.2 |
| Other/unclassified | 746 | 25.6 |
| Regional lymph nodes | ||
| Negative/unknow | 2404 | 82.4 |
| Positive | 514 | 17.6 |
| Surgery | ||
| No/unknow | 496 | 17.0 |
| Performed | 2422 | 83.0 |
| Radiation | ||
| No/unknow | 2465 | 84.5 |
| Performed | 453 | 15.5 |
| Chemotherapy | ||
| No/unknow | 2068 | 70.9 |
| Performed | 850 | 29.1 |
As for grade, there were 455 (15.5%) patients of grade I, 1633 (55.9%) grade II, 470 (16.1%), grade III, and 10 (0.3%), grade IV. Morphologically, tumor diameter subgroups of 1–3 cm (46.3%) were the most common, followed by 3–5 cm (16.1%), 5–7 cm (5.1%), 0–1 cm (4.7%), and >7 cm (2.2%). Just a subset of patients received radiation therapy (15.5%) or chemotherapy (29.1%). Most of them underwent surgery (83.0%).
Survival analysis
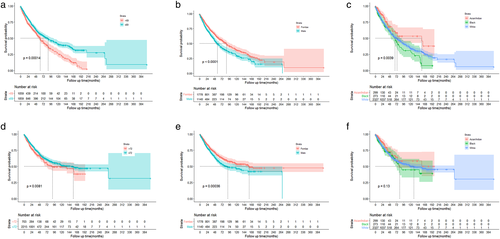
The OS and DSS of those patients with PACC are shown in Figure 2(a),(b). In total 2772 patients died by the end of 10 years. Kaplan–Meier survival analysis revealed a median OS and DSS of 73 and 134 months for these patients, respectively. The 1-, 3-, and 5-year OS and DSS were 66.82%, 30.02%, and 14.42%, respectively.

Kaplan–Meier survival was performed on patients for age, sex, race, stage, grade, tumor size, number of positive lymph nodes, and treatment strategy. We observed that advanced age was significantly associated with poor OS and DSS (Figure 3(a),(d)). Women prefer to receive OS and DSS for a longer period of time than men (Figure 3(b),(e)). Univariate analysis also showed a favorable outcome for Asian and Indian patients (Figure 3(c),(f)).
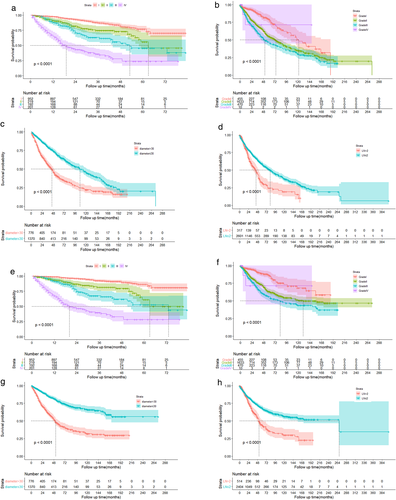
In the overall cohort, OS and DSS were optimal for those with stage I, tumor size ≦2 cm, and fewer than two positive lymph nodes. Figure 4 shows the Kaplan–Meier curves of OS and DSS for stage, tumor size, and number of positive lymph nodes.
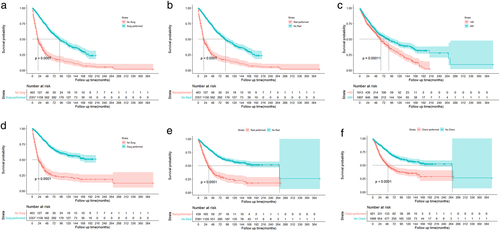
Respecting the therapeutic strategy, patients who underwent surgery had remarkably better OS and DSS than those who did not (Figure 5(a),(d)). However, radiotherapy and chemotherapy have a reverse consequence on OS and DSS (Figure 5(b),(e),(c),(f)).
Multivariate Cox regression analysis was used to identify independent predictive variables for OS and DSS. The results demonstrated that age, gender, race, stage, grading, number of positive lymph nodes, surgery, and chemotherapy all independently prescribe OS and DSS (Table 2).
| Variables | Overall survival | Disease-specific survival | ||||
|---|---|---|---|---|---|---|
| HR | 95% CI | p | HR | 95% CI | p | |
| Age at diagnosis, years | ||||||
| ≦69 | Reference | Reference | ||||
| >69 | 1.2 | 1.1–1.3 | 0.006 | 1.2 | 1.1–1.3 | <0.001 |
| Sex | ||||||
| Female | Reference | Reference | ||||
| Male | 1.4 | 1.1–1.8 | 0.001 | 1.3 | 1.1–1.7 | 0.04 |
| Race | ||||||
| Asian/Indian | Reference | |||||
| Black | 1.4 | 0.88–2.3 | 1.4 | 1.4 | 0.88–2.3 | 0.15 |
| White | 1.6 | 1.1–2.3 | 0.022 | 1.6 | 1.1–2.3 | 0.022 |
| Stage | ||||||
| I | Reference | |||||
| II | 2.7 | 1.8–3.7 | <0.001 | 3.6 | 2.3–5.5 | <0.001 |
| III | 3.1 | 2–4.6 | <0.001 | 4.6 | 2.6–6.7 | <0.001 |
| IV | 5.3 | 3.6–7.9 | <0.001 | 7.4 | 4.7–12 | <0.001 |
| Tumor size(cm) | ||||||
| ≦2 | Reference | |||||
| >2 | 1 | 0.9–1.1 | 0.082 | 1.2 | 1.1–1.3 | 0.019 |
| Number of lymph nodes | ||||||
| ≦2 | Reference | Reference | ||||
| >2 | 1.2 | 1.1–1.3 | <0.001 | 1.2 | 1.1–1.3 | <0.001 |
| Grade | ||||||
| IV | Reference | |||||
| III | 1.3 | 0.9–1.8 | 0.17 | 1.2 | 0.7–1.7 | 0.32 |
| II | 1.1 | 0.78–1.5 | 0.67 | 1.2 | 0.8–1.6 | 0.58 |
| I | 0.41 | 0.25–0.66 | <0.001 | 0.37 | 0.23–0.65 | <0.001 |
| Surgery | ||||||
| <1 lobe resection | Reference | Reference | ||||
| ≧1 lobe resection | 1.3 | 0.55–3.3 | 0.52 | 1.4 | 0.55–3.5 | 0.47 |
| Pneumonectomy | 1.7 | 0.53–5.4 | 0.37 | 1.9 | 0.53–5.6 | 0.36 |
| No surgery | 5.8 | 2.3–15 | <0.001 | 5.7 | 2.3–14.9 | <0.001 |
| Chemotherapy | ||||||
| No/unknow | Reference | Reference | ||||
| Performed | 2 | 1.5–2.7 | <0.001 | 2 | 1.5–2.8 | <0.001 |
| Radiation | ||||||
| No/unknow | Reference | Reference | ||||
| Performed | 0.92 | 0.7–1.2 | 0.59 | 0.94 | 0.71–1.2 | 0.64 |
Construction and validation of the nomograms
We concentrated on 2918 PACC patients to prepare a novel prognostic model specifically for PACC patients. Therefore, we first performed univariate and multifactorial Cox regression analyses to determine the independent prognostic factors for OS and DSS, respectively. The results of the univariate and multifactorial analyses are shown in Table 2.
Univariate analysis revealed that age, gender, race, stage, grade, tumor size, number of positive lymph nodes, surgery, chemotherapy, and radiotherapy were relevant to OS and DSS. Within the multivariate Cox regression analysis, radiation dose and tumor size dropped out of significance, while other variables were still significant. These remarkable variables derived in the univariate Cox regression analysis were subsequently integrated into the multivariate analysis.
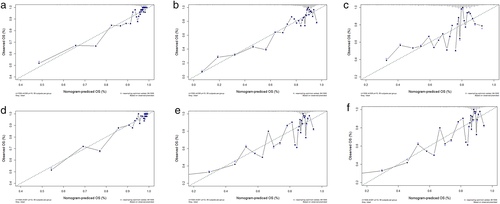
These were followed by integration of all independent remarkable variables from Cox regression analysis to calculate a prognostic nomogram. Figure 6(a) illustrates the OS nomogram at 1 and 5 years, and Figure 6(b) shows the DSS nomogram at 1 and 5 years. The probabilities of 1- and 5-year OS and DSS can be evaluated by accumulating the associated scores for each parameter, with the total score projected to the bottom level. In addition, we performed an analysis with c-index and calibration curves to investigate the capabilities of the nomograms. The c-indexes for the prediction of the OS and DSS nomograms were 0.788 and 0.804, respectively, indicating the high accuracy of the newly established nomogram. Likewise, calibration curves for the training and validation cohorts indicate favorable correlation between nomogram predictions and the actual OS and DSS at 1, 3, and 5 years (Figure 7).

DISCUSSION
Due to its rarity, little information on the incidence, features, and prognosis of PACC is known.10 As a result, the current study evaluated a cohort of PACC patients from SEER registrations across the United States. This analysis supports a variety of critical conclusions. With an APC of 3.2% (95% CI 2.1–4.4, p < 0.05), we noticed an increasing incidence of PACC over the last four decades, which could be attributed to the growing awareness of this disease as a separate type over time. We conducted the current study to evaluate the pathophysiology, considering the most recent PACC data in the SEER database. In our study, the median age at diagnosis was 65.2 ± 8.95 years, which was slightly older than the previously reported age. Senior age has been correlated with worse outcome in both OS and DSS. The ratio of women to men in PACC was 1.6:1. This suggests a possible role of sex hormones contributing to the etiopathogenesis of PACC. Moreover, our work identified female as a favorable predictive variable for OS and DSS. Furthermore, the prognosis of PACC differs remarkably by race, with blacks suffering shorter survival.
Presently, there are no detailed, defined treatment regimens for PACC. Surgery, chemotherapy or radiotherapy individually or in conjunction have been broadly applied.11 PACC's therapeutic outcome is determined by a number of indicators, including the tumor's grade, size, and number of positive lymph nodes. In the real world, chemotherapy is regularly considered for patients who are at high surgical risk and are not candidates for surgery, such as those with unresectable neoplasms, terminal invasion of adjacent organs or even developed malignancy of any histological type. In fact, the survival period of such cases is comparatively limited. The routine therapy for PACC is surgery (with/without chemotherapy or radiotherapy), and since 2016 immune checkpoint antibodies have been included in the lung adenocarcinoma protocol with better outcomes and accepted adverse events.12 In addition, chemotherapy did not benefit patients in terms of survival. The effectiveness of chemotherapy in patients with PACC should be evaluated further.
Remarkably, the significance of surgical treatment has not been adequately highlighted. Surgical excision should usually be performed since the state is less moderately advanced. Lobectomy can provide PACC patiens a longer survival time than unresectable patients. The impact of various operation categories on patient survival was not statistically significant. Multiple studies have shown that surgical resection alone or in combination with chemotherapy/radiation therapy leads to a positive outcome, similar to some of the other lung cancers.13-15 As a result, first-line surgical excision followed by chemotherapy/radiotherapy is expected to have a favorable outcome in PACC, requiring further evaluation. Nonetheless, more research is needed for therapy judgment in PACC, since most studies are based on reviewed surveys of small groups and randomized controlled trials are inadequate.
In clinical practice, the nomogram has become a prominent prediction model.16 Age, gender, race, stage, grade, tumor size, number of positive lymph nodes, surgery, and chemotherapy were found to be independent prognostic factors affecting OS and DSS in patients with PACC, according to our report, and nomogram 1- and 5-year OS and DSS prediction methods based on these factors were established. Validation of the nomogram is done to avoid overfitting and ensure universal applicability.17, 18 The identification plots showed much higher c-index plots during our investigation. The calibration curves between predicted and actual survival across the cohort suggested a beneficial consistency. We were able to predict the survival probability of individuals and establish a subjective follow-up plan with the help of nomograms in our research.
However, our study has a couple of restrictions. First, our study is review-based and has inherent biases. Second, there are multiple further factors that may influence survival, such as pathology subtypes, symptoms, and several biomarkers.1, 19 Yet, the SEER database was not documented for those variables, therefore these potential prognostic variables were not consolidated into our nomograms. Lastly, the time interval of PACC patients included in the present research was long (41 years), during which many categories and staging have varied. This could have impacted the incidence, prognosis, and treatment, which we settled by dividing the time of diagnosis into 1975–1994, 1994–2005, and 2005–2016 time periods. As mentioned above, the findings of our analysis may require careful construction. Still, despite those restrictions, the SEER database is a valuable reference for the investigation of this relatively rare cancer.20 Our profiling maintains essential insights into PACC and offers valuable knowledge on the morbidity, predictive factors, and survival of patients with PACC, following the analogous statistical methods.21
In conclusion, our population-based study has demonstrated that PACC is a rare lung adenocarcinoma with an increasing incidence trend, particularly in men. Surgery is related to a better prognosis and should be considered for patients with PACC. We also created two accurate and appropriate nomograms that doctors may use to evaluate the prognosis and create individualized follow-up strategies.
ACKNOWLEDGMENTS
This work was supported by the National Natural Science Foundation of China (No. 81601411).
CONFLICT OF INTEREST
No potential conflicts of interest are disclosed.


