Metagenome association study of the gut microbiome revealed biomarkers linked to chemotherapy outcomes in locally advanced and advanced lung cancer
Abstract
Background
The gut microbiome is important in the development and immunotherapy efficacy of lung cancer. However, the relationship between the intestinal flora and chemotherapy outcomes remains unclear and was investigated in this study.
Methods
We analyzed baseline stool samples from patients with locally advanced and advanced lung cancer before chemotherapy treatment, through metagenomics of the gut microbiota. The composition, diversity, function, and metabolic pathway analysis were compared among patients with different clinical outcomes.
Results
From 64 patients, 33 responded to treatment (responders) and 31 did not (nonresponders). Streptococcus mutans and Enterococcus casseliflavus were enriched in responders (P < 0.05), while 11 bacteria including Leuconostoc lactis and Eubacterium siraeum were enriched in nonresponders (P < 0.05) by variance analysis. Responders were associated with significantly higher Acidobacteria and Granulicella, while Streptococcus oligofermentans, Megasphaera micronuciformis, and Eubacterium siraeum were more abundant in nonresponders by Lefse analysis. Streptococcus mutans and Enterococcus casseliflavus were further identified as bacterial markers relevant to responders using unsupervised clustering, and Leuconostoc lactis and Eubacterium siraeum were related to nonresponders. The L-glutamate degradation VIII pathway was enriched in responders (P = 0.014), and the C4 photosynthetic carbon assimilation cycle, reductive TCA cycle I, and hexitol fermentation to lactate, formate, ethanol, and acetate were enriched in nonresponders (P < 0.05). Additionally, significant associations of bacterial species with clinical phenotypes were observed by Spearman correlation analysis.
Conclusions
The specific gut microbiome of patients with lung cancer might be connected to the clinical outcomes of chemotherapy.
Key points
Significant findings of the study
- Lung cancer patients with different gut microbiome compositions and microbiome metabolic pathways have different responses to chemotherapy. Microbiome species are also associated with different lung cancer clinical phenotypes.
What this study adds
- We have identified specific gut microbiome species that can be used as relevant biomarkers for chemotherapy outcomes. This can potentially be used to guide clinical treatment decisions.
Introduction
Lung cancer is one of the most commonly diagnosed cancers worldwide.1 More than half of patients are diagnosed at locally advanced and advanced stages, with a five-year survival rate of less than 15%.2 Developing ways to effectively treat lung cancer is the top priority of cancer clinical research work. Revolutionary progress of immune checkpoint inhibitors has ushered in a new era of lung cancer treatment.3, 4 However, immunotherapy only has been reported to elicit durable responses in 20%–30% of patients,5 and platinum-based chemotherapy is still the cornerstone treatment.6 Despite continuous progress, the clinical outcomes of chemotherapy are still uneven and lack predictors. Early identification of patients who are sensitive or resistant to chemotherapy is very important to guide treatment and improve survival. It is therefore clinically significant to develop convenient and noninvasive biomarkers for the prediction of chemotherapy outcomes.
The human gut microbiome contains nearly 100 trillion interdependent microorganisms, which include bacteria, viruses, fungi, and protozoa, which participate in the maturation and maintenance of the immunological system, metabolism, and other processes to ensure homeostasis,7 while dysbiosis of the gut microbiome is related to the occurrence and development of multiple diseases.8 Previous studies have focused on the correlation between the gut microbiota and chronic intestinal diseases or the differentiation of the immune system.9, 10 Gut microbiome can also regulate the development and treatment outcomes of cancers,11-14 and certain metabolites, such as short chain fatty acids and bile acids, are proposed to be critical mediators.15
The gut microbiota can modulate responses to immunotherapy in lung cancer and might serve as a biomarker for immunotherapy outcome prediction.16 In a study enrolling 42 advanced lung cancer patients undergoing programmed death 1 blockade therapy, patients with higher baseline diversity of the gut microbiome and enrichment of Alistipes putredinis, Bifidobacterium longum, and Prevotella copri had better responses, whereas Ruminococcus was overrepresented in nonresponding patients.17 Another cohort study showed that the abundance of Akkermansia muciniphila, via the recruitment of CCR9+, CXCR3+, and CD4+ T lymphocytes, was positively correlated with immune efficacy in lung cancer.18
The efficacy and toxicity of chemotherapy drugs can be regulated by the gut microbiome in multiple ways, including microbiota-mediated biochemical transformation.19 For example, gemcitabine might be degraded by bacterial cytidine deaminase, resulting in poor treatment outcomes,20 and irinotecan could be converted to toxic metabolites by bacterial beta-glucuronidase.21 A lung cancer mouse model showed that normal intestinal flora, such as Lactobacillus, may enhance the antitumor effect of cisplatin by increasing serum levels of interferon gamma (IFN-γ).22 However, the relationship between the metabolism of most chemotherapeutic drugs and intestinal microorganisms and the exact role of the gut microbiome in systemic chemotherapy schemes for patients with locally advanced and advanced lung cancer are not clear. Moreover, the correlations between gut bacteria and certain chemotherapy prognostic indices have not been observed.
Therefore, we conducted a metagenome sequencing analysis of microbiota in stool samples to analyze the correlation between clinical outcomes and the gut microbiome and explore whether specific flora can predict chemotherapy outcomes in patients with lung cancer.
Methods
Research patients and subjects
We conducted a single-site, correlative study on the relationship between the gut microbiome and first-line systematic chemotherapy outcomes in locally advanced and advanced lung cancer patients. This study was approved by the Research Ethics Board of the Cancer Hospital of the Chinese Academy of Medical Sciences (Beijing, China) (Ethics Approval Number: 20/226-2422), was conducted in accordance with the principles of the Helsinki Declaration, and informed consent was obtained from all subjects.
Patients treated with first-line chemotherapy were enrolled in the study between 1 September 2018 and 30 September 2019. The following exclusion criteria were strictly followed: (i) the clinical diagnosis of mental disorders; (ii) a history of gastrointestinal surgery; (iii) a previous diagnosis of a gastrointestinal disease, any autoimmune or metabolic disease; (iv) combined with treatments for other cancers; (v) the occurrence of acute or chronic infections in the past six months; and (vi) use of antibiotics, probiotics, or steroids within the past six months. All patients had a first time definite histological pathological diagnosis of lung cancer according to the diagnostic criteria proposed by the eighth edition of the American Joint Committee on Cancer in 2018,23 and had been prescribed systemic first-line chemotherapy. No patients received radiotherapy, targeted therapy, surgery, or immunotherapy for lung cancer before sample collection. Patients had to have measurable lesions according to the response evaluation criteria in solid tumors version 1.1 (RECIST v1.1).24 Tumor size was assessed by computerized tomography and/or magnetic resonance imaging within four weeks before the start of treatment. The treatment strategies for patients enrolled included: (i) pemetrexed combined with cisplatin or carboplatin ± bevacizumab for patients with lung adenocarcinoma; (ii) paclitaxel or gemcitabine in combination with cisplatin or carboplatin for lung squamous cell carcinoma; (iii) etoposide in combination with cisplatin or carboplatin for small cell lung cancer; (iv) paclitaxel combined with cisplatin or carboplatin for lung adenosquamous carcinoma. Repeat examinations and scans were taken after every two cycles of chemotherapy. Clinical effects were evaluated using the RECIST v1.1 criteria,24 and patients were divided into responders (R) and nonresponders (NR) according to treatment efficacy. Progression-free survival (PFS) was defined as the interval (in months) from the date of chemotherapy to the date of progression. Moreover, chemotherapy-related myelosuppression and gastrointestinal reactions were recorded for each patient according to the National Cancer Institute's common terminology criteria for adverse events version 3.0.25
Sample collection and storage
Stool samples were collected after diagnosis and before any treatment. All participants had a bland diet and did not smoke or consume alcohol the day prior to sample collection. Fecal samples were taken at a fresh feces center using a sterile cotton swab, placed in a sterile plastic vial mixed with phosphate-buffered saline, immediately transferred to −80°C, and stored until further processing.
DNA extraction and sequencing
Fecal bacterial DNA was extracted using the QIAamp PowerFecal Pro DNA Kit (QiaGen, Venlo, Netherlands). Sodium dodecyl sulfate–Tris solution, glass beads (diameter 0.1 mm) (BioSpec), and EDTA-Tris-saturated phenol were added to the suspension, and the mixture was vortexed vigorously by a FastPrep-24 (MP Biomedicals) for 30 seconds, with a collection of the supernatant after centrifugation at 20 000 g for five minutes. A phenol-chloroform extraction was performed followed by isopropanol precipitation, and the DNA was stored at −20°C. The concentration and purity of the DNA was tested on 2% agarose gels. The amplified DNA was subjected to library preparation (KAPA HyperPlus PCR-free) and sequenced on the Illumina MiSeq platform as per the manufacturer's instructions (Illumina technologies, USA).
Data quality control
Raw data passed quality control by MOCAT2 and low-quality reads were discarded.26 Cutadapt software (version v1.14, -m30) was used to remove the sequencing adapter. Clean reads were obtained by filtering out low quality reads <20 or short reads <30 base pairs (bp) with the SolexaQA package.27 SOAPaligner (version v2.21, -M 4 -l 30 -v 10) was applied to get high-quality clean reads for analysis, which were aligned to the human genome (H. sapiens, UCSC hg19) without contaminated host reads.28
De novo assembly
The clean data were assembled by the SOAPdenovo software (version v2.04, an iterative De-Bruijn Graph De Novo Assembler), with parameters as follows: -D 1, -M 3, -L500, for constituting scaftigs of at least 500 bp.
Nonredundant metagenomic gene catalog construction
Genetic structure predictions were carried out with MetaGeneMark.29 A nonredundant gene catalog of prediction genes was constructed with CD-HIT.30 High quality reads were mapped onto the gene catalog using the Burrows-Wheeler Alignment tool for calculation of gene abundance.
Statistical analysis
MetaPhlAn2 was used to determine the microbial components, including the relative abundance of each level, that is kingdom, phylum, class, order, family, genus, and species.31 Statistical analyses, such as the composition, diversity, difference, function, and metabolic pathway analyses, were performed using R (version 3.4.3) statistical programming language. Spearman correlation analyses between microbiome and clinical phenotypes were performed with R. Variation analysis between different chemotherapy efficacy groups was identified using Wilcoxon rank-sum permutation test and P-values with adjustments according to Benjamini-Hochberg. Nonlinear unsupervised clustering analysis was used for further verification. Heatmap showing the unsupervised clustering of the microbiota relative abundance data was performed by ComplexHeatmap in R, in which the cluster_rows and cluster_columns were clustered by Euclidean.32 After classifying into clusters, we determined the microbiome biomarkers at the species level that showed chemotherapy combined with clinical outcomes. Subsequently, we validated the efficacy of the biomarkers in non-small cell lung cancer (NSCLC) and small cell lung cancer (SCLC) subgroups using the chi-squared test. Finally, we performed gene set enrichment analysis (GSEA) using R, and the genes annotated by the HUMAnN2 gene database were ranked. The gene sets were defined according to the HUMAnN2 pathway for functional analysis of the metabolic pathways. The metabolite potential was estimated using the relative abundance of its corresponding species, by simply adding or subtracting if the species produced or consumed the metabolite. Comparisons between different efficacy groups were conducted by R.
Results
Patient characteristics
A total of 64 patients with locally advanced and advanced lung cancer undergoing definitive chemotherapy were enrolled in the study, provided pretreatment fecal samples, and had follow-up examinations and scans. Clinical characteristics, including age, gender, smoking and drinking history, pathological tumor type, clinical stage, and chemotherapy regimen, efficacy, and adverse events, were recorded (Table 1). A total of 33 patients showed RECIST response to chemotherapy (R) and 31 did not (NR). The median progression-free survival was seven months (range, 1.5–14.5).
| Characteristics | No. of patients (N = 64) | % |
|---|---|---|
| Median age at diagnosis (range), year | 60 (33–78) | |
| Median BMI (range), kg/m2 | 24.5 (18.7–33.2) | |
| Gender | 64 | |
| Male | 48 | 75% |
| Female | 16 | 25% |
| Smoking history | 40 | 62.5% |
| Drinking history | 27 | 42.19% |
| Pathology | 64 | |
| Adenocarcinoma | 34 | 53.125% |
| Squamous carcinoma | 10 | 15.625% |
| Adenosquamous carcinoma | 2 | 3.125% |
| Small cell carcinoma | 18 | 28.125% |
| Clinical stage | 64 | |
| III | 19 | 29.69% |
| IV | 45 | 70.31% |
| Metastasis location | 45 | |
| Bone | 14 | 31.11% |
| Brain | 8 | 17.78% |
| Pulmonary | 19 | 42.22% |
| Pleura | 16 | 35.56% |
| Liver | 4 | 8.89% |
| Chemotherapy (first-line) | 64 | |
| Pemetrexed + platinum ± bevacizumab | 34 | 53.125% |
| Paclitaxel/gemcitabine + platinum | 12 | 18.75% |
| Etoposide + platinum | 18 | 28.125% |
| Effect | 64 | |
| R | 33 | 51.56% |
| NR | 31 | 48.44% |
| Median PFS (range), m | 7 (1.5–14.5) | |
| Myelosuppression | 64 | |
| 0 | 4 | 6.25% |
| I | 21 | 32.81% |
| II | 18 | 28.125% |
| III | 14 | 21.875% |
| IV | 7 | 10.94% |
| Gastrointestinal reaction | 64 | |
| 0 | 6 | 9.375% |
| I | 40 | 62.5% |
| II | 14 | 21.875% |
| III | 4 | 6.25% |
| IV | 0 | 0 |
- NR, nonresponders to chemotherapy; R, responders to chemotherapy.
No apparent discrepancy in fecal bacterium diversity
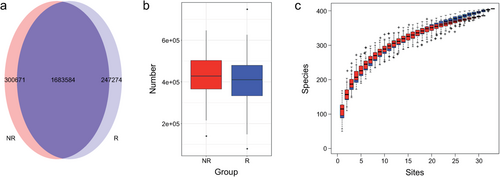
We constructed a nonredundant gene set, and the number of genes in R and NR groups were 1 930 858 and 1 984 255, respectively, of which 1 683 584 were part of the universal gene set (Fig 1a,b). Species richness indicated that the reads obtained from both groups represented most of the microbiome present in the samples (Fig 1c). Alpha diversity was determined by Shannon index to analyze the complexity of species diversity in each sample, and no differences were found (Fig 2a). Additionally, there was no significant difference in beta diversity, as constructed by the principal co-ordinates analysis (PCoA) based on the Bray-curtis distance of the top several flora species (Fig 2b), indicating that the primary differences may lie in the less abundant microbiota. The TOP20 microbiome species correlated with the difference between the groups are shown in Table 2 (more detail in Supplementary Material S1), which were obtained using the similarities percentage method (SIMPER).
 , NR;
, NR;  , R. (c) Species accumulation curve, with a tendency to gradually flatten out, was projected using vegan in R programming language
  , R;
, R;  , NR.
, NR.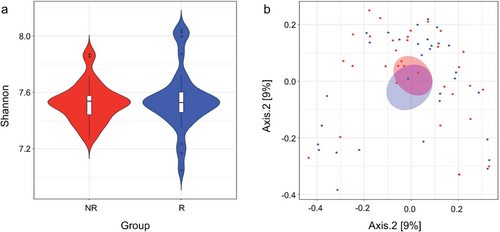
 , NR;
, NR;  , R. (b) Principal coordinates analysis (PCoA) revealing the beta diversity for responders and nonresponders were exhibited with Bray–Curtis distance
  , NR;
, NR;  , R. The first two principal coordinates (PCs) were labeled with the percentage of variance explained (12.7% and 9%).
| Species | Average | Sd | Ratio | NR (av) | R (av) | Cumsum |
|---|---|---|---|---|---|---|
| Prevotella copri | 0.058 | 0.088 | 0.663 | 9.735 | 3.708 | 0.072 |
| Eubacterium rectale | 0.049 | 0.059 | 0.821 | 6.040 | 7.006 | 0.132 |
| Bacteroides stercoris | 0.024 | 0.037 | 0.644 | 2.440 | 3.553 | 0.161 |
| Biftdobacterium longum | 0.022 | 0.031 | 0.695 | 3.922 | 1.521 | 0.188 |
| Faecalibacterium prausnitzii | 0.021 | 0.019 | 1.132 | 4.148 | 4.252 | 0.215 |
| Bacteroides uniformis | 0.021 | 0.040 | 0.522 | 1.725 | 3.823 | 0.241 |
| Bacteroides coprocola | 0.021 | 0.035 | 0.604 | 2.190 | 2.695 | 0.266 |
| Alistipes putredinis | 0.020 | 0.018 | 1.129 | 2.841 | 3.329 | 0.291 |
| Ruminococcus bromii | 0.019 | 0.026 | 0.742 | 2.883 | 2.043 | 0.315 |
| Escherichia coli | 0.016 | 0.020 | 0.778 | 2.358 | 1.763 | 0.335 |
| Bacteroides plebeius | 0.015 | 0.025 | 0.599 | 1.429 | 2.122 | 0.354 |
| Ruminococcus gnavus | 0.015 | 0.026 | 0.570 | 2.215 | 1.340 | 0.372 |
| N/A | 0.014 | 0.015 | 0.943 | 2.581 | 1.707 | 0.388 |
| Pseudomonas aeruginosa | 0.014 | 0.054 | 0.254 | 0.006 | 2.725 | 0.405 |
| Bacteroides thetaiotaomicron | 0.013 | 0.027 | 0.503 | 1.762 | 1.632 | 0.422 |
| Bacteroides vulgatus | 0.013 | 0.017 | 0.772 | 1.773 | 2.208 | 0.438 |
| Biftdobacterium adolescentis | 0.013 | 0.031 | 0.407 | 1.731 | 0.986 | 0.454 |
| Ruminococcus torques | 0.012 | 0.016 | 0.789 | 2.232 | 1.412 | 0.469 |
| Roseburia intestinalis | 0.012 | 0.024 | 0.517 | 1.558 | 1.222 | 0.484 |
| Bacteroides fragilis | 0.012 | 0.020 | 0.617 | 2.002 | 0.960 | 0.499 |
- Average, species contribution to average between-group dissimilarity; Cumsum, ordered cumulative contribution, based on item average and sum up to a total of 1; N/A, not applicable; NR (av), average abundances in nonresponders; Ratio, average to standard deviation ratio; R (av), average abundances in responders; Sd, standard deviation.
Correlation between gut microbiome and clinical phenotypes
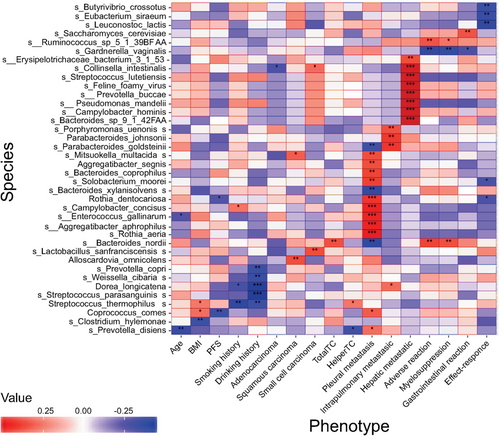
Spearman correlation analyses between microbiome and clinical phenotypes showed that different kinds of clinical manifestations were associated with specific flora. Spearman rank correlation coefficients are represented by a heatmap (Fig 3). Age was inversely related to Prevotella disiens (P < 0.01) and Enterococcus gallinarum (P < 0.05); BMI was inversely related to Clostridium hylemonae (P < 0.01) and had positive correlation with Streptococcus thermophilus and Coprococcus comes (P < 0.05). Patients who reported long-term smoking, were associated with higher abundance of Campylobacter concisus (P < 0.05) and lower abundance of Streptococcus thermophilus (P < 0.01) and Dorea longicatena (P < 0.05). Five species, such as Dorea longicatena and Streptococcus parasanguinis (P < 0.001), were reduced in patients with a long history of drinking. Collinsella intestinalis was inversely related to lung adenocarcinoma (P < 0.05), while it presented at a higher abundance in patients with small cell lung cancer (P < 0.05). Mitsuokella multacida (P < 0.05) and Alloscardovia omnicolens (P < 0.01) were enriched in patients with squamous cell lung carcinoma. Baseline metastatic sites had obvious correlation with different flora. A total of 11 species, including Rothia dentocariosa (P < 0.001) and Solobacterium moorei (P < 0.01), were more abundant in lung cancer patients with pleural metastasis at baseline. Porphyromonas uenonis (P < 0.01) and three other flora were enriched in patients with pulmonary metastasis, while patients with hepatic metastases had higher abundance of Pseudomonas mandelii (P < 0.001), Campylobacter hominis (P < 0.001), and six other species. Moreover, both clinical efficacy and adverse events after chemotherapy were associated with certain bacteria. The enrichment of Bacteroides nordii and Ruminococcus sp_5_1_39BFAA were associated with severe adverse events after chemotherapy (P < 0.01). However, Gardnerella vaginalis was inversely related to adverse events (P < 0.01). For treatment, Eubacterium siraeum (P < 0.01), Leuconostoc lactis (P < 0.01), Rothia dentocariosa (P < 0.05), and two other flora had negative correlations with efficacy. In addition, Rothia dentocariosa showed significant correlations with poorer efficacy and shorter PFS (P < 0.05).
Differences in bacterial communities among between different efficacy groups
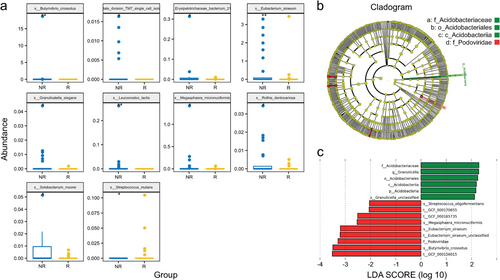
The differences in the relative abundance of flora are shown in Table 3 (more detail in Supplementary Material S2). The relative abundances of 13 species were significantly different. Streptococcus mutans (P = 0.026) and Enterococcus casseliflavus (P = 0.049) were enriched in the R group, while 11 bacteria, including Leuconostoc lactis (P = 0.002) and Eubacterium siraeum (P = 0.006), were enriched in the NR group. Significantly different predominant taxa (TOP10) are shown in a box comparison plot (Fig 4a). The metagenomic biomarker discovery approach was used to identify the phylotypes responsible for the greatest differences in gut bacteria at the operational taxonomic unit level by Lefse analysis, showing that the responders to chemotherapy were associated with significantly higher levels of Acidobacteria and Granulicella. Streptococcus oligofermentans, Megasphaera micronuciformis, and Eubacterium siraeum were more abundant in nonresponders (Fig 4b,c).
| Species | NR (av) | R (av) | W | P-value | P.adj |
|---|---|---|---|---|---|
| Leuconostoc lactis | 0.012 | 0 | 643.500 | 0.002 | 0.715 |
| Eubacterium siraeum | 0.454 | 0.115 | 693.500 | 0.006 | 0.715 |
| Butyrivibriocrossotus | 0.603 | 0 | 610.500 | 0.009 | 0.715 |
| Candidate division_TM7_single_cell_isolate_TM7b | 0.002 | 0 | 594 | 0.018 | 0.715 |
| Megasphaera micronuciformis | 0.064 | 0.004 | 632 | 0.022 | 0.715 |
| Solobacterium moorei | 0.006 | 0.001 | 648 | 0.026 | 0.715 |
| Streptococcus mutans | 0 | 0.006 | 434 | 0.026 | 0.715 |
| Rothia dentocariosa | 0.004 | 0.0003 | 621 | 0.032 | 0.715 |
| Erysipelotrichaceae bacterium | 0.013 | 0.001 | 633 | 0.033 | 0.715 |
| Granulicatella elegans | 0.003 | 0.0001 | 598 | 0.033 | 0.715 |
| Turicibacter sanguinis | 0.005 | 0 | 577.500 | 0.036 | 0.715 |
| Streptococcus oligofermentans | 0.001 | 0 | 577.500 | 0.036 | 0.715 |
| Enterococcus casseliflavus | 0 | 0.003 | 449.500 | 0.049 | 0.715 |
| Roseburia inulinivorans | 0.347 | 1.727 | 366 | 0.051 | 0.715 |
| Citrobacter koseri | 0.0001 | 0.002 | 434 | 0.056 | 0.715 |
| Lactobacillus johnsonii | 0.003 | 0.001 | 604 | 0.060 | 0.715 |
| Clostridium hylemonae | 0.009 | 0 | 561 | 0.072 | 0.715 |
| Bacteroides intestinalis | 0.138 | 0.140 | 637 | 0.078 | 0.715 |
| Streptococcus cristatus | 0.004 | 0.001 | 609 | 0.079 | 0.715 |
| Biftdobacterium longum | 3.922 | 1.521 | 642.500 | 0.080 | 0.715 |
- NR (av), average abundances in nonresponders; P.adj, P-values adjusted using the Benjamini-Hochberg method; R (av), average abundances in responders; W, Wilcoxon test statistic.
 , NR;
, NR;  , R. (b, c) Differential taxonomic abundance between responders and nonresponders were analyzed by linear discriminate analysis coupled with effect size measurements (Lefse) as a histogram (c) and a cladogram (b)
  , NR;
, NR;  , R;
, R;  , NR;
, NR;  , R. The listed bacterial floras were significantly (P < 0.05, Kruskal-Wallis test) gathered for their respective groups.
Identification of significant taxa clusters at the species level as bacterial markers relevant to chemotherapy outcomes using unsupervised clustering
The discrepancies at the species level were comprehensively assessed by the deconvolution of the metagenome data. Unsupervised clustering classified the species into five clusters (Supplementary Material S3 and S4), and a heatmap displays species differences between individuals (Fig 5). Comparing the clustering data with the treatment efficacy for each patient allowed for the identification of significant taxa clusters at the species level as bacterial markers relevant to chemotherapy outcomes. Streptococcus mutans and Enterococcus casseliflavus were significantly enriched in the R group, consistent with the result of variance analysis, and can be used as biological biomarkers for chemotherapy responses. On the other hand, Leuconostoc lactis and Eubacterium siraeum were markers for the NR group, whose P-values also consistently showed statistical significance.
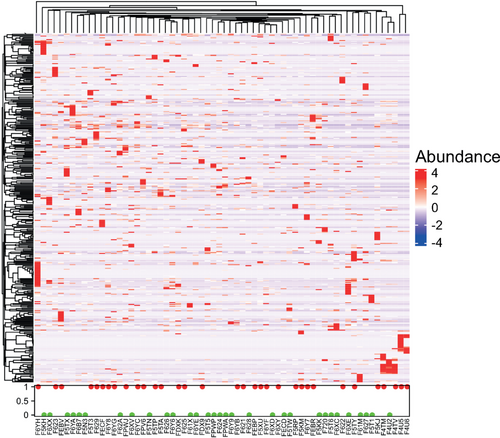
 , 1(red): R;
  , 0(green): NR.
Validation of the efficacy of the selected biological biomarkers in NSCLC and SCLC subgroups
In the 46 cases of NSCLC, comparing the objective response rate (ORR) of 23 patients with higher abundance of Leuconostoc lactis and Eubacterium siraeum with the other 23 patients with lower abundance, we found that the ORR of patients with lower abundance of Leuconostoc lactis was 69.57% (16/23), while the ORR of patients in the higher abundance group was 17.39% (4/19) (χ2 = 12.738; P < 0.001); and the ORR of patients with lower and higher abundance of Eubacterium siraeum was 65.22% (15/23) and 21.74% (5/23), respectively (χ2 = 8.846; P = 0.003). No statistical test analysis was performed because only two NSCLC patients had an enrichment in Enterococcus casseliflavus. However, these two patients were both responders, which also supports that the bacteria may be related to chemotherapy responses. Similarly, all three NSCLC patients with an enrichment in Streptococcus mutans were responders, which revealed the same trend in the whole population.
In the subgroup of the 18 SCLC patients, no patients had an enrichment in Leuconostoc lactis, suggesting that this bacterium may not have a significant role in the chemotherapy of SCLC. The ORR of SCLC patients with lower abundance of Eubacterium siraeum was 88.89% (8/9), while the ORR of patients in the higher abundance group was 55.56% (5/9). In addition, 2 SCLC patients with an enrichment in Enterococcus casseliflavus and the other 2 SCLC patients with an enrichment in Streptococcus mutans were all responders.
Differences in metabolic pathway analysis for functional analysis
Results from the metabolic pathway enrichment analysis are shown in Supplementary Material S5. Three metabolic pathways were enriched in the NR group, including “C4 photosynthetic carbon assimilation cycle” (P < 0.001), “Reductive TCA cycle I" (P = 0.007), and “Hexitol fermentation to lactate, formate, ethanol, and acetate” (P = 0.025). The metabolic pathway “L-glutamate degradation VIII (to propanoate)” was abundant in the R group (P = 0.014). We calculated the metabolite potential based on the relative abundance of the metabolic microflora producing or digesting metabolites and conducted a variation analysis. The heatmap of significantly different metabolites is shown in Fig 6, and the aliphatic acid or carbohydrate pathways may be used to distinguish between the two groups.
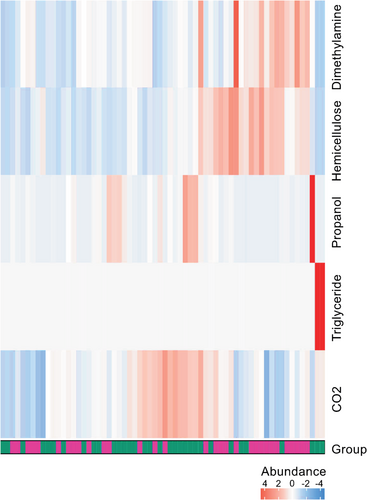
 , NR;
, NR;  , R.
, R.Discussion
The gut microbiome may be a modifiable factor that affects cancer treatment efficacy and toxicity.33 We characterized the composition and differences in the gut bacteria associated with different chemotherapeutic outcomes from 64 lung cancer patients. This is the first detailed report of human gut microbiome metagenomic profiling in lung cancer patients treated with first-line chemotherapy. We demonstrated the correlation of gut microbiota with clinical phenotypes and identified specific candidates that might contribute to predicting chemotherapy outcomes. These findings provided a broader understanding of the effect of the gut microbiome on chemotherapy efficacy in lung cancer patients, paving the way for further investigation.
The abundance of Prevotella disiens and Enterococcus gallinarum declined with age. The translocation of gut microflora, such as Enterococcus gallinarum, to systemic tissues triggers intense autoimmune responses.34 However, the correlation between the abundance of these species and age was first proposed here and deserves further investigation. Smoking is a recognized risk factor for lung cancer, whose pathogenic mechanism has previously been extensively studied.35 The abundance of Streptococcus thermophilus was obviously reduced in patients with a history of long-term smoking. Streptococcus thermophilus possess in vitro probiotic properties along with anticancer activity.36 Therefore, it is worth investigating whether smoking causes an imbalance of the intestinal flora, thereby affecting the health of whole body. Different pathological types of cancer appear to have their own unique gut microbial characteristics.37 Here, lung cancer patients with different types of pathology also showed distinct microbial signatures. For example, Collinsella intestinalis was reduced in lung adenocarcinoma, while enriched in small cell lung cancer, and Mitsuokella multacida and Alloscardovia omnicolens were enriched in squamous cell lung carcinoma. The flora differences between pathological types are worthy of further exploration, in order to provide another possible diagnostic approach for patients who do not have adequate conditions for puncture biopsy. Several microbes such as Blautia obeum and Akkermansia muciniphila are increased only in metastatic lung cancer patients.37 Our study further reveals the differences in the flora associated with different metastatic sites (Fig 3), which may lay the foundation for the individual management of patients.
The treatment outcomes, including for chemotherapy or a combination of chemotherapy with immunotherapy, in cancer patients are positively correlated with some specific types of gut microbiota, such as Bacteroides ovatus and Bacteroides xylanisolvens.38 However, the correlation between chemotherapy outcomes in lung cancer patients and specific flora is still unclear. Here, we proposed microbial biomarkers that correlated with chemotherapy outcomes in patients with locally advanced and advanced lung cancer for the first time. We showed that Streptococcus mutans and Enterococcus casseliflavus were linked to better chemotherapy outcomes. Streptococcus mutans is an organism from carious lesions, whose natural habitat is the oral cavity, with possible translocation to other tissues.39 The production of glycan, a hydrolytic proteoglycan, by this microbe gives it the ability to adhere to epithelial cells, which can affect the cell-cell adhesions of the host, by influencing the level of functional E-cadherin at the cell-cell border, and enhance the process of tumor cell dissociation and invasion.40 Interestingly, in our study, Streptococcus mutans was enriched at baseline in patients with better outcomes, indicating that it may contribute to chemotherapy efficacy in lung cancer. Gut Enterococcus is significantly higher in cancer patients, especially those with colorectal cancer, than in healthy people, demonstrating the relevance of this flora to cancer.41 Moreover, Enterococcus is more abundant in metastatic melanoma patients that responded to immunotherapy, which may lead to improved tumor control and greater efficacy of immunotherapy by augmented T cell responses.42 Here, Enterococcus casseliflavus was related to better chemotherapy efficacy in lung cancer. Therefore, the enrichment of Streptococcus mutans and Enterococcus casseliflavus seemed to be linked to better chemotherapy responses. Conversely, Leuconostoc lactis and Eubacterium siraeum were associated with poor chemotherapy outcomes. Leuconostoc bacteria were initially considered for a wide range of uses in the food industry due to their fermentation properties and odor-producing compounds.43 Leuconostoc mesenteroides isolated from traditional dairy products promoted apoptosis in colon cancer by regulation of MAPK1, AKT, NF-kB, and some key oncomicroRNAs.44 Interestingly, we found another species, Leuconostoc lactis, that had a negative effect on lung cancer chemotherapy, which contradicts the probiotic characteristics of this genus and is worth being explored in depth. Eubacterium rectalie seemed to be more abundant in healthy persons than in patients with prostate cancer.45 Eubacterium siraeum was negatively corelated with chemotherapy outcomes for lung cancer patients in our study, which poses a new challenge for the role of this flora in anti-tumor therapy. Overall, we proposed that enrichment of Leuconostoc lactis and Eubacterium siraeum was linked to poorer chemotherapy outcomes in lung cancer. And the correlations between clinical outcomes and Leuconostoc lactis and Eubacterium siraeum in NSCLC subgroup were verified to show the significative performance, while the role of intestinal flora in SCLC needs to be further confirmed in larger samples. Finally, the detailed molecular mechanism for enhancement of chemotherapy efficacy by any of the bacteria discussed in this study remains unknown, which needs exploring with in-depth experiments in a mouse model.
Taking the challenges of the lability of mRNA and difficulty in standardized sample collection for metatranscriptomics into consideration, we have attempted a metagenomic functional pathway analysis to gain functional insight into changes in the gut microbiome. Anacardic acid had an antitumor effect, mediated by enhanced T cell recruitment, in several preclinical models.46 In our study, the metabolic pathway of L-glutamate degradation VIII to propanoate was enriched in the R group. Similarly, propanol, which can be broken down into propionic acid, was also abundant in the R group. Whether propanol, propionic acid, or other related metabolic pathways are factors that affect chemotherapy outcomes, deserves in-depth exploration. Preliminarily, based on the analysis of metabolic pathways and metabolites in our study, hexitol fermentation and the aliphatic acid or carbohydrate pathways may be targets for combined metabolic intervention. However, the enriched or reduced abundance of genes in a certain microbiome is difficult to explain, which needs further research.
Our study had some limitations. First, the sample size was relatively small. Therefore, we could not comprehensively and systematically profile the microbial biomarkers for chemotherapy outcomes in lung cancer patients. It is necessary to carry out further validation in larger samples and to construct a predictive model. Second, although we have verified the effectiveness of the selected microbial markers in the NSCLC and SCLC groups, further accurate subgroup analysis is needed. Third, we did not monitor the dynamic bacterial community structure of patients during chemotherapy, which might lead to a better understanding of the alterations in gut bacteria associated with chemotherapy. Therefore, further research on this subject is required, and studies with a longitudinal design using the lung cancer animal model treated with chemotherapy drugs to investigate the underlying mechanisms of the relationship between gut bacteria and chemotherapy efficacy in lung cancer are preferable.
In conclusion, we present a description of the gut microbiota in patients with different chemotherapy outcomes, providing a significant first step in understanding the relationship between the gut microbiome and chemotherapy efficacy in lung cancer. Our work extends this observation to monitoring the therapeutic responses in lung cancer patients treated with chemotherapy, and may facilitate clinical therapeutic strategies from a microbial perspective.
Acknowledgments
This work was supported by National key research and development project 2019YFC1315700; the National Natural Sciences Foundation Key Program [81630071]; CAMS Innovation Fund for Medical Sciences (CIFMS 2016-I2M-3-008); Aiyou foundation (KY201701); Ministry of Education Innovation Team development project (IRT-17R10); CAMS Key laboratory of translational research on lung cancer (2018PT31035). QuantiHealth provided the sequencing service for this research.
Disclosure
The authors declare that they have no competing interests.


