Haploid gynogens facilitate disomic marker development in paleotetraploid sturgeons
Abstract
Acipenseriformes (sturgeons and paddlefishes) are of substantial conservation concern, and development of genomic resources for these species is difficult due to past whole genome duplication. Development of disomic markers for polyploid organisms can be challenging due to difficulty in resolving alleles at a single locus from those among duplicated loci. In this study, we detail the development of disomic markers for the endangered pallid sturgeon (Scaphirhynchus albus) found in North America. One of the strategies for pallid sturgeon conservation is to stock U.S. rivers with offspring of pure pallid sturgeon, but introgression with the sympatric shovelnose sturgeon (S. platorynchus) threatens pallid sturgeon genetic integrity. Currently, 19 microsatellite loci are used to differentiate between both species and their hybrids, but the markers are insufficient to robustly identify backcrosses. We performed double digest restriction site-associated DNA sequencing (ddRADseq) on shovelnose sturgeon haploid gynogens to produce a reduced-representation genomic reference. Contiguous sequences that were heterozygous within a haploid individual were flagged as potentially encompassing multiple loci. Approximately 60 individuals of each species from two management units were sequenced, and reads were mapped to the haploid reference to identify single nucleotide polymorphisms (SNPs) at individual loci. The final data set contained 11,082 microhaplotyped loci which offer at least an order of magnitude greater resolution for species discrimination than the current panel of 19 microsatellites. These markers will be used to examine a larger sample of Scaphirhynchus individuals throughout their ranges to determine the extent and trajectory of hybridization.
1 INTRODUCTION
Identifying disomic single nucleotide polymorphisms (SNPs) in evolutionarily polyploid organisms (e.g., sturgeons (Birstein et al., 1997), salmonids (Allendorf & Thorgaard, 1984), catostomids (Uyeno & Smith, 1972), some amphibians (Bogart & Licht, 1986)) remains challenging due to the presence of paralogous sequence variants (PSVs) between duplicated loci. Closely related PSVs with little sequence divergence may be mistaken for allelic variants at a single locus and incorrectly aligned into the same contiguous sequence (Anderson et al., 2017). Some analytical tools may accommodate multiple or ambiguous ploidies, but these tools may be unreliable when analysing nondiploid genomes due to uncertainties regarding allele dosage (i.e., copy number) and/or retaining diploid assumptions (Dufresne et al., 2014). For example, Genome Analysis Tool Kit (McKenna et al., 2010) assumes allelic variants have a frequency of 0.5 in heterozygotes, and SuperMASSA (Serang et al., 2012) assumes that allele dosage is correlated with probe hybridization. While genetic analyses using markers with tetraploid ancestry in polyploid organisms can be performed successfully (e.g., in sturgeons: Israel et al., 2009; Schreier et al., 2016; Thorstensen et al., 2019), disomic markers, when available, are preferred because many available analyses cannot be performed on tetrasomic data even when dosage can be determined (Welsh & May, 2006).
All extant members of the order Acipenseriformes (sturgeons and paddlefishes) are ancient polyploids, with each lineage experiencing at least one specific whole genome duplication event (Birstein et al., 1997). Extant species fall into three groups believed to have derived from a diploid ancestor (2n = 60): (A) ~120-chromosome spp. (evolutionary tetraploids), (B) ~250-chromosome spp. (evolutionary octoploids), and (C) ~360–370-chromosome spp. (evolutionary dodecaploids) (Vasil'ev, 2009). Each group is believed to have experienced at least partial diploidization. Group A has been referred to as functional diploids, group B as functional tetraploids, and group C as functional hexaploids (Vasil'ev, 2009).
Sturgeon with ~120 chromosomes are assumed to be largely diploidized based on the arrangement of nuclear organizer regions (Fontana, 1994) and disomic allelic banding patterns at microsatellite loci (Ludwig et al., 2001), but they retain evidence of their paleoploid ancestry as duplicated loci continue to be detected in 120-chromosome species (Kim et al., 2000; Rajkov et al., 2014). For example, in pallid sturgeon (Scaphirhynchus albus), paralogous genes with more than 97% identical sequence have been observed (Eichelberger et al., 2014), and many microsatellite loci for pallid sturgeon (McQuown et al., 2000) have tetrasomic allelic banding patterns (Edward Heist, Southern Illinois University Carbondale, unpublished data, 2000). The sterlet (Acipenser ruthenus), the acipensiform species with the most genomic resources to date (e.g., whole genome sequencing projects in Cheng et al. (2019) and Du et al. (2020)), is a 120-chromosome species with evidence of ploidy status between a diploid and tetraploid (Romanenko et al., 2015). If other 120-chromosome species are similar, the assumption of diploid genome content for 120-chromosome species could be problematic.
The federally endangered pallid sturgeon and more common shovelnose sturgeon (S. platorynchus) are species with approximately 120 chromosomes. Both species are native to the Mississippi River Basin in the United States of America (Bailey & Cross, 1954; Jordan et al., 2016; Keenlyne, 1997; Phelps et al., 2016). The larger, later maturing, piscivorous pallid sturgeon is restricted to the Missouri and Mississippi Rivers and lower portions of larger tributaries, while the smaller shovelnose sturgeon is also found in smaller rivers throughout the Mississippi River Basin. The pallid sturgeon is currently managed in four geographic management units (MUs; (United States Fish and Wildlife Service, 2014): (1) The Great Plains Management Unit (GPMU), (2) the Central Lowlands MU (CLMU), (3) the Interior Highlands MU (IHMU), and (4) the Coastal Plains MU (CPMU; Figure 1). Portions of the GPMU currently inhabited by pallid sturgeon are fragmented and physically isolated from the other MUs by multiple dams and reservoirs that were constructed in the mid-20th century (Jordan et al., 2016). While reproduction occurs, there is no evidence of survival to juvenile stages in the GPMU. It is believed that recruitment of pallid sturgeon has not happened since the completion of the mainstem dams (Holmquist et al., 2019), and the few remaining wild pallid sturgeon in this management unit are decades old (Braaten et al., 2015). There continues to be limited natural recruitment of pallid sturgeon in the CLMU (Steffensen et al., 2019), and while there is high natural recruitment of Scaphirhynchus in the IHMU and CPMU, hybrid and backcross sturgeon outnumber pure pallid sturgeon, particularly in the CPMU (Jordan et al., 2019).
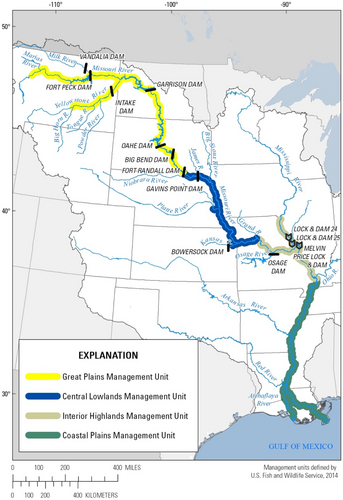
Hybridization with the shovelnose sturgeon was identified as a threat to the persistence of pallid sturgeon and was, in part, responsible for the listing of the species as endangered (Endangered and Threatened Wildlife and Plants; Determination of Endagered Status for the Pallid Sturgeon - Final Rule, 1990). Crosses between the species are fertile, and multiple generations of backcrosses exist throughout the sympatric range of the species (Jordan et al., 2019; Schrey et al., 2011). Hybridization is rare in the GPMU, uncommon in the CLMU, but pervasive in the IHMU and CPMU (Jordan et al., 2019; Schrey et al., 2011). The extent to which hybridization is natural and has occurred for generations versus a more recent and anthropogenically induced phenomena (e.g., related to channelization and fragmentation by dams altering distribution, migration, and spawning of the species) is unclear (Carlson et al., 1985; Schrey et al., 2011).
Conservation propagation programmes that collect wild adult pallid sturgeon for captive spawning and to release offspring into the wild have been implemented since 1992 (United States Fish and Wildlife Service, 2014). Inadvertent use of hybrid or backcross sturgeon as broodstock in conservation propagation programmes could accelerate the spread of hybridization and threaten the persistence of pallid sturgeon. Currently, 19 microsatellite loci are used to identify genetically pure pallid sturgeon in the conservation propagation programme; however, these markers are insufficient to distinguish reliably between pure pallid sturgeon and backcross sturgeon. A larger panel of markers is needed to provide greater resolution (Jordan et al., 2019).
Prior to 2008, offspring of wild GPMU-origin parents were stocked into both the GPMU and CLMU. Since 2008, stocking has been limited to offspring of wild parents collected from the same MU, except for a portion of the CLMU above Gavins Point Dam (the lowermost dam in the Missouri River system) where GPMU-origin fish are stocked into an “experimental” population (United States Fish and Wildlife Service, 2008). There is some emigration of GPMU-origin pallid sturgeon from the experimental population through Gavins Point Dam into the unimpounded CLMU (Pierce et al., 2019). Pallid sturgeon exhibit microsatellite allele frequency differences among MUs (Schrey & Heist, 2007), and progeny of GPMU breeders stocked in the CLMU have shorter lifespans and lower lifetime fecundities than those stocked in the GPMU (Hamel et al., 2020). Thus, understanding the genetic distinctiveness between the MUs is important for evaluating current management practices.
In a previous study, we produced pallid sturgeon gynogenetic haploids that contain half of the genome content of their maternal parents (Flamio et al., 2021); gynogenetic haploids received no genetic material from a paternal parent, but ultraviolet (UV) irradiated sperm from paddlefish (Polyodon spathula) was used to activate the eggs and initiate mitotic division. Theoretically, sequencing the genome of haploid individuals will facilitate SNP discovery because haploid individuals should have only one allele at each locus (Kaur et al., 2012), enabling loci that are heterozygous within an individual to be flagged as PSVs. Incorrectly aligned sequences or multi-locus contigs can then be removed or further resolved via adjustment of stringency filters.
In this study, we produced and sequenced Scaphyrhynchus haploid gynogens to build a reduced-representation reference sequence and identify PSVs. For this study, we opted to produce shovelnose sturgeon haploid gynogens, instead of pallid sturgeon haploid gynogens, because shovelnose sturgeon have higher observed levels of genetic variation (Schrey et al., 2007) and additional variation between PSVs may increase their detectability after sequencing. Inferences based on shovelnose sturgeon can be applied to pallid sturgeon because the abundance of fertile individuals with mixed ancestry (Jordan et al., 2019; Schrey & Heist, 2007) and comparable amplification of microsatellite loci in both species (Jordan et al., 2016; Ludwig et al., 2001) indicate that the two species have similar genomic architectures. Sequencing of haploid gynogens was followed by sequencing of adult pallid and shovelnose sturgeons from the upper two MUs (see Methods for more details) to identify discriminatory SNP markers.
Overall, the use of haploid gynogens was fundamental for achieving the three objectives of this study: (1) To identify diploid loci in Scaphirhynchus sturgeons, given the paleopolypoid nature of sturgeon genomes; (2) to identify which of these diploid loci best distinguish between the species; and (3) to determine if the diploid loci identified in this study resolved genetic structure at the level of the management unit. While species discrimination was the major impetus for the study, markers developed could also be used to identify genetic structure among wild-spawned pallid and shovelnose sturgeon from different management units, for estimates of effective population size in both species, and for parentage analysis.
2 MATERIALS AND METHODS
2.1 Production and verification of gynogenetic haploids for genomic sequencing
Gynogenetic haploid shovelnose sturgeon were produced at U.S. Geological Survey, Columbia Environmental Research Centre (CERC), in Columbia, Missouri, USA largely based on the procedures described in Flamio et al. (2021). Shovelnose sturgeon broodstock and hatched free embryos used in this study were treated according to animal care and use guidelines established by CERC (Animal Welfare Plan, policy number 1401). Experiments at CERC were conducted using nonchlorinated well water (dissolved oxygen 8.1–8.6 mg/L; 305 mg/L hardness as CaCO3, 260–265 mg/L alkalinity as CaCO3, 670–690 μS/cm conductivity, 7.8–8.0 pH).
Male (n = 1) and female (n = 3) shovelnose sturgeon broodstock were obtained from the CLMU in the Lower Missouri River in Missouri. The male shovelnose sturgeon was induced to spermiate by administration of one intramuscular (IM) injection of luteinizing hormone-releasing hormone analogue (LHRHa; Syndel Laboratories, Vancouver, British Columbia) at a dosage of 50 μg/kg of bodyweight, approximately 24 h before expected milt collection. Female sturgeon were induced to ovulate by administration of an IM priming dose of LHRHa at 50 μg/kg of bodyweight and a resolving dose of white sturgeon (Acipenser transmontanus) pituitary extract: (Argent Aquaculture LLC) at 2 mg/kg bodyweight, administered 12 h later. At the time of ovulation, shovelnose sturgeon were euthanized with a combination of Tricaine – S (MS-222; Syndel Laboratories) and a blow to the head. Eggs were removed from the body cavity through whole excision of the ovaries via an incision in the abdominal wall.
Eight male paddlefish were obtained from the lower White River (a tributary of Lake Francis Case) in South Dakota, USA. Male paddlefish were induced to spermiate at the USFWS Gavins Point National Fish Hatchery with a dosage of 10 μg/kg of bodyweight of LHRHa. Milt was maintained in separate and labelled oxygenated containers, refrigerated, and transferred to CERC.
On the day of spawning, milt samples from males of both species were examined and genetically inactivated by ultraviolet irradiation following Flamio et al. (2021). Aliquots of UV-irradiated paddlefish milt were combined and placed on wet ice in a dark cooler until shovelnose sturgeon eggs were ready to be activated. At the time of fertilization (for eggs in the control) or activation (for eggs in the treatment; there was no transfer of gametic DNA from sperm to egg, but activation initiated mitotic divisions), milt was mixed with water at a ratio of 1:100, quickly added to the eggs, and gently stirred for 3 min. Approximately 20 grams (g) of eggs from each female shovelnose sturgeon were fertilized with nonirradiated milt from one male shovelnose sturgeon to confirm egg viability as controls. The remaining eggs from each female shovelnose sturgeon, ranging from 95.1 to 267.1 g, were activated with UV-irradiated paddlefish milt. Once fertilized or activated, the eggs were combined with Fuller's earth (Sigma-Aldrich) and mixed for approximately 20 min to remove adhesiveness. Fertilized and activated eggs from each female and treatment group were maintained separately in a partially recirculating (minimum eight volume replacements per day), temperature-controlled system (17.0–19.6°C) equipped with UV-sterilization. Eggs were maintained in the dark from the time of fertilization/activation through hatching to prevent DNA from photoreactivation (Fopp-Bayat & Ocalewicz, 2015). Once hatched, haploid free embryos were transferred to labelled 75-ml test tubes (2.5 × 19 cm) fitted with screens of 400 μm-mesh to allow for continuous inflow of fresh well water. Free embryos were selected from the haploid treatments (shovelnose sturgeon × paddlefish) and preserved individually in 20% DMSO-0.25 M EDTA NaCl-saturated buffer (Seutin et al., 1991).
DNA from each of three female shovelnose sturgeon and 10 presumably haploid offspring from each female were extracted using the QIAamp DNA Micro Kit (Qiagen) to confirm haploid status of specimens. Broodstock and haploid specimens were genotyped alongside negative controls (water, no DNA) and positive controls (adult shovelnose sturgeon DNA, adult pallid sturgeon DNA, and adult paddlefish DNA of normal ploidy; 2n ≈ 120) at 19 sturgeon (McQuown et al., 2000) and four paddlefish (Heist & Krampe, 2011) microsatellite loci as in Flamio et al. (2021).
2.2 Gynogenetic haploid genomic sequencing and reference assembly
A total of 12 confirmed haploid individuals from three families (3, 4, and 5 individuals from the respective families) was used to assemble a reduced representation genomic reference. DNA was extracted using Mag-Bind Tissue DNA kits (Omega Bio-Tek), and a double digest restriction-site associated DNA (ddRAD; Peterson et al., 2012) library was produced as modified by Portnoy et al. (2015). Briefly, DNA was digested with the enzymes EcoRI and MspI. Samples were barcoded with unique adaptors for each of the 12 individuals, and then pooled into one index. Size selection was carried out on a Pippin Prep DNA size system (Sage Science Inc.) where fragments in the range 313–473 bp were selected. The library was sequenced on an Illumina MiSeq DNA sequencer (Genewiz) with 2 × 300 bp reads. Longer reads were used because they contain more substitutions which may facilitate differentiation between paralogous sequences.
Raw sequencing reads were demultiplexed using the process_radtags script in Stacks version 2.60 (Catchen et al., 2011, 2013). Reference genome construction, read mapping, and SNP calling were performed using dDocent version 2.7.8 (Puritz et al., 2014).
We used the package VCFtools (Danecek et al., 2011) and the protocols of O'Leary et al. (2018) to filter SNPs. First, loci were filtered that had a Phred quality score <20, maximum mean sequencing depth >2500 reads, and a minimum genotype depth of 3. Then, variant calls were converted into phased SNPs and indel (insertions-deletions) genotypes, with subsequent removal of indels from the data set. Loci that fell below a minimum mean sequencing depth <15 across all individuals and/or a genotype call rate <75% were removed. Paralogous contigs were identified in each family separately by identifying heterozygosity within haploid individuals at putative loci. Lists of paralogous contigs for each family were concatenated into a master file of PSVs that was later excluded from the list of potentially informative diploid SNPs for adult paleopolyploid sturgeon.
2.3 Selection of sturgeon for genomic sequencing
Fin clips were collected from wild-caught (any individual caught in the wild, may include unmarked hatchery-origin pallid sturgeon) pallid sturgeon (n = 18 and n = 30) and shovelnose sturgeon (n = 31 and n = 30) from the GPMU and CLMU, respectively. Due to the scarcity of wild pallid sturgeon in the GPMU, fin clips from F1 hatchery-origin offspring (n = 31) of wild-origin GPMU broodstock were also obtained. All fin clips were stored in 20% DMSO-0.25 M EDTA NaCl-saturated buffer. Parentage of the F1 hatchery-origin fish was confirmed using Cervus version 3.0 (Kalinowski et al., 2007; Marshall et al., 1998) and previously determined microsatellite genotypes of wild-origin GPMU broodstock (Steffensen et al., 2019). The hatchery-origin offspring selected to supplement genomic sequencing in this study were chosen such that none of the F1 fish selected shared any parents, nor were any of the parents among the wild-caught GPMU fish. All wild-caught shovelnose sturgeon and pallid sturgeon from the CLMU were first identified to species using microsatellites following Jordan et al. (2019). Only fish tentatively identified as pure pallid sturgeon or shovelnose sturgeon were selected for further analyses. Wild-caught pallid sturgeon were then checked against parental genotypes of known hatchery crosses made by the conservation propagation programme as in Steffensen et al. (2019). Several of the wild-caught CLMU pallid sturgeon were identified as F1 hatchery-origin fish with GPMU parentage and thus were analysed as part of the GPMU sample in this study. The 30 pallid sturgeon included in the CLMU sample were all confirmed as wild CLMU-origin sturgeon following the approach of Steffensen et al. (2019).
2.4 Diploid sturgeon genomic sequencing and SNP discovery
A ddRAD library was constructed using 40 pallid sturgeon and 29 shovelnose sturgeon from the GPMU, and 27 pallid sturgeon and 24 shovelnose sturgeon from the CLMU. DNA was extracted using Mag-Bind Tissue DNA kits (Omega Bio-Tek) and digested with the enzymes EcoRI and MspI. Samples were divided into four indexes in which samples were then barcoded with unique adaptors prior to pooling. Size selection was carried out on a Pippin Prep DNA size system (Sage Science Inc.), followed by ligation of index-specific adaptors and pooling. The library was sequenced on an Illumina HiSeq DNA sequencer (Genewiz) with 2 × 150 bp paired-end reads. Raw sequencing reads were demultiplexed as described above, and then mapped to the haploid reference using dDocent.
Single nucleotide polymorphisms were called in dDocent and filtered with both species combined according to O'Leary et al. (2018) (see Appendix S1 for more details). Several F1 hatchery-origin individuals were removed so that none of the fish retained were related (a few relatives were sequenced initially in case certain individuals had low sequencing coverage and needed to be replaced). Microhaplotypes were formed using the Perl script rad_haplotyper (Willis et al., 2017). Default parameters were used except the haplotype rescue parameter was set to three and loci were only kept if they were successfully haplotyped in at least 95% of individuals. After haplotyping, loci that rad_haplotyper flagged as possible paralogues or affected by genotyping error were removed. Monomorphic markers were removed from the final adult diploid genomic data set.
2.5 Species discrimination
Discriminant analysis of principal components (DAPC) was performed on the wild genomic data set using the package adegenet version 2.1.3 (Jombart, 2008) in R version 4.0.4 (R Core Team, 2021). DAPC analytical methods were largely based on Jombart and Collins (2015) and Miller et al. (2020). The optimal number of groups (K) present in the data set was determined de novo using the function find. clusters for K values from 1 to 10 and optimal K selected by assessing Bayesian Information Criterion (BIC) scores. An initial DAPC was run with the optimal K value and the number of principal components (PCs) that described 80% of the variance. The function xval was used to determine the number of PCs to retain, which was identified as the value with the lowest mean squared error (MSE). A final DAPC was performed for the genomic data set using the optimal K and selected number of PCs, and one discriminant function and success of assignment of each individual to the species identified morphologically was evaluated. Locus-specific contributions to the DAPC were evaluated by plotting loading principal component 1 (LD1) versus loci; the top 50, 100, 150, and 200 loci with the highest contributions were subsequently extracted. Individuals were plotted by the first two principal components for the entire genomic data set and the top 50, 100, 150, and 200 most informative loci.
Discriminant analysis of principal components with k-means clustering failed to discriminate between management units within species. Therefore, DAPC with a priori group membership was used to visualize differences among management units. To compare the resolution of the genomic data set and the previously existing panel of 19 microsatellite markers, DAPC was performed using the same individuals from each data set using protocols defined above.
2.6 Genetic diversity metrics
For each species, allele and genotype frequencies and conformance to Hardy–Weinberg equilibrium (HWE) were estimated using the genomic data set in the package genepop version 1.1.7 (Rousset et al., 2020) for R. For HWE, p-values were corrected for multiple testing using the false discovery rate procedure of Benjamini and Hochberg (1995) with the p.adjust function in the package stats version 3.6.2 included in R. The inbreeding coefficient (FIS) was calculated for species and management units using the package genepop. Expected heterozygosity (HS) for species and management units was calculated using the package adegenet. Pairwise FST (Weir & Cockerham, 1984) was calculated between species and management units using the R package StAMPP version 1.6.1 (Pembleton et al., 2013) using 10,000 bootstrap replicates to estimate 95% confidence intervals.
3 RESULTS
3.1 Production and verification of gynogenetic haploids for genomic sequencing
All 30 gynogenetic shovelnose sturgeon produced contained only one allele at each of the microsatellite loci in which the corresponding maternal parent was heterozygous. There was no amplification at the four paddlefish microsatellite loci for any of the 30 shovelnose sturgeon haploid gynogens; therefore, there was no evidence of paddlefish DNA in the specimens.
3.2 Gynogenetic haploid genomic sequencing and reference assembly
The final reduced-representation reference genome was built with the parameters c = 0.9 (sequences must have 90% sequence similarity to combine into one contig), K1 = 1 (only one individual must contain a sequence for it to be incorporated into the reference), and K2 = 3 (at least three reads for each sequence must be present for the sequence to be incorporated into the reference). The reference genome contained 60,846 contigs including multilocus contigs, and dDocent called 265,101 informative sites on 47,364 contigs in the haploid data set. A total of 46,240 potential PSVs, corresponding to 6884 contigs, were flagged as heterozygous within ≥1 haploids. The final catalogue included 40,480 orthologous loci.
3.3 Adult sturgeon genomic sequencing and SNP discovery
After discarding one individual from each of the nine related pairs, 566,816 SNPs were identified in 111 individuals. Of these, 70,097 SNPs were removed because they mapped to one of the 6884 potential PSVs identified in the reference. Two additional samples were discarded: (1) a GPMU shovelnose sturgeon individual due to a high level of missing data (~75%), and (2) a GPMU pallid sturgeon individual (which did not have a relative to use as a replacement) due to an abnormally low FIS value (excess heterozygosity) compared to the other pallid sturgeon sequenced (Figure S1a), which was indicative of potential contamination. No individuals from the shovelnose sturgeon group were discarded based on FIS values (Figure S1b). Overall, 109 out of 111 individuals were retained in the final SNP data set, which was collapsed into 11,082 haplotyped loci.
3.4 Species discrimination
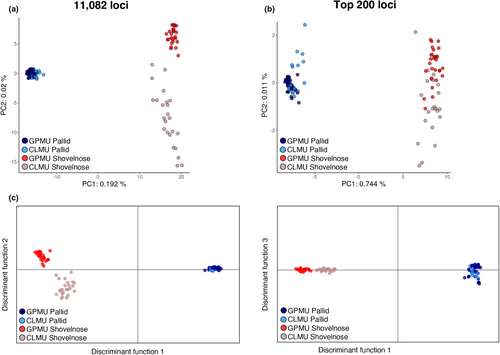
The optimal number of groups identified in the entire genomic data set was 2 (K = 2) (Figure S2a), and 15 principal components were retained in the final DAPC (Figure 2a). The genomic data set had 100% agreement between morphological identification and genetic assignment (Figure 2b). The two species were clearly differentiated along PC1 in the genomic data set (Figure 3), with increasing resolution between species as the number of loci increased. The PCA using the full genomic data set also provided some resolution at the management unit level, particularly for shovelnose sturgeon (Figure 4a), while the top 200 most informative loci resulted in less resolution between management units (Figure 4b). DAPC with a priori group membership to management unit (five principal components, 74.9% mean assignment) provided some resolution between the GPMU and CLMU for shovelnose sturgeon, but not for pallid sturgeon (Figure 4c).
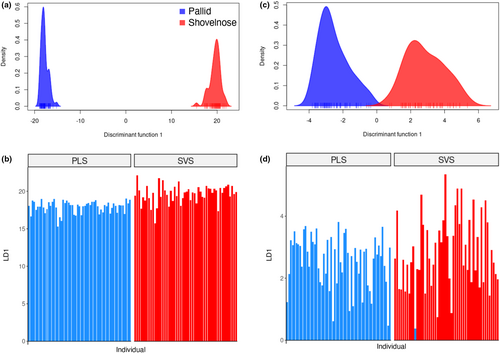

For DAPC analysis of the previously existing suite of 19 microsatellite markers, the optimal number of groups was equal to 2 (K = 2) (Figure S2b). and 15 principal components were retained in the final DAPC (Figure 2c). The microsatellite data set incorrectly assigned one shovelnose sturgeon to the pallid sturgeon cluster (Figure 2d). Comparing the DAPC analyses between the genomic and microsatellite data sets, there was at least an order of magnitude higher resolution between species using the genomic data set (Figure 2).
3.5 Genetic diversity metrics
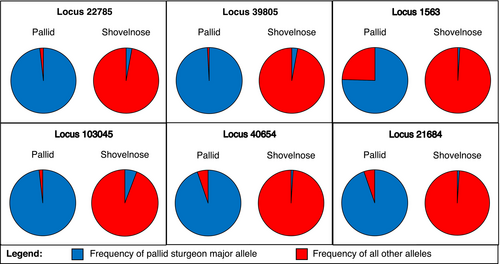
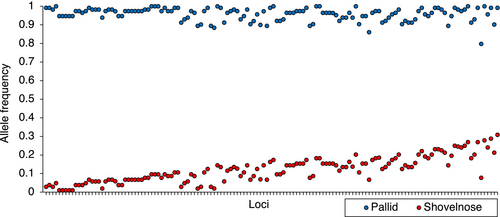
The were no fixed differences between species when considering all 11,082 microhaplotypes in the genomic data set; however, there were many nearly fixed differences (Figures 5 and 6). Within pallid sturgeon, fixed alleles were present at 30 loci that were the minor alleles (minor allele frequency <0.5) in shovelnose sturgeon. After correction, Hardy–Weinberg exact tests were statistically significant for 49 loci in pallid sturgeon and 101 loci in shovelnose sturgeon, 20 of which were out of HWE in both species (see Figure S3 for distribution of FIS values for each population). Global estimates of FIS were 0.010 for pallid sturgeon and 0.027 for shovelnose sturgeon. Expected heterozygosity (HS) was 0.162 for pallid sturgeon and 0.261 for shovelnose sturgeon. FST between pallid sturgeon and shovelnose sturgeon was 0.184 (95% confidence interval: 0.176–0.192). FIS, HS, and pairwise FST at the management unit level are presented in Table 1.
| Population | F IS | H S | FST GPMU PLS | FST CLMU PLS | FST GPMU SVS |
|---|---|---|---|---|---|
| GPMU PLS | 0.002 | 0.162 | |||
| CLMU PLS | −0.001 | 0.160 | 0 (−0.001–0) | ||
| GPMU SVS | 0.017 | 0.251 | 0.196 (0.188–0.205) | 0.190 (0.182–0.199) | |
| CLMU SVS | 0.018 | 0.262 | 0.186 (0.177–0.194) | 0.179 (0.170–0.187) | 0.018 (0.017–0.020) |
- Note: Metrics include the inbreeding coefficient (FIS), expected heterozygosity (HS), and pairwise comparisons of FST. FST bootstrap values with 95% confidence intervals (in parentheses) are present in the lower matrix.
4 DISCUSSION
The current study successfully used haploid gynogens to discover diploid loci for specific applications. Several sturgeon species have the same ploidy level as Scaphirhynchus sturgeons (e.g., some Acipenser spp., Huso spp.; Vasil'ev, 2009), and production of haploid gynogens in these species may aid in diploid marker development and identification of paralogous loci in these species. Additionally, haploid gynogens may be useful in resolving the sequences of certain areas of new sturgeon genomes (e.g., the sterlet genome: Du et al., 2020) complicated by tetrasomic inheritance. Haploid gynogens have been successfully produced in other ~120 chromosome sturgeon species (e.g., sterlet: Fopp-Bayat et al., 2017), and haploid gynogens produced in other paleotetraploid animal and plant taxa may benefit from using our approach to identify paralogous loci.
The new haplotyped markers derived in this study were much more powerful than the current suite of 19 microsatellite loci (Jordan et al., 2019) used to differentiate the pallid sturgeon and shovelnose sturgeon species as evident by DAPC. Even when the number of SNP markers was reduced from the entire 11,082 haplotyped data set to the 200 most informative loci for species discrimination, there was still far greater resolution than the currently used suite of 19 microsatellite loci. Furthermore, the microsatellite loci incorrectly assigned one morphological shovelnose sturgeon to the pallid sturgeon group, whereas the new haplotyped markers had 100% consistent species assignment.
To avoid ascertainment bias (i.e., by choosing the loci that were most discriminatory among the surveyed individuals), the loci derived in this study should be tested against an independent set of individuals to validate discriminatory power. Genotyping large numbers of archived tissue samples from pallid sturgeon, shovelnose sturgeon and hybrid sturgeon using some of the more powerful loci described in this study in a genotyping-in-thousands by sequencing (GT-Seq; Campbell et al., 2015) approach may accomplish this goal. Because GTseq panels can identify and accurately genotype paralogous loci (McKinney et al., 2020), GTseq from a larger number of individuals will allow us to eliminate any paralogous loci that avoided detection using our methodology.
Despite the clear groupings of the species in the DAPC plots, there were no fixed differences observed between the species, and shovelnose sturgeon had higher levels of variation (Hs) than pallid sturgeon. These findings are similar to previous studies based on allozymes (Phelps & Allendorf, 1983), mitochondrial DNA (Campton et al., 2000), and microsatellites (Schrey et al., 2011). Metcalf (1966) hypothesized that pallid sturgeon originated during the pre-Pleistocene when the Missouri River Basin flowed northward into Hudson Bay in complete isolation from the Mississippi River drainage. The absence of alleles unique to pallid sturgeon and the higher levels of genetic variation in shovelnose sturgeon seen in this and previous studies are consistent with a more recent origin of pallid sturgeon probably in a glacial refugium during the Pleistocene (Campton et al., 2000). Despite the lack of fixed differences, the clear genetic divergence along with the morphological, ecological and life history differences (Jordan et al., 2016) indicate that the species are distinct, and genetic information can be used to avoid inadvertently propagating and stocking hybrids. The markers developed in this study will provide unprecedented resolution for assessing the extent and trajectory of hybridization and for validating pure pallid sturgeon ancestry of broodstock in the pallid sturgeon captive propagation programme. Furthermore, loci derived from this study that are informative at the management level within species may be useful for future intraspecies genetic variation studies, particularly within shovelnose sturgeon.
Future research may include production of a linkage map from haploid gynogen family crosses. Linkage maps are useful tools for conservation and evolutionary genetics/genomics and have multiple applications including quantitative trait locus (QTL) mapping (Broman et al., 2003) and identification of patterns of chromosome rearrangement (Leitwein et al., 2017). A linkage map is also useful for identifying suites of unlinked markers for population genetic analyses including differentiation among management units and an estimate of the effective population size of pallid sturgeon (Hollenbeck et al., 2019).
5 CONCLUSION
This study used a strategic, novel approach of using experimentally produced haploid gynogens to identify disomic markers in polyploid sturgeon. Thousands of haplotyped markers were identified, many with nearly fixed differences between species. The clear genetic groupings of species evident in this study confirm pallid sturgeon are a distinct species from shovelnose sturgeon. Additionally, the lack of fixed allelic differences between species, the absence of alleles unique to pallid sturgeon, and the greater levels of genetic variation in shovelnose sturgeon support the hypothesis that pallid sturgeon most likely originated in a glacial refugium during the Pleistocene. The markers derived in this study will be instrumental in increasing the level of detection of introgressed individuals to avoid stocking pallid sturgeon with shovelnose sturgeon ancestry and to characterize the extent and trajectory of hybridization.
ACKNOWLEDGEMENTS
We would like to thank Drs. Shannon O'Leary and Andrew Fields from the Marine Genomics Laboratory at Texas A&M University Corpus Christi for their guidance with ddRADseq, dDocent, and SNP filtering. We would also like to thank James Candrl, Marlene Dodson, Dave Combs, Sabrina Davenport, Killian Kelly, and Ross Burlbaw from USGS, Columbia Environmental Research Centre, for their help with production of haploid gynogens and retrieval of fin clips from adult sturgeon in the CLMU. Thank you, Matt Rugg, Jordan Pesik, Tyler Haddix, and John Hunziker from Montana Fish, Wildlife and Parks as well as Trevor Gust (Bureau of Reclamation) and Ryan Wilson (USFWS) for help with collection of fin clips from adult sturgeon in the GPMU. Chris Hooley and staff from Gavins Point National Fish Hatchery, USFWS, were instrumental in retrieving fin clips from adult sturgeon from the GPMU. From the Conservation Genomics Laboratory at Southern Illinois University Carbondale, Amy Buhman provided support with extracting DNA for microsatellites and Aaron Krolow assisted in data curation. Any use of trade, firm, or product names is for descriptive purposes only and does not imply endorsement by the U.S. Government.
CONFLICT OF INTEREST
The authors declared no conflict of interest.
FUNDING INFORMATION
Funding for this work was provided by the U.S. Army Corp of Engineers Missouri River Recovery Programme-Integrated Science Programme and the U.S. Geological Survey Ecosystems Mission Area.
Open Research
OPEN RESEARCH BADGES
This article has earned an Open Data badge for making publicly available the digitally-shareable data necessary to reproduce the reported results. The data is available at https://doi.org/10.5061/dryad.mcvdnck1x.
DATA AVAILABILITY STATEMENT
Raw sequencing reads, the haploid reference sequence, the VCFs containing raw SNPs for the haploid gynogens and the adult paleotetraploid data sets, the filtered Genepop file used for population genetic analyses, and microsatellite genotypes have been made available on Dryad (https://doi.org/10.5061/dryad.mcvdnck1x). Annotated scripts for production of the reference sequence, filtering of SNPs, and population genetics analyses are available at https://github.com/rflamio/sturg-snps.


