Single droplet drying of dairy-based systems at spray drying like temperature–time trajectories
Abstract
Upon spray drying of dairy powders, the distribution of components within the droplets can become nonuniform. In this study, the influence of the composition on the drying behaviour, morphological development and surface composition were studied using single droplet drying. The addition of fat was found to result in an earlier locking point (1.1 instead of 1.8 s). The fat content did not influence the morphological development, but the protein and lactose ratios did influence whether the dried particle was smooth or wrinkled. Confocal Raman microscopy revealed that the initial fat, lactose and protein contents influenced the dry surface composition. For example, fat was found on the surface of emulsions that were either rich in fat or in whey protein.
INTRODUCTION
The dairy industry processes a wide variety of emulsified products. Milk itself is an oil-in-water emulsion stabilised by proteins (Langevin 2020). These complex, multicomponent systems are often processed into powders by spray drying, as powdered dairy products have an increased shelf life and are easier to handle, store and transport compared with fresh dairy products. Moreover, spray drying can provide excellent encapsulation efficiency of the oil present in an emulsion (Tabatabaei et al. 2022; Höhne and Gaukel 2024). However, the production of these spray-dried dairy powders is very energy intensive, and reducing the energy consumption of the process, while still ensuring excellent quality powder, is important. To do this, we need a better understanding of the underlying mechanisms involved in spray drying.
Single droplet drying is a promising technique to gain a mechanistic understanding of spray drying processes (Schutyser et al. 2019). While typical single droplet dryers subject a droplet to a constant temperature, this is not the case in an industrial spray dryer. However, the impact of the more complex temperature–time trajectories in industrial dryers on the drying of individual droplets is unknown. We have recently introduced a custom-made single droplet dryer that allows a two-step simulation of spray drying temperature–time trajectories (Eijkelboom et al. 2024). However, in the latter work, we focused on single-component model systems, while industrially dried systems, like dairy systems, typically contain multiple components. Interactions between the components could influence the drying behaviour and are therefore of interest to investigate.
A common effect observed for multicomponent systems upon drying is component segregation, which can occur due to phase separation or differences in diffusivities, and creates differences in composition between the core and the surface of the dried product. The surface composition of a powder is strongly correlated to product properties such as flowability, sticking behaviour and reconstitution behaviour (Porowska et al. 2016). The distribution of the different components in the final dry particle will highly affect the powder quality and product performance. As an example, lipid oxidation reduces if the amount of surface fat is lower (Granelli et al. 1996). Besides, surface fat contributes to the caking of powders during storage (Foster et al. 2005).
To investigate the segregation of components in powders, confocal Raman microscopy can be applied. This technique does not require any pre-treatment of the sample but does require spectral resolution of the investigated components (Hooiveld et al. 2023). Components that are of interest within the food industry, like lipids and proteins, however, do show a big overlap in their Raman spectra. Therefore, for these components, the interpretation of the data depends on specific peaks rather than on the full spectrum (Dahl et al. 2023). Previous research used confocal Raman microscopy to study component segregation in single droplets of multicomponent mixtures that were dried at constant air temperatures (Nuzzo et al. 2015a; Both et al. 2018). For systems containing lactose and surface-active components, component segregation was observed, and the surface of the dried particle was enriched in the surface-active components (Nuzzo et al. 2015b). Systems containing protein, lactose and fat showed a very thin layer of protein at the surface (Both et al. 2018). However, for both studies the interpretation of the results was based on auto-generated images from on the full Raman spectrum, rather than using component-specific peaks. Besides, component segregation is a temperature-dependent process, and drying a droplet with a temperature–time trajectory rather than with a constant temperature may influence the segregation process.
The objective of this study was, therefore, to investigate the drying behaviour of multicomponent dairy systems dried with temperature–time trajectories mimicking co-current spray-drying conditions. The locking point and morphology of the dried droplets are determined, as well as the dried surface composition based on confocal Raman microscopy. The interpretation of the confocal Raman data is based on component-specific peaks that are determined using pure components. The obtained results help to understand component segregation in multicomponent systems upon spray drying and thus create powdered products of excellent quality.
MATERIALS AND METHODS
Materials
Lactose (Lactopure®, 99.7% lactose), whey protein isolate (WPI) (Nutri Whey™ Isolate R, 90% protein content) and micellar casein isolate (MCI) (Refit™ MCI, 88% protein, of which 90% is casein) were kindly provided and characterised for their composition by FrieslandCampina (the Netherlands). Sunflower oil was obtained from Coppelia (Cargill, USA). Demineralised water was used.
Preparation of the drying solution
Dairy emulsions with a water content of 80% (w/w) were prepared. Different ratios of lactose, WPI, casein isolate and sunflower oil were used (Table 1). After mixing the ingredients for 2 h, the solution was pre-emulsified by using a rotor-stator homogeniser (T18 digital Ultra-turrax®; IKA, Germany). For all different compositions, mixing for 2 min at 10 000 rpm combined with three cycles through a high-pressure homogeniser (M-110Y Microfluidizer; Microfluidics, USA) with an F12Y and APM H30Z chamber with an inlet pressure of 80 PSI (552 kPa) was used. For the Standard composition, two more preparation techniques were used. The first one was identical to the previously described method, except for a change in the inlet pressure of the high-pressure homogeniser to 40 PSI (276 kPa). For the second preparation technique, only the rotor-stator homogeniser was used. The solution was mixed for 10 min at 15 000 rpm.
| Sample name | Fat (w/w %) | Lactose (w/w %) | WPI (w/w %) | MCI (w/w %) |
|---|---|---|---|---|
| Standard | 2.0 | 9.0 | 4.5 | 4.5 |
| No fat | 0.0 | 10.0 | 5.0 | 5.0 |
| High fat | 6.7 | 6.7 | 3.3 | 3.3 |
| High lactose | 2.0 | 14.0 | 2.0 | 2.0 |
| High protein | 2.0 | 4.0 | 7.0 | 7.0 |
| High WPI | 2.0 | 9.0 | 1.8 | 7.2 |
| High MCI | 2.0 | 9.0 | 7.2 | 1.8 |
| Lactose + WPI | 0.0 | 10.0 | 10.0 | 0.0 |
| Lactose + MCI | 0.0 | 10.0 | 0.0 | 10.0 |
- MCI, micellar casein isolate; WPI, whey protein isolate.
Oil droplet size determination
The size distributions of the oil droplets in the prepared emulsions were determined in triplicate using laser diffraction with a Mastersizer 3000 (Malvern Panalytical, UK). A Hydro MV dispersion unit was used, operating at a stirring speed of 1400 rpm. The refractive index was set to 1.456 for the dispersed phase and to 1.330 for the dispersant. An absorption index of 0.01 was applied. The Mie theory is used for oil droplet size determination.
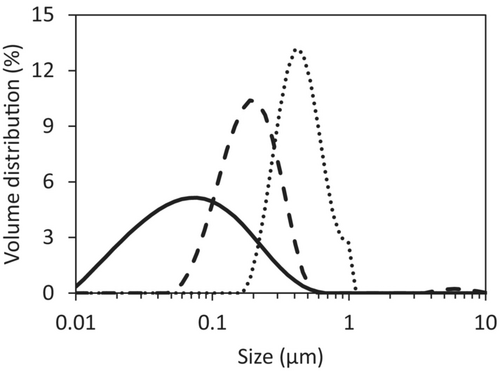
The oil droplet size distribution of the Standard emulsion prepared in different ways is depicted in Figure 1. All other emulsions prepared by using the rotor-stator homogeniser for 2 min at 10 000 rpm plus three 80 PSI cycles with the high-pressure homogeniser had similar oil droplet size distributions as the Standard emulsion, which should, therefore, not influence the drying behaviour. The obtained most common oil droplet sizes for the different preparation techniques of 0.08, 0.2 and 0.4 μm are all at the smaller end of the size range of oil droplet sizes in homogenised bovine milk, human milk and infant milk formula (Michalski et al. 2005; Gallier et al. 2015; Mulet-Cabero et al. 2019). Since high stresses during atomisation can lead to further oil droplet breakup, it is expected that these smaller oil droplet sizes well represent the oil droplet size in a dairy slurry to be spray-dried (Taboada et al. 2021).
Single droplet drying
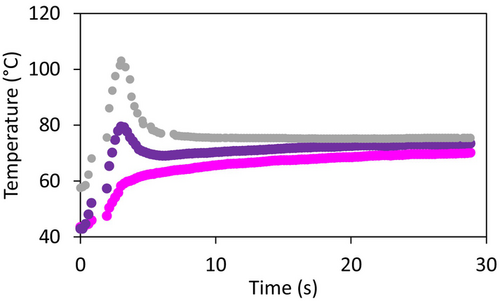
Drying of single droplets was performed with the sessile single droplet drying platform that was earlier described in more detail (Eijkelboom et al. 2024). The droplets had an initial radius of 200 ± 20 μm. For all different compositions investigated, droplets were dried with a temperature–time trajectory that starts with an inlet air of 220°C flowing at 20 L/min for 2 s, followed by air of 80°C flowing at 10 L/min for 28 s. For the Standard composition, drying trajectories that start with an inlet air of 150°C or 80°C at 20 L/min for 2 s, followed by air of 80°C flowing at 10 L/min for 28 s were also applied. For all solutions, three individual droplets were dried. The temperature of the air near the droplet was monitored throughout the drying process (Figure 2). The drying process was filmed at 100 fps with a high-speed camera (C-VIT; AOS Technologies AG, Switzerland) equipped with a VZMTM 1000 Zoom Imaging Lens (Edmund Optics, Japan). The movies are used to visually observe the morphological development and the locking point, that is, the first point at which shape deviation from a spherical cap is visually observed (Siemons et al. 2020).
Scanning electron microscopy
Of each sample type, one dried droplet was visually inspected using a JCM-7000 SEM (JEOL, Japan). The dried droplets were coated with gold using a JEOL Smart-Coater (JEOL, Japan). The images were taken at an acceleration voltage of 5.0 kV.
Confocal Raman microscopy
To investigate the distribution of components within the dried droplets, confocal Raman microscopy (Alpha300 R; WITec, Germany) was applied. A 100× air objective with a numerical aperture of 0.9 and a laser with an excitation wavelength of 532 nm were used.
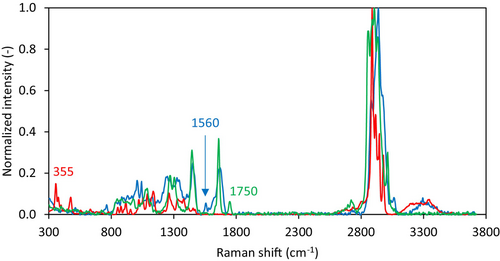
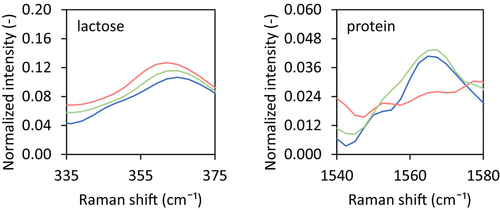
For the three different components present, that is, lactose, protein and fat, single spectra of the pure components were obtained using 100 accumulated measurements with an integration time of 0.5 s (Figure 3). Based on these raw spectra, component characteristic peaks could be identified. For lactose, these peaks are at 355 and 468 cm−1, in line with values reported in the literature (Pax and Sheehan 2020; Khan et al. 2023). Protein-specific peaks were observed at 755, 1560 and 3060 cm−1, also in line with values reported in the literature (McColl et al. 2003; Chen et al. 2014; Dahl et al. 2023). For fat, only one specific peak could be identified, at 1750 cm−1 which again is in line with values reported in the literature (Pax and Sheehan 2020, Khan et al. 2023). For further analysis, we zoomed in to only one characteristic peak per component, being the 355 cm−1 for lactose and the 1560 cm−1 for the protein, as these peaks showed the clearest change in intensity upon changing the composition.
For the dried particles, depth scans were taken to investigate the inward gradient of the Raman signal. The scans were taken with an image size of 40 (width) by 100 (depth) points, applying a point size of 0.5 μm. An integration time of 0.5 s was applied. The signals were cleaned by cosmic ray removal with a filter size of 2 and a dynamic factor of 8, average smoothing with a spectral filter size of 3 and a spatial filter size of 0, and background subtraction with a shape size of 300.
A MATLAB script (MATLAB R2018b; MathWorks, United States) was developed to analyse the confocal Raman spectra. The spectra were binned per depth layer, generating an average spectrum per depth. This was done for the top 10 μm of the droplet, as the Raman signal decreases with the depth (Everall 2010) and preliminary experiments (results not shown) indicated that there was no detectable signal for deeper measurements. The Raman spectra at different depths within a droplet were compared (Figure 4a). Due to the loss of scattering and absorption of the excitation and emission light, it is not immediately clear whether the changes can be attributed to overall signal decreases or to compositional changes (Macdonald and Vaughan 2007). Therefore, to compare the compositions of the droplet at different depths, the Raman signals were normalised, based on the total integral of the Raman spectrum. This clarified that there was no clear difference in composition over the investigated 10 μm (Figure 4b). This is only shown for one of the samples, but this observation holds for the other samples as well (results not shown).
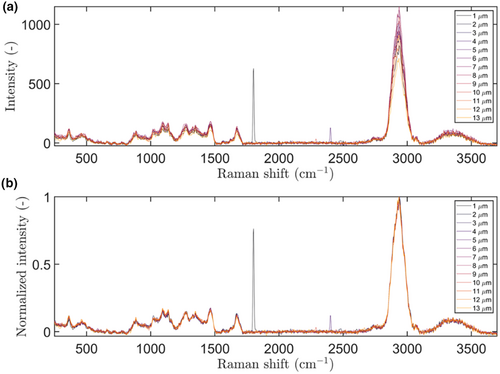
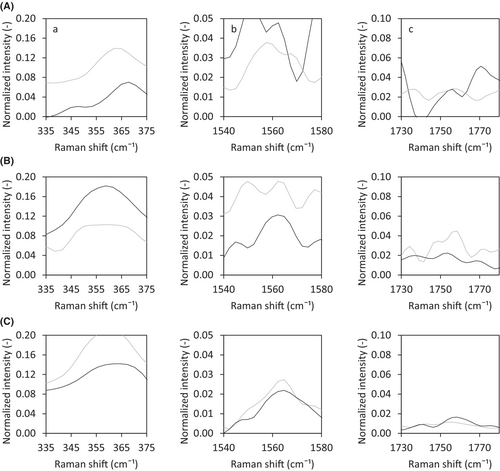
As our samples showed no difference in normalised Raman spectra for the different depths, only the average spectrum of the depth showing the strongest absolute signal was used for further data interpretation. This strongest signal was assumed to be present at the interface between the droplet and the surrounding air. To compare the spectra of different samples, the absolute intensities were normalised over the intensity of the peak near 2950 cm−1, which is caused by C-H bonds (Zhang et al. 2011). As the characteristic Raman shift of the C-H peak might slightly change depending on the measurement, the maximum intensity in the range of Raman shifts of 2915 to 2985 cm−1 was used. As C-H bonds are present in all the components used in the emulsions investigated in this research, this should not distort the results. Measurements have been performed in duplicate, but the result of only one of the measurements is shown. The noise level and the exact value of the normalised intensity vary between samples of the same initial composition (Figure A1 in Appendix), but the presence or absence of component-specific peaks is consistent. We can therefore draw qualitative conclusions but have to refrain from quantitative interpretation.
Experimental design and statistics
For all different feed solutions, the oil droplet size was determined in triplicate, and the results of one representative sample are shown. Per solution, three individual droplets were dried and filmed with a high-speed camera. The locking points are based on the average values of the three droplets, and standard deviations are indicated. Initial indications of the morphology of the dried particles can be obtained from the high-speed camera movies for all droplets, and per sample type one representative droplet is used to obtain a scanning electron microscopy image. Confocal Raman microscopy is performed on two droplets per sample type, and the results of one of these droplets are shown.
RESULTS AND DISCUSSION
Fat content
Upon drying droplets with different initial fat contents, the addition of fat resulted in an earlier locking point. For the No fat, Standard and High fat samples, the locking points were determined at 1.8 (±0.1), 1.1 (±0.1) and 1.1 (±0.2) s, respectively. This is in line with the observations of Shamaei et al. (2016), who concluded that an increase in oil concentration results in an earlier locking point. The increase in the diffusion path of the moisture in the droplet hinders evaporation earlier on, which may be the cause of this earlier locking point.
The morphological development of the droplets did not differ upon changing fat content (Figure 5). This is in line with the research of Both et al. (2018), who also observed no impact of fat on the particle morphology and who hypothesised that fat present in the form of emulsified droplets does not impact the structural strength of the skin.
Confocal Raman microscopy was used to investigate the presence of lactose, fat and protein at the surface of the dried droplets. For the No fat and Standard compositions, both lactose and protein were present at the surface of the dried droplet (Figure 6a,b, indicated by the presence of a peak), while fat was absent (Figure 6c, indicated by the absence of a peak). The dried droplet from the High fat matrix showed no presence of lactose and protein at the surface (Figure 6a,b, absence of a peak), but fat was definitely present (Figure 6c, presence of a peak).

Earlier work by Nuzzo et al. (2017) investigated the surface of a whole milk particle dried with ultrasonic levitation-based single droplet drying. The droplet had an initial dry matter content of 48%, an initial size in the range of 800–1000 μm, and was dried with air with a relative humidity of 7% and a temperature of 80°C. They observed that the surface of the dried droplet consisted of an outer layer dominated by proteins, and an inner layer dominated by lactose. Fat globules were present in the core of the dried droplet. However, they also observed that droplets of similar composition dried in a pilot plant or full-scale spray drier showed a different surface composition compared with that for single droplet drying. The droplets dried at a larger scale had a smaller initial size and were dried at high inlet air temperature, resulting in faster drying and allowing less time for depletion or enrichment of specific components at the surface. Although the droplets dried in our study have a higher initial moisture content, they are smaller and are dried at higher initial air temperatures than those applied by Nuzzo et al. (2017). For the No fat and Standard droplet compositions, drying was fast enough to avoid the separation of lactose and protein at the surface.
Fat at the surface of the dried droplet was only detected for the High fat sample. This may be explained by the higher fat-to-protein ratio. At a 1:1 fat-to-protein weight ratio, the protein content might be insufficient to stabilise all oil droplets. The presence of oil at the surface is also observed for industrially dried milk powder. High-pressure atomisation of the milk can lead to rupture of oil droplets, resulting in the emergence of surface fat during drying (Foerster et al. 2016; Nuzzo et al. 2017).
Oil droplet size
The stability of the oil droplets in an emulsion is influenced by their size, with smaller oil droplet sizes having a higher stability against rupture by shear (Santos et al. 2022). Since the emulsion stability might influence the results, we investigated Standard compositions emulsified with different intensities to obtain different oil droplet sizes.
Only small differences in locking point were observed. The locking point of the emulsions with oil droplet sizes of around 0.08, 0.2 and 0.4 μm were at 1.3 (±0.1), 1.2 (±0.1) and 1.1 (±0.1) s, respectively. Concerning morphological differences, an increase in oil droplet size led to more spreading and hence more flattened dried droplets (Figure 7). As the contact surface below the droplet was made of a hydrophobic material, this might be a first indication that the droplet surface is richer in hydrophobic components, that is, fat.
Nonetheless, this difference in the presence of fat on the surface was not observed with the confocal Raman microscopy (Figure 8). Within the oil droplet size range investigated, the presence of components on the surface of the dried droplet did not differ. All dried droplets showed the presence of lactose and protein on the surface, while fat was not detected. This was not expected based on the work of Linke et al. (2020), where an increase in oil droplet size resulted in a decrease in oil encapsulation efficiency during pilot-scale spray drying. However, they used much lower protein-to-oil ratios of 0.02–0.22% (w/w), which results in less stable emulsions. This indicates that all investigated emulsions in our research are stable, with no indication of any rupture of oil droplets or the presence of surface fat.

Lactose-to-protein ratio
Because of their emulsifying properties, proteins influence the stability of oil droplets in an emulsion (Euston and Hirst 2000). Changing the protein content by altering the lactose-to-protein ratio may therefore influence the emulsion stability, and hence component segregation. Upon changing the lactose-to-protein ratio of the drying droplet, the locking point remained unchanged. For the High lactose (7:2 lactose-to-protein ratio), Standard (1:1 lactose-to-protein ratio) and High protein (2:7 lactose-to-protein ratio) slurries, the locking point was, respectively, at 0.9 (±0.1), 1.1 (±0.1) and 0.8 (±0.2) s. In previous research on solutions dried at lower temperatures, high molecular weight compounds such as proteins gave an earlier locking point than low molecular weight compounds (Sugiyama et al. 2006; Siemons et al. 2020; Eijkelboom et al. 2023a). At higher drying temperatures, drying goes much faster, and the locking point is obtained earlier, making differences in locking point too small to detect.
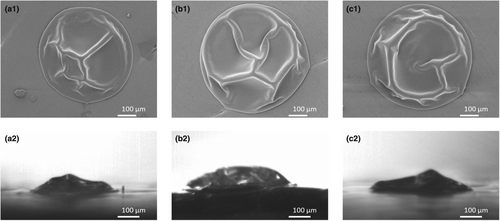
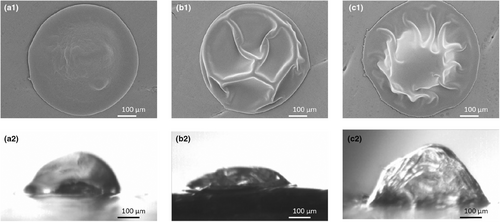
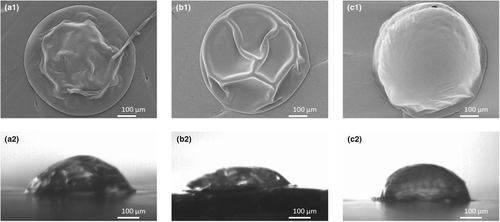
Differences were observed regarding the morphology of dried droplets containing different lactose-to-protein ratios (Figure 9). The High lactose system dried into a smoother particle, while the addition of protein resulted in a more wrinkled morphology. A droplet of the High protein system showed vacuole formation, resulting in a larger, partially puffed particle. Vacuole formation for protein and smooth particle formation for small sugar matrices was also observed in previous studies. Small sugars contribute to viscous behaviour and thus more gradual skin formation, resulting in continuous shrinkage and the formation of a dense, spherical particle. Proteins may jam at high concentrations and form an elastic skin, which becomes rigid and then can no longer shrink. The internal pressure will drop due to proceeding water evaporation, creating a vacuole (Siemons et al. 2021; Eijkelboom et al. 2023a).
Confocal Raman microscopy showed that varying the lactose-to-protein ratio did influence the composition on the surface of the dried droplet. While the Standard composition showed the presence of both lactose and protein at the dried surface, the dried surface of the lactose-enriched sample only contained lactose without much evidence of protein, and that of the protein-enriched sample only contained protein, without indication of lactose (Figure 10). This indicates that lactose and protein can outcompete each other at the surface of the dried particle, based on their relative presence in the drying matrix.

Whey-to-casein ratio
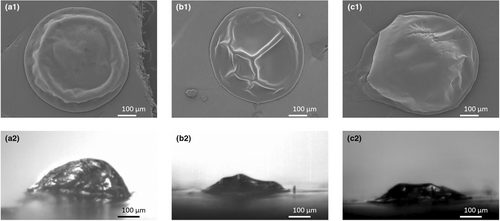
Different proteins have different emulsifying properties. Whey protein is a good emulsifier, while micellar casein is a poor emulsifier (Euston and Hirst 2000). A change in the whey-to-casein ratio might influence the emulsion stability. The locking point of the drying droplet did not change upon changing the whey-to-casein ratio. For the High MCI (4:1 MCI-to-WPI ratio), Standard (1:1 MCI-to-WPI ratio) and High WPI (1:4 MCI-to-WPI ratio) solutions, the locking points were observed at 1.1 (±0.1), 1.1 (±0.1) and 1.0 (±0.1) s, respectively. Nonetheless, morphological differences were clearly there (Figure 11), being in line with the work of Sadek et al. (2014), Bouman et al. (2016) and Both et al. (2018). While the system rich in MCI becomes more wrinkled, the system rich in WPI is smooth, with probably a vacuole. Upon drying, jamming of whey protein, which are ‘rigid sphere’ proteins, results in the formation of relatively rigid shells. Casein micelles, which are ‘soft sphere’ proteins, can deform after jamming, making the shell more flexible and resulting in a wrinkled morphology.
The surface composition of the dried droplets did differ based on the WPI-to-MCI ratio. While the surface of the Standard and High MCI sample contained lactose and protein, the surface of the dried High WPI solution only contained fat (Figure 12). Independent of the type of protein used, the high protein-to-fat ratio and small oil droplet size in all emulsions make it unlikely that any of them will be unstable. The fatty surface of the High WPI sample was, therefore, not expected. This result was even more surprising since the emulsifying properties of WPI are better than those of MCI (Euston and Hirst 2000). Differences in the surface composition related to the morphological differences observed. The High WPI system turned into a smooth and hollow particle, instead of a wrinkled system. Although not clearly visible in the images provided, previous research indicated that skin rupture was observed for drying droplets with a vacuole (Bouman et al. 2016; Eijkelboom et al. 2023a). Through such a rupture, oil could have leaked out, covering the surface.

Fat-free products
To complement our findings on the impact of the whey-to-casein ratio, fat-free slurries with different whey-to-casein ratios were also investigated. The locking point of these fat-free systems did not differ, as was the case for their fat-containing counterparts. For the Lactose + MCI, Lactose + MCI + WPI and Lactose + WPI sample, the locking points were, respectively, at 1.8 (±0.1), 1.8 (±0.1) and 1.6 (±0.2) s. The fat-free products do have a later locking point than their fat-containing counterparts (High MCI, Standard and High WPI), which is in line with the results obtained for the samples differing in fat content. The same morphological differences, with the MCI system resulting in more wrinkled particles and the WPI in a smoother particle, were also observed (Figure 13).
Regarding the surface composition of the dried droplets that did not contain any fat and varied in WPI-to-MCI ratio, it was observed that the surface of the dried droplet that was composed of lactose and MCI only consisted of lactose. The surface of the other dried droplets, where only WPI or a mixture of WPI and MCI was present as the protein source, was composed of both lactose and protein (Figure 14). This indicates that the smaller molecules, that is, the lactose and whey protein, are present at the surface of the dried droplets, while the large micellar casein is not. This is in contradiction to previous confocal Raman measurements on dried single droplets which indicated that the outermost layer was dominated by the larger components (Nuzzo et al. 2017; Both et al. 2018). However, the stratification of small molecules at the top of a drying object was seen before in drying films (Fortini et al. 2016; Fortini and Sear 2017; Schulz and Keddie 2018). These authors concluded that stratification of small particles on top may occur when the solvent evaporation rate is sufficiently high. In that case, the moving interface creates a pressure gradient, pushing large particles away from the interface faster than it pushes small particles. In the work of Both et al. (2018) and Nuzzo et al. (2017), larger droplets (800–1200 μm) were dried with air of a constant temperature (70–90°C), resulting in slower drying. These lower evaporation rates might have been insufficient to cause this small-on-top stratification.
Inlet temperature
To investigate whether slower drying does indeed result in component segregation, the Standard emulsion composition was dried with different temperature–time trajectories. A higher drying air temperature results in faster drying and hence an earlier locking point (Shamaei et al. 2017; Eijkelboom et al. 2024). For the temperature–time trajectories with an initial drying air temperature of 80, 150 and 220°C, the locking points were at 1.7 (±0.1), 1.5 (±0.1) and 1.1 (±0.1) s, respectively.
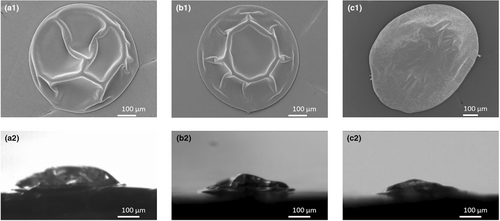
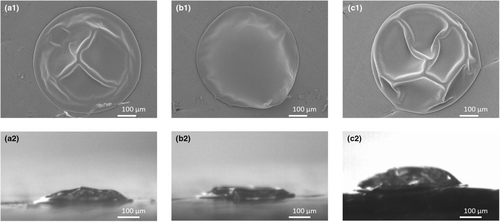
Based on top-view images, the morphologies of the droplets of the Standard emulsion dried at different temperature–time trajectories are different, with the droplet initially dried with air of 150°C being smoother (Figure 15). Based on the side view, the morphology of the droplets of the Standard emulsion dried at different temperature–time trajectories are, however, quite similar (Figure 15). In the work of Siemons et al. (2021), this was also observed for 20% (w/w) maltodextrin DE5 solutions dried at 90°C, resulting in both smooth and dented particles. In general, an increase in drying temperature and the resulting faster skin formation led to more irregularly shaped, hollow or collapsed particles (Boel et al. 2020). This may be less apparent in in the current work due to the small differences in locking points, and hence in the speed of skin formation.
Independent of the temperature–time trajectory applied, both lactose and protein were present at the surface of the dried droplet (Figure 16). However, no distinction between WPI and MCI can be made based on confocal Raman data, and it is therefore unknown whether the stratification with smaller molecules accumulated at the surface occurred under all drying conditions.

CONCLUSION
Feed formulations dried within a spray dryer are commonly multicomponent systems, like dairy systems. The composition of such a system may influence the locking point and the morphology of the obtained powder particles. Moreover, an inhomogeneous component distribution could develop during drying, which influences the final powder quality and product performance. We investigated the locking point, morphology and dried surface composition of dairy-based systems with different ratios of lactose, proteins and fat. Formulations dried under different conditions and with different oil droplet sizes were studied as well.
The presence of fat within the drying matrix reduces the moisture diffusivity, thereby resulting in an earlier locking point. With the applied drying conditions, other compositional changes, that is, the ratio of lactose and protein, the presence of different types of dairy proteins and the oil droplet size, did not influence the locking point. Changing the drying conditions, and hence the drying rate, resulted in small differences in the locking point, with earlier locking at higher air temperatures. However, the applied drying conditions did not lead to discernible morphological differences. For that, more extreme temperature conditions might need to be applied. The presence of fat within the matrix did not influence the morphology either. The ratios between lactose and protein, and between different types of protein, did influence the morphology of the dried particle, and could therefore be relevant to obtain desired powder quality. Systems high in lactose formed smoother particles, while high protein contents resulted in hollow particles. A High MCI content resulted in wrinkling, while a High WPI content resulted in smoother particles with a vacuole. Upon increasing the oil droplet size, the sessile droplet spreads out more on the hydrophobic surface, which can be attributed to the presence of surface fat.
Different components at the dried droplet's surface were detected with confocal Raman microscopy. Because of the large overlap in the Raman spectra of the pure components, peaks that are specific for individual components were used to identify the presence of the components. The obtained results were used to draw qualitative conclusions, but no quantitative data could be obtained with this technique. For most of the dried droplets investigated, the surface was composed of a mixture of lactose and proteins. This is desired since the presence of fat on the surface increases the level of lipid oxidation and promotes caking of the powder. Nonetheless, surface fat was detected for the samples high in fat and high in WPI. As the surface fat of the sample high in WPI could be related to the formation of a vacuole which may result in hole or crack formation, morphology development should be one of the focus points when developing a fat-containing spray-dried product.
Fat-free samples showed evidence of stratification of small components on the surface of the dried droplets. It is interesting to note that this observation, as well as some of our other results, were not always in line with earlier work (Nuzzo et al. 2017; Both et al. 2018). These authors focused on the surface composition of larger droplets dried at constant air temperatures. The differences that we obtained therefore indicate that the temperature–time trajectory is important for the surface composition, just as it is for the general drying behaviour and inactivation of heat-sensitive components (Eijkelboom et al. 2024). As the temperature–time trajectories applied in our work are more in line with realistic spray drying conditions, it is expected that these give a better indication of the surface composition of industrially spray-dried powders. Future research on the component segregation of multicomponent dairy systems at the pilot scale should be performed to verify this.
ACKNOWLEDGEMENTS
This work is an Institute for Sustainable Process Technology (ISPT) project, that is, StAggloP (Project number: DR-50-15). Partners in this project are Corbion, Danone, dsm-firmenich, FrieslandCampina, University of Hohenheim, Wageningen University & Research and ISPT. This project is co-funded with subsidy from the Topsector Energy by the Dutch Ministry of Economic Affairs and Climate Policy. We would like to thank Maurice Strubel for making the SEM images. The support of Arjen Bader to operate the confocal Raman Microscope and the discussion with Anna Fureby and Illia Dobryden on the analysis of the Raman data is highly appreciated.
CONFLICT OF INTEREST STATEMENT
All authors declare no potential conflict of interest related to the presented work.
AUTHOR CONTRIBUTIONS
NM Eijkelboom: Conceptualization; methodology; validation; investigation; visualization; formal analysis; writing – review and editing; writing – original draft. E Hooiveld: Methodology; investigation; writing – review and editing. J Kingma: Investigation; methodology. RM Boom: Conceptualization; supervision; writing – review and editing. PFC Wilms: Conceptualization; methodology; writing – review and editing; supervision. MAI Schutyser: Conceptualization; supervision; writing – review and editing; funding acquisition.
APPENDIX
Open Research
DATA AVAILABILITY STATEMENT
The data that support the findings of this study are available from the corresponding author upon reasonable request.


