Metabolic Mechanism of Osteogenic Differentiation of Bone Marrow Mesenchymal Stem Cell Regulated by Magnetoelectric Microenvironment
Abstract
Conventional methods to stimulate the metabolism of bone marrow mesenchymal stem cells (BMSCs) for osteogenic differentiation typically involve systemic mobilization, which faces challenges including limited in vivo half-life, lack of selectivity, and potential side-effects. Therefore, localized modulation of BMSCs represents a more efficient and safer alternative. However, few studies have explored the regulation of a localized stimuli-responsive microenvironment to activate osteogenic differentiation via mitochondrial pathways and clarified its underlying mechanisms. Herein, a novel strategy to accelerate the metabolic switch of BMSCs in tissue defects through targeted modulation using built-in magnetoelectric biomaterials is proposed. BMSCs cultured in the magnetoelectric microenvironment exhibited an increased mitochondrial membrane potential, the highest oxygen consumption rate and enhanced adenosine triphosphate production. Furthermore, BMSCs in the magnetoelectric microenvironment demonstrated a successful metabolic switch of energy resource from glycolysis to oxidative phosphorylation, indicating a strong tendency toward osteogenic differentiation. The highest multiclass metabolite profile, indicating the most active metabolic state, was shown in rats cranial defect model treated with magnetoelectric microenvironment. This research introduces a novel approach to accelerate bone defect repair by targeted modulation of BMSC mitochondria with magnetoelectric microenvironment and provides a promising direction for exploring the intrinsic mechanisms through which the magnetoelectric microenvironment promotes bone regeneration.
1 Introduction
Bone marrow mesenchymal stem cells (BMSCs) are drawing growing concern in tissue engineering because of their ease of isolation from bone marrow as well as expanding in vitro and the multiple differentiation potential.[1-3] Various methods have been explored to stimulate the metabolism of BMSCs to achieve osteogenic differentiation, including biological/pathological factors, chemical agents, and physical interventions.[4-8] The close interplay between cellular metabolism and BMSCs differentiation has been well-documented, proving that metabolic processes are crucial in determining the fate of these stem cells.[9] Metabolic pathways such as glycolysis and oxidative phosphorylation (OXPHOS) are tightly regulated during the differentiation process, and shifts in these pathways can significantly impact the cells’ osteogenic potential.[10] However, the methods mentioned above often involve systemic mobilization of factors, which presents several challenges. Systemic administration can lead to limited in vivo half lives of the factors, reducing their effectiveness over time.[11] Additionally, the lack of selectivity in targeting specific tissues or cells can result in off-target effects and potential side effects, complicating their clinical application.[12] Due to these challenges, there is increasing attention on the localized regulation of BMSCs metabolism. Targeting metabolic pathways within specific tissues or microenvironments may enhance the efficacy and safety of osteogenic differentiation strategies.
For BMSCs, the resource of energy supply is closely associated with differentiation.[13, 14] Recent researches have revealed that the process of osteogenic differentiation in stem cells is closely related to an increase in mitochondrial membrane potential (MMP).[15, 16] This rise in MMP is a critical indicator and initiating signal for the enhancement of mitochondrial activity, reflecting a shift in the cellular metabolic state. Studies have shown that the osteogenic differentiation of BMSCs required a metabolic switch from glycolysis to OXPHOS to meet energy needs.[17-19] Mitochondria, often referred to as the powerhouse of cells, are recognized as crucial sites where metabolic switch occurs.[13, 20] These organelles are not only responsible for producing the majority of cellular energy in the form of adenosine triphosphate (ATP) through OXPHOS, but also play pivotal roles in other cellular processes including the generation of reactive oxygen species (free radicals), the maintenance of calcium homeostasis, and the regulation of cell fate decisions, including apoptosis and differentiation.[13, 21] During the differentiation process, stem cells undergo a metabolic switch from glycolysis to OXPHOS, which is meticulously regulated by a cascade of key enzymes.[22] The activities of these enzymes are tightly controlled and any alteration in their function can significantly impact the metabolic pathway. Consequently, understanding these changes in enzyme activities may provide essential insights into the mechanisms underlying the metabolic switch during stem cell differentiation. However, limited studies have explored the regulation of osteogenic differentiation via mitochondria through localized stimuli-responsive microenvironments and clarified the underlying mechanisms.
Therefore, we proposed a novel tactic to accelerate mitochondrial metabolic switch of BMSCs in tissue defects by distinct targeted modulation of built-in magnetoelectrical CFO@BTO/P(VDF-TrFE) membranes, which have superior biocompatibility, flexibility, magnetic field response, and excellent osteogenic effect.[23-25] Changes of metabolic status during osteogenic differentiation of BMSCs cultured on magnetoelectric core–shell particle-incorporated composite membranes (CSCMs) were investigated (Figure 1), and it was discovered that the accomplishment of metabolic switch was achieved by triggering MMP. The metabolic switch was also proved by the changes of key enzymes’ expression from glycolysis to OXPHOS. In addition, the effect of the distinct targeted magnetoelectric microenvironment on activating the metabolism of BMSCs was also verified by metabolomics. Metabolites analyzed by omics were closely associated with the increased ATP production and enhanced MMP in the magnetoelectric microenvironment. This finding provides a new direction for exploring the mechanism by which the magnetoelectric microenvironment promotes bone regeneration.

2 Results and Discussion
2.1 Mitochondrial Membrane Potential (MMP, ΔΨm) Increased by the Localized Magnetoelectric Microenvironment
The construction of magnetoelectric microenvironment was realized by applying magnetic field to the magnetoelectric composite membranes. The external DC magnetic field was adjusted to the central magnetic field strength of 2300–2400 Oe.[26] The magnetoelectric composite material system was CoFe2O4(CFO)@BaTiO3(BTO)/poly(-vinylidene fluoridetrifluoroethylene) [P(VDF-TrFE)], a flexible membrane with good magnetic field responsiveness. The fabrication and characterization of membranes were shown in detail in our previous study.[23] Polarized CFO@BTO/P(VDF-TrFE) CSCMs with stable physicochemical properties (Figure S1a–f, Supporting Information), electrical properties (Figure S1h–j, Supporting Information), and high magnetoelectric conversion efficiency (Figure S1k–m, Supporting Information) were developed.
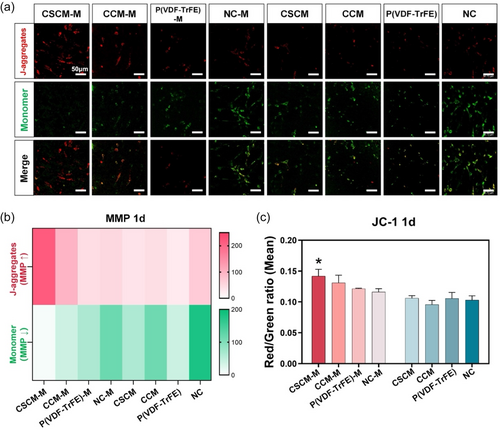
In order to investigate the level of MMP, BMSCs cultured on membrane surfaces were stained with JC-1 dye.[27] JC-1 dye is a potential-dependent sensitive marker which emits red fluorescence when MMP is increased and green fluorescence when MMP is decreased.[28] Results showed that the strongest red fluorescence was observed in the CSCM with magnetic field (CSCM-M) group after BMSCs were cultured on the membrane for 1 day both in laser confocal microscopy and in fluorescent intensity analysis (Figure 2a,b). Flow cytometry analysis confirmed the highest red/green ratio in the CSCM-M group (Figure 2c). These findings indicated the increased MMP in BMSCs in CSCM-M group. As the driving force for many mitochondrial behaviors, MMP reflects the functional metabolism through changes in the inner membrane potential caused by the accumulation and transport of different protons.[29] Many studies have proved the increase of MMP during differentiation into osteoblasts.[30-32] In other words, the magnetoelectric microenvironment promotes osteogenic differentiation for cells in CSCM-M group. The potential mechanism by which a magnetoelectric microenvironment influences MMP is through the alteration of RGD distribution on the cell membrane surface, which increases the expression of integrin α5/β1.[26] This, in turn, affects intracellular Ca2+ levels, a factor closely associated with changes in MMP.[33, 34] This may act as the “button” that triggers the subsequent cascade of enhanced mitochondrial metabolic activity, representing a potential mechanism by which the magnetoelectric microenvironment affects mitochondria.
2.2 OXPHOS and ATP Production Enhanced by the Localized Magnetoelectric Microenvironment
For the purpose of assessing the metabolic activity of BMSCs cultured on CSCMs regulated by magnetic field, their oxygen consumption rate (OCR) as well as the production of ATP were measured. As shown in Figure 3a, the highest OCR was observed in the CSCM-M group, along with the highest basal respiration (Figure 3c) and maximum respiration rates (Figure 3d), representing the energy requirements of cells under basal conditions and the maximum respiration rate that cells can achieve, respectively.[19] Moreover, no significant differences were found in proton leakage, spare respiratory capacity, and nonmitochondrial respiration (Figure 3f–h), which are important reference standards for the accuracy of the previous OCR measurements.[17, 19]
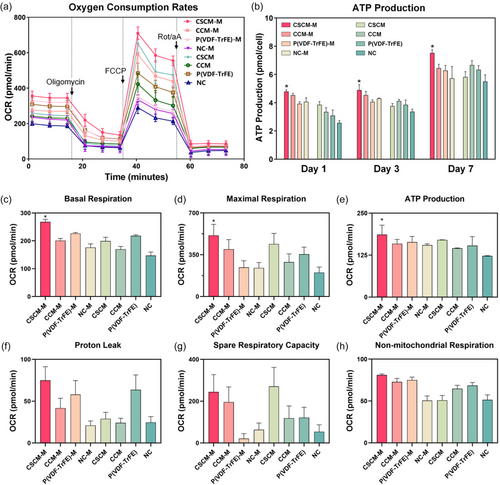
The ATP quantitative test showed that the ATP production of BMSCs in CSCM-M group increased on day 1, 3, and 7 and was significantly higher than in other groups (Figure 3b). Consistent with the previous OCR results (Figure 3e), it indicated that BMSCs in CSCM-M group had stronger aerobic respirations and were in a more active metabolic state.[35] It is well acknowledged that cell differentiation, matrix deposition, and nodule formation are all high energy-demanding processes.[14, 35, 36] Thus, the upregulation of OXPHOS occurring in mitochondria is of great importance to meet the large energy needs or to promote more biochemical reactions in the cell.
2.3 Metabolic Switch Accelerated by the Localized Magnetoelectric Microenvironment
Given our discovery of enhanced OXPHOS, it is reasonable to shift our focus to the transition in energy supply mechanisms. In this study, we explored this metabolic switch from a deeper perspective by examining the activity and expression of key enzymes in OXPHOS and glycolysis. Results confirmed that cells in CSCM-M group had the highest expression of OXPHOS key enzymes and the lowest expression of glycolytic enzymes after 7 days of culture (Figure 4a), indicating that the BMSCs in the CSCM-M group underwent the most pronounced metabolic switch, interpreted as having the most pronounced tendency toward osteogenic differentiation.[37] This phenomenon was more obvious in the heat map obtained from the gray value statistics (Figure 4b). These results also echoed the results of OCR and ATP production aforementioned.
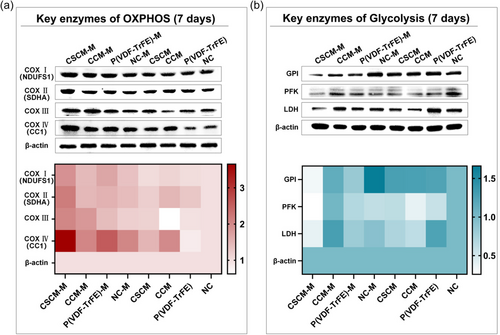
The metabolic switch refers to the change of energy source from glycolysis to OXPHOS in BMSCs, which is regarded as a landmark event in the metabolic process during the osteogenic differentiation of BMSCs. The occurrence of metabolic switch was considered as a reference standard to evaluate cell stemness and differentiation.[38] OXPHOS is accomplished by a precisely regulated cascade of electron transport chains (ETC) consisting of NADH coenzyme Q oxidoreductase (complex I, COX I), succinate - coenzyme Q oxidoreductase (COX II), panthenol - cytochrome c oxidoreductase (COX III), and cytochrome c oxidase (COX IV). Electron flow through the ETC establishes a proton gradient across the inner membrane used for F0F1ATPase (COX V) to drive ATP synthesis.[39] Key enzymes in glycolysis including glucose-6-phosphate isomerase (GPI), phosphofructokinase (PFK), and lactate dehydrogenase (LDH) also changed significantly in a downward tendency (Figure 4b). Our results conclusively demonstrated that the built-in magnetoelectric biomaterials regulate osteogenic differentiation of BMSCs by accelerating metabolic switch. Numerous studies corroborate our findings. Forni et al. found that during osteogenic induction, the levels of citrate synthase, a key enzyme in OXPHOS, increased while the expression of glycolytic enzymes and the production of lactate decreased.[40] Meanwhile, it has been found that ATP in differentiated cells is more sensitive to inhibition of OXPHOS, while ATP in undifferentiated cells is sensitive to inhibition of glycolysis, which also confirms our findings on metabolic switch.[39]
2.4 Metabolomics to Detect the Metabolic Activation of Magnetoelectric Microenvironment In Vivo
Unlike regulation at cell level in vitro, in vivo detection can better reflect the actual response of cells in defect area to the regulation of the localized magnetoelectric microenvironment. Metabolites, on the other hand, are a more realistic reflection of the cell's environment, which is closely connected to the metabolic status, differentiation activities, drug response, and influence of other external factors on the cell.[41, 42] Therefore, metabolomics were examined to reflect the collection of metabolites in vivo. Tissues from the cranial defect area of rats 7 days after material implantation were collected and metabolomic assays were performed. The metabolite heat map showed that the CSCM-M group possessed the highest amounts of metabolites across all components, including amino acids, organic acids, nucleotides, and their metabolites (Figure 5a). Among these, metabolites from different classes were selected to present in the violin diagrams, including guanosine-5′-diphosphate (GDP), uric acid, phe-hyp, and glycerol-tributyrate (Figure 5e). GDP is interconverted by GTP and ATP and also a product in the tricarboxylic acid cycle.[43-45] Additionally, it has been revealed that the effect of GDP is closely associated with MMP, as being able to enhance the MMP inhibited by drugs.[45, 46] The metabolomic results of GDP not only corroborate the experimental findings of enhanced aerobic respiration in BMSCs but also support our hypothesis regarding the pathway through which the magnetoelectric microenvironment influences MMP. Uric acid is a product of the step-by-step metabolism of ATP into adenine and its subsequent decomposition.[47] The uplift represents the increased ATP production and high ATP utilization of BMSCs regulated by the magnetoelectric microenvironment. Moreover, Phe-Hyp, a product of collagen hydrolysis,[48] and glycerol-tributyrate, an intermediate product of fat metabolism,[49] as distinct metabolites, indicate enhanced intracellular metabolic activity.
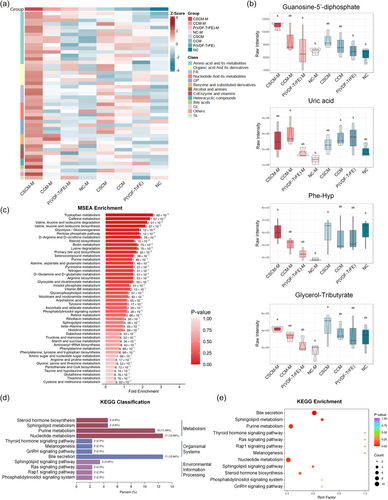
MSEA and KEGG enrichment analysis also highlighted metabolites in various organic metabolic pathways such as sphingolipid metabolism, purine metabolism, and nucleotide metabolism (Figure 5b–d). In the cranial defect model, the bone defect area after material implantation exhibited a distinct metabolomic profile, indicating that the cells in the defect area of the CSCMs with an applied magnetic field had the highest levels of multiclass metabolites and the most active metabolic state.
3 Conclusion
In this study, we demonstrated a novel approach to promote bone defect repair by targeted modulation of mitochondria in BMSCs using the magnetoelectric microenvironment created by a built-in magnetoelectric membrane. This localized and targeted mitochondrial activation was achieved by enhancing MMP to trigger a metabolic switch in BMSCs, with the energy source changing from glycolysis to OXPHOS, accompanied by enhanced aerobic respiration and increased ATP production. In vivo experiments also exhibited an increase of metabolic activity in the defect area, thus specifically accelerating the repair of bone defects. This study explored the intrinsic mechanism by which the magnetoelectric microenvironment regulates osteogenesis from the perspective of cellular energy metabolism, providing new insights for future research on the mechanisms by which biomaterials accelerate cellular osteogenic differentiation. In future researches, a metabolite timeline regulated by magnetoelectric microenvironment in time sequence needs to be further explored. The spatiotemporal metabolic profiles of different kinds of cells in bone defect area regulated by magnetoelectric microenvironment could be mapped.
4 Experimental Section
Fabrication of the CFO@BTO/P(VDF-TrFE) Membranes
The fabrication of the CFO@BTO/P(VDF-TrFE) membranes was prepared according to our previous study.[23] Generally speaking, CFO nanoparticles (Nanostructured & Amorphous Materials Inc, USA) were modified with sodium oleate (Aladdin, Shanghai, China). Tetrabutyl titanate (Sigma-Aldrich, MO, USA) was dissolved and the modified nanoparticles were dispersed in anhydrous ethanol (Aladdin, Shanghai, China). Then barium acetate (Aladdin, Shanghai, China) was added during ultrasonic stirring, and the pH was adjusted to 3–4 by slowly adding acetic acid (Macklin Biochemical Co., Shanghai, China). The solution was stirred at 60 °C in water bath into sol, and 90 °C into gel, which was fully dried in an oven at 120 °C and ground into powder. After that, the powder was treated at 500 °C for 6 h. Then it was baked in a muffle oven at 800 °C for 2 h to obtain CFO@BTO core–shell nanoparticles. The nanoparticles were then added to dimethylformamide (DMF, Sigma, MO, USA) following treatment with an ultrasonic crusher for 1 h and then P(VDF-TrFE) powder ((70/30 mol % VDF/TrFE), Arkem, French) was added. The solution was dispersed by mechanical comixing and ultrasonic techniques. The mixed solution was smeared on the glass substrate, dried at 55 °C for 12 h, and annealed at 120 °C for crystallization. The membranes were corona polarized for 60 min in a 15 kV DC electric field at room temperature. 10 wt% CFO/P(VDF-TrFE) membranes were prepared and characterized in the same way as described previously.[23]
Cell Culture
Rat BM-MSCs (Cyagen Bioscience Inc., China) were cultured in α-MEM (HyClone, USA) with 10% (v/v) fetal bovine serum (Gibco, USA) and 1% (v/v) penicillin-streptomycin solution (Gibco, USA) within a cell culture incubator under standard conditions (37 °C, 5% CO2). The culture medium was refreshed every 2 days. Cells of experimental groups were cultured on the surface of CSCM and placed in a magnetic field constructed by two magnets with a magnetic field intensity of 2300–2400 Oe.
Mitochondrial Membrane Potential Detection
Laser confocal microscopy observation: BMSCs were inoculated on each group of materials and blank culture plates. After 1-day culture, JC-1 staining working solution with a concentration of 10 μg mL−1 was configured according to the kit instructions (Solarbio, Beijing, China) and shaken vigorously to dissolve and mix it well. The medium was removed from plates, washed 2–3 times with phosphate-buffered saline (PBS), 1 mL of complete medium was added, 1 mL of staining solution was added to each well and mixed thoroughly, incubated for 30 min at 37 °C, and protected from light. The staining solution was removed, washed 2–3 times with PBS, cell culture medium was added and store away from light. Then it was observed by laser confocal microscopy (Leica, Germany). When detecting JC-1 monomer, the green fluorescence channel was set to excitation light wavelength at 490 nm and emission light at 530 nm; when detecting JC-1 polymer, the red fluorescence channel was set to excitation light at 525 nm and emission light at 590 nm.
Flow cytometry analysis: BMSCs were inoculated on each group of materials and blank culture plates. After 1-day incubation, each group of cells was digested with trypsin, centrifuged at 1000 rpm for 5 min, resuspended in 0.5 mL complete medium, 0.5 mL JC-1 staining solution was added, and mixed upside down several times. JC-1 washing buffer was prepared on ice. After 37 °C incubation for 30 min, it was centrifuged at 4 °C for 3–4 min at 600 g and the supernatant was discared. 1 mL of JC-1 washing buffer was added, the cells were resuspended for washing, centrifuged at 4 °C, 600 g for 3–4 min, and repeatedly washed 2 times. After final resuspension with the appropriate amount of JC-1 washing buffer, flow cytometry (Becton Dickinson, BD, USA) analysis was performed within 30 min of probe loading. Samples needed to be stored in an ice bath avoiding light. The green fluorescence for flow analysis was set referring to FITC and the red fluorescence was set referring to Cy3.
Measurement of Oxygen Consumption Rate of BMSCs
The rBMSCs were inoculated on each group of materials and blank culture plates. After 24 h of incubation, cells were digested with trypsin and cell density was measured. Cells were inoculated on Seahorse-specific culture plates (Agilent, USA) at a density of 10 000 cells/well, ensuring that the four background wells were blank. The probe of the testing well plate overnight was hydrated before the assay. 1 g L−1 glucose, 1 mM sodium pyruvate, and 2 mM glutamine to the XF basal medium were added according to the instructions and the pH was adjusted to 7.3–7.4. The Seahorse cell culture plates was diluted with the assay medium. The plates were placed in a CO2-free incubator at 37 °C for 1 h. The OCR was measured in a Seahorse XFe-96 analyzer (Agilent, USA), and the mitochondrial stress kit (Agilent, USA) containing mitochondrial respiration inhibitors (1.0 μM oligomycin, 1.0 μM FCCP, 0.5 μM antimycin A, and rotenone) was used to determine the OCR before and after each stage of the inhibitors respectively. Basal respiration, maximal respiration, ATP production capacity, proton leak, spare respiratory capacity, and nonmitochondrial respiration were calculated. All results were compared using the normalized number of cells counted per well after the assay.
Measurement of Cellular ATP Production
The rBMSCs were inoculated on each group of materials and blank culture plates. After 1, 3, and 7 days of incubation, the original medium was removed, and the cells were lysed by adding cell lysis solution (Beyotime, Shanghai, China) and centrifuged at 12 000 rpm for 5 min at 4 °C, after which the supernatant was harvested. ATP assay working solution (Perkin Elmer, USA) was prepared at a ratio of 1:9 (v/v) and placed on ice. 100 μL ATP assay working solution was added to the 96-well plate and left at room temperature for 3–5 min to deplete the background ATP. 20 μL sample was added to the wells, shook for 1 min with a horizontal well plate shaker, and then the RLU values were examined with a luminometer (Thermo Fisher Scientific, USA).
Western Blot
Total protein was extracted from cells with radio immunoprecipitation assay (RIPA) lysate (Beyotime, Shanghai, China) mixed with protease inhibitor (Thermo Fisher Scientific, USA), and the protein concentration was determined. The whole experiment was carried out on ice. The protein concentration in each sample was determined using a BCA protein assay kit (Thermo Fisher Scientific, USA). 6× SDS protein loading buffer (Beyotime, Shanghai, China) was added to each group of proteins and heated at 100 °C for 5 min to denature the proteins. The total protein was then isolated by electrophoresis in 10% (v/v) SDS-PAGE gel. The isolated proteins were then transferred to PVDF membrane, blocked with 5% (w/v) skim milk, and incubated with primary antibody at 4 °C overnight. The membrane was then rinsed three times with 1× tris-buffered brine/Tween 20 (TBST), followed by incubation with the second antibody linked to horseradish peroxidase (HRP) at room temperature for 1 h. Protein strips were exposed in the ChemiDoc Imager (Bio-Rad, Shanghai, China) after treating with an eECL Western Blot kit (CoWin Bio., Jiangsu, China).
The primary antibody anti-NDUFS1 (PA5-22309, Invitrogen, CA, USA),anti-CC1 (PA5-51550, Invitrogen, CA, USA), was purchased from ThermoFisher Scientific, USA. Anti-SDHA (ab14715) and anti-COX III (ab37269) was purchased from Abcam. Anti-GPI (sc-365066), anti-PFK (sc-377346), and anti-LDH (sc-133123) were purchased from Santa Cruz Biotechnology. The primary antibody anti-β-actin (AF0003) and secondary antibody HRP-labeled IgG (A0208) were purchased from Beyotime, China. β-actin was used as an internal control. Protein expression levels were analyzed using Image J software.
Animal Experiments and Tissue Collection for Metabolomics Assays
Seven-week-old male Sprague Dawley (SD) rats were used in this study. The experimental protocol was approved by the Animal Protection and Use Committee of Peking University (PUIRB No.: LA2023411). Surgery procedure: Rats were anesthetized by intraperitoneal injection of sodium pentobarbital at a dose of 100 mg kg−1. The operative area was debried, disinfected with iodophor, and local anesthesia was performed with parietal injection of lidocaine. An operative incision of 2–3 cm in length was made on the midline of the rat's cranial vault and then peeled off the periosteum to expose the bone surface of the calvarium. Two circular full-thickness cranial defects of 5 mm in diameter on the left and right sides of the center joint were prepared. The operation area was flushed with physiological saline and the bone debris was aspirated. The corresponding materials were implanted to cover the left and right defects according to the groups. The wound was sutured layer by layer. Penicillin was injected intramuscularly into the hind limbs, and the rats were put on a 37 °C thermostatic table to resuscitate. After 7 days of feeding, SD rats in each group were euthanized, and tissues in defect area of the skull were collected and rapidly placed in liquid nitrogen for cryopreservation for metabolomics assays.
All subsequent operations were required to be performed on ice. Samples were thawed, chopped and mixed, and about 20 mg was weighed at multiple points and added to the numbered tubes. Samples were homogenized for 20 s on a ball mill and centrifuged at 3000 r min−1 for 30 s at 4 °C. After centrifugation, 400 μL of 70% methanol water internal standard extract was added, shaken at 1500 r min−1 for 5 min, and allowed to settle on ice for 15 min. After centrifugation at 12 000 r min−1 for 10 min at 4 °C, 300 μL of the supernatant was transferred to another corresponding tube and then placed in the refrigerator at −20 °C for 30 min. The product was centrifuged at 12 000 r min−1 for another 3 min at 4 °C, and then the supernatant was transferred to another numbered tube. After centrifugation at 12 000 r min−1 for 3 min at 4 °C, 200 μL of the supernatant was pipetted into the corresponding injection bottle for on-machine analysis.
Group Instruction:
Group 1: left defect covering CSCM, right defect covering CCM.
Group 2: left defect covering CSCM, right defect covering polarized P(VDF-TrFE) membrane.
Group 3: left defect covering CCM and right defect not covered as negative control.
Groups 4–6 had the same material coverage as groups 1–3. Groups 1–3 were fed in custom-made magnet cages and cycled for 12 h per day. Groups 4–6 were fed in conventional cages.
Statistical Analysis
SPSS 20.0 statistical software was used for statistical analysis. Quantitative numerical results were expressed as mean ± standard error of the mean (mean ± SEM). One-way analysis of variance (ANOVA) test and Student–Newman–Keuls posthoc multiple comparison method were used to calculate the differences between groups. P < 0.05 indicates statistical significance, and P < 0.01 indicates statistically significant differences.
Acknowledgements
This work was supported by the National Natural Science Foundation of China (U22A20314, 82471029, and 81600905), the China Postdoctoral Science Foundation (2023M740141), the Peking University Medicine Fund of Fostering Young Scholars’ Scientific & Technological Innovation supported by the Fundamental Research Funds for the Central Universities (BMU2018PY005), and the National Key Research and Development Program of China (2018YFE0194400).
Conflict of Interest
The authors declare no conflict of interest.
Author Contributions
Han Zhao: Conceptualization (lead); Data curation (lead); Formal analysis (lead); Investigation (lead); Methodology (lead); Writing—original draft (equal); Writing—review & editing (equal). Fangyu Zhu: Data curation (supporting); Formal analysis (supporting); Investigation (supporting); Writing—original draft (equal); Writing—review & editing (equal). Yusi Guo: Data curation (supporting); Methodology (supporting). Xuliang Deng: Conceptualization (lead); Funding acquisition (lead); Project administration (lead). Wenwen Liu: Conceptualization (lead); Funding acquisition (lead); Project administration (lead); Writing—review & editing (lead). Han Zhao and Fangyu Zhu contributed equally to this work.
Open Research
Data Availability Statement
The data that support the findings of this study are available from the corresponding author upon reasonable request.


