Characterization of Nonmetallic Inclusions in Low-Alloyed Steels Using Pulse Distribution Analysis Optical Emission Spectroscopy and Offline Investigation Methods
Abstract
The characteristics of nonmetallic inclusions (NMIs) in low-alloyed steel samples taken during ladle treatment before and after Ca treatment are evaluated using the pulse distribution analysis optical emission spectroscopy (PDA/OES) method, INCA-Feature investigations of inclusions on a polished surface of steel samples, and 3D investigations of NMIs after electrolytic extraction (EE) of steel samples. The investigation results of NMIs using the different methods were compared. The PDA/OES results show a clear tendency of a change in the average composition and quantity of NMIs during ladle treatment, which correlates well with the results obtained from the other two methods. Overall, it is found that the application of the PDA/OES method is appropriate to enable a fast online evaluation of inclusion compositions and their behaviors during steelmaking. This, in turn, provides the means for establishing an online control and correction of technological operations of the ladle treatment to implement necessary modification of NMIs to improve the cleanliness of steels and avoid clogging problems during casting.
1 Introduction
Nonmetallic inclusions (NMIs) can play a very harmful role with respect to the quality of steel. Here, an unacceptable control of NMIs during steelmaking can cause several problems during the process, such as clogging of nozzles during the casting, as well as having detrimental effects on the final steel products (such as adverse effects on mechanical properties and worse corrosion properties). In the last decades, several methods of offline investigations, such as light optical microscopy (LOM), scanning electron microscopy (SEM), the automatic software INCA-Feature and ASPEX, chemical extraction (CE), and electrolytic extraction (EE), have been developed to study the characteristics of NMIs.[1-9] However, the investigation results could only be obtained after several hours, days, or even months. It means that no efforts could be made online directly during the process, based on the investigation results. Thus, a quick and reliable online analytical feedback technique for the characterization of NMIs for process control is needed.
During the last decades, several rapid methods for the evaluation of NMIs based on the existing online composition analysis techniques have been developed. This includes, for example, laser ablation–inductively coupled plasma–mass spectrometry (LA-ICP-MS) method, the pulse distribution analysis by optical emission spectroscopy method (PDA/OES), and the laser-induced breakdown spectroscopy (LIBS) method.[10] Among them, the PDA/OES method represents one method that can provide online investigations of NMIs in steel samples. Initially, a novel technology use of spark OES was presented by J.Ono in 1978, which enabled an integration of the sequence of single sparks followed by a statistical analysis of the spark data, termed PDA.[11] First, this method was used to improve the precision of OES results of bulk composition determinations. However, it was soon discovered that the data obtained from PDA also contain information about NMIs. The method gives a high possibility for a rapid screening of the NMI content because the measurements can be obtained within a time from several seconds to minutes.[12]
Table 1 summarizes several studies[13-20] that have studied the reliability of PDA/OES methods for characterization of NMIs from the aspects of sampling methods, the accuracy of inclusion sizes, evaluation of total oxygen contents, the amount of inclusion described by an inclusion index, and the estimation of inclusion densities. The results from PDA/OES determinations, such as the size, number, total oxygen content (TOC), and insoluble part (B factor), have been compared with the results from combustion methods (including LECO carbon analyzer), wet chemistry methods, LOM, scanning electron microscopy SEM, and EE. Overall, the results from previous investigations show that a good correlation can be found between PDA/OES determinations and the results from other investigation methods.
| Author [Reference] | Year | Steel grade | Comparing method | Information of NMIs | Special aspects |
|---|---|---|---|---|---|
| Muroi et al.[13] | 2006 | Bearing steel | LOM | Size, number | Make calibration of PDA/OES with an electron probe analysis (EPMA) |
| Assume burned part of particles in one spark as a cylinder with a fixed height | |||||
| Pissenberger et al.[14] | 2007 | Low-carbon steel | Number | Checked the repeatability of PDA/OES | |
| Found the possibility for statistical calculations of a large number of data sets | |||||
| Didriksson et al.[15] | 2011 | Not mentioned | An explanation of software for evaluation of PDA/OES data | ||
| Ebri et al.[16] | 2016 |
Low-C, medium-C Microalloyed |
SEM | TOC, Inclusion index | Divide NMIs in oxides and sulfides during analysis by PDA/OES |
| The inclusion index is calculated by the sum of the products of the number and the average diameter of inclusions | |||||
| Louhenkilpi et al.[17] | 2018 | Not mentioned | LECO | TOC, size distributions, composition | NMI amount and composition were calculated by TOC from PDA/OES and thermodynamic calculations |
| Only offline versions were tested | |||||
| Runnsjö et al.[18] | 2011 | Nine grades from low-alloyed to high-alloyed | SEM-EDS combustion method, wet chemistry | TOC, B factor | An evaluation of reference materials for calibration of PDA/OES |
| It is important to optimize the calibration function before testing a new grade. | |||||
| Good correlations of TOC (in the range from 10 to 40 ppm) | |||||
| Pande[19] | 2011 | Ultra-low-carbon steel | A comparison of different statistical algorithms of insoluble elements | ||
| Janis et al.[20] | 2015 | Two low-alloyed steels | EE | Size distributions, Volume Fraction, Average composition | Good agreements of inclusion numbers between PDA/OES and EE in the middle size range (1.4–5.7 μm) were obtained |
| Minimum detected sizes of Al2O3-containing inclusions depend on the content of Al2O3 in NMIs as well as the content of Al in the steel |
With respect to the practical applications of PDA/OES, Pande et al.[21] investigated the number of Al-based inclusions at the end of the recirculation degassing period using an oxygen top lance (RH-OB) during the production of ultra-low-carbon steels to evaluate the influence of ferroalloy impurities and ferroalloy addition sequences on the inclusion characteristics. Egger et al.[22] found that the use of the PDA/OES technology made it possible to detect a clear change of the Mg content in inclusions during CaSi wire additions, soft-bubbling treatments, and tundish operations. These changes could not be detected by using an automated raster electron microscope equipped with an energy-dispersive X-ray (REM-EDX) inclusion analysis system (PSEM). Also, Krebs et al.[23] showed the possibility of using the PDA/OES method to predict the macrocleanliness of the solid products from continuous casting by detecting Mg outliers. In addition, Janis et al.[24] suggested that it is possible to predict the risk of slivers in the final rolled products using the B factor of Al (corresponding to the mass fraction of Al bound to nonmetallic inclusions) obtained from the PDA/OES measurements in samples taken from the ladle and tundish. However, it was also suggested that it is not recommended to directly compare individual inclusions compositions in ternary diagrams using data from PDA/OES and INCA-Feature determinations. It was found that inclusions containing several elements (such as Al2O3, CaO, and MgO) may be classified into groups containing only one or two elements from the real composition using PDA/OES determinations. As different realities of the inclusion situation may be obtained using the PDA/OES and SEM methods, the results obtained from these two methods should not be compared individually in the ternary diagram. Instead, the B factor, the total mass percentage of a specific element present in inclusions, was suggested as being a suitable parameter to use for process control of the inclusion composition. However, more studies using the PDA/OES method were deemed to be necessary to study the potential applications of using the B-factor results in different parts of the steelmaking process.
This study is focused on the evaluation of the possibility of using the PDA/OES technique for the characterization of NMIs in low-alloyed steels both before and after Ca treatment during ladle treatment. The B factors of different elements were determined for samples taken from the steelmaking process using the PDA/OES method. The results were also compared with results obtained from using the conventional 2D INCA-Feature method and 3D investigations using the EE method. Moreover, a systematic analysis of inclusion compositions obtained by PDA/OES in industrial steel samples taken from the tundish was used for evaluation of clogging risk during casting.
2 Experimental Section
2.1 Industrial-Scale Sampling
Table 2 gives the main composition of the two industrial low-alloyed steel grades studied in this research. Ten samples obtained from different stages of the steelmaking process of grade A were taken and investigated by using the PDA/OES method, as shown in Figure 1. Specifically, samples were taken from the LD converter (basic oxygen furnace, sample S1), the Thyssen Niederrhein (TN) desulfurization process (sample S2), during ladle treatment with vacuum degassing (samples S3–S8), and in a tundish during casting (samples S9 and S10). In the ladle, six samples in total were taken from the steel melt: two samples were taken before (S3) and after (S4) vacuum treatment and four samples were taken after the Ca addition (S5–S8) with a 5 min interval. Finally, two samples were taken from the tundish: one sample was taken after casting 25 tons of melt (S9) and another was taken when 25 tons of melt was left to be cast (S10). For grade B, only two samples were taken from the tundish in the same way to study if the results from the PDA/OES method could be used as an indication to detect a tendency for clogging.
| Grade | C | Si | Mn | Cr | Al | Ca | S |
|---|---|---|---|---|---|---|---|
| A | 0.13 | 0.25 | 1.3 | 0.40 | 0.06 | <0.003 | 0.002 |
| B | 0.07 | 0.05 | 1.3 | 0.09 | 0.04 | <0.003 | 0.002 |

2.2 Characterization of NMIs
2.2.1 PDA/OES Determinations
The principle of the PDA/OES method is shown schematically in Figure 2. Here, sparks caused by the electrode will excite atoms and ions in the discharge plasma during the ablation of the material. Then, the elevated electrons will jump back to a stable level and emit light with specific wavelengths for different elements. These light intensities could be analyzed using a photomultiplier after a diffraction grating in the spectrometer. According to the light intensity and special calibration functions, the mass percentage of different elements is determined in the computer. The mass of elements that are not determined using OES (e.g., O and N) during the production process can also be estimated according to stoichiometric ratios for oxygen or nitride inclusions. The results of PDA/OES measurements can provide a range of inclusion characteristics, such as the inclusion size, total oxygen content, concentration of insoluble elements presented in NMIs, and inclusion density.[13, 14, 16, 17, 20] Previous works[15, 20] have described the typical calculation procedures widely used in some Swedish companies.

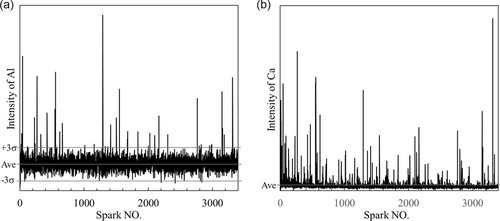
There are mainly two statistical algorithms to determine the soluble and insoluble elements, based on the spark intensities. The first method is based on the assumption that if the element is homogeneously distributed within the sample, the single spark intensity distribution should approximately match a Gaussian function.[19] Here, the insoluble part will contribute to the high-intensity sparks outside the Gaussian distribution. Another method is based on a direct use of the ground signals. The abnormal high signals (outliers) are detected when the intensity corresponds to a certain number of standard deviations (usually use 3σ) larger than the intensities corresponding to the metallic background.[24] The σ value is determined by using special iterative calculations. Figure 3 shows typical intensity distributions obtained in the given study from PDA/OES measurements (which are also called “pulsograms”) of the Al and Ca contents in a sample. These abnormal high signals (outliers) are related to inclusions containing the given elements. Specifically, inclusion types can be decided based on coincidences of outliers detected in single sparks. For example, if a Ca outlier and an Al outlier both exist for the same spark number, that particular NMI includes both Al and Ca. Based on this information, the weight, size, number, and composition of NMIs can be quantified by the software.
In this study, all samples were investigated using the ARL iSpark spectrometer and analyzed by the company's developed software. Two to three spots were measured on each sample. For each spot, 3000 sparks (78 ng ablated mass per spark) were performed per sample. The first 500 sparks were discarded to avoid the effect of any contaminations present on the sample surface. Specifically, the B-factor values of Ca and Al calculated from all the detected outliers, which present the mass percentage of specific elements in all detected inclusions, were determined.
2.2.2 Electrolytic Extraction Method (EE + SEM)
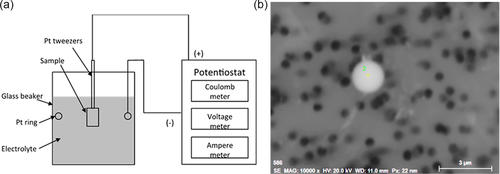
The characteristics of NMIs in samples S4, S6, and S8 were evaluated using the EE method. Figure 4 shows a schematic diagram of the EE equipment (a) and a typical oxide inclusion found on the filter after a completed electrolytic extraction and a filtration of the electrolyte (b). During the extraction, the steel matrix was easily dissolved using an electrical current, whereas nonmetallic inclusions are undissolvable in the selected electrolytes. Specifically, the electrolytic extraction process was conducted using a nonaqueous electrolyte, namely, a 10% AA (10% acetylacetone–1% tetramethylammonium chloride–methanol) electrolyte. The following electric parameter settings were applied for the extraction: a voltage of 3.1–4.0 V, a current of 40–60 mA, and an electric charge of 500 C. The weight of the dissolved metal was around 0.11 g. After the filtration with a membrane polycarbonate film filter with an open-pore size of 0.4 μm, the inclusions were collected on the filter. Thereafter, they were investigated using a scanning electron microscope equipped with EDS.
2.2.3 INCA-Feature Method
3 Results and Discussions
3.1 Characterization of NMIs in the Steel Samples
Among the three investigation methods of NMIs utilized in this study, only the EE + SEM method can obtain clear results showing the morphology of inclusions. The INCA-Feature method only gives a rough estimation of the shape of inclusions based on the aspect ratio values, whereas the PDA/OES method gives no information regarding the morphology. To illustrate some studied morphologies, some SEM images of typical inclusions obtained after using the EE method are shown in Figure 5.
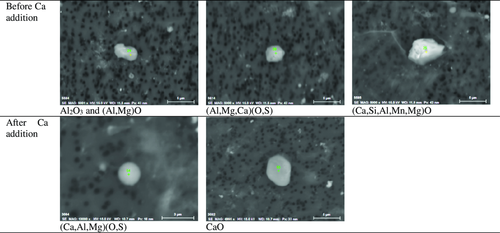
In the liquid steel sample taken before a Ca addition (S4), Al2O3 and (Al, Mg)O) inclusions with an irregular shape, complex inclusions containing (Ca, Si, Al, Mn, Mg)O and (Al, Mg, Ca)O, and a small amount of CaO were observed using the EE + SEM method. For the (Al, Mg, Ca)O inclusions investigated in sample S4, a low CaO content (≈10–40%) was detected. The source of CaO is most likely the slag, which may also explain the existence of the inclusions with a high CaO content, such as (Ca, Si, Al, Mn, Mg)O inclusions. When it comes to the samples taken after a Ca addition (S6 and S8), no (Al, Mg)O inclusions were found anymore. Instead, most inclusions were found to contain (Ca, Al, Mg)O or (Ca, Al, Mg)(O, S). The CaO content in these inclusions (≈35–65%) is much higher than that in the (Al, Mg, Ca)O inclusions in sample S4 taken before the calcium treatment. Samples S6 and S8 also contained some pure CaO inclusions.
Though the compositions of NMIs listed in Figure 5 were quite different, the majority of the NMIs contain Al, Mg, Ca, O, and S, which can be presented in a (CaO + CaS)Al2O3MgO ternary phase diagram. The compositions of typical inclusions (Al2O3MgO and Al2O3MgOCaOCaS) investigated using the INCA-Feature method and using SEM/EDS after a completed EE process (EE + SEM) are shown in Figure 6 for a sample taken before (S4) and after (S6, S8) a Ca treatment. In this study, the minimum sizes of inclusions investigated using the INCA-Feature and EE methods were 2 and 1 μm, respectively. The total number of analyzed inclusions was varied in different steel samples (≈50–100 and 15–25 inclusions per sample by analysis using the INCA-Feature and EE methods, respectively). The results show a similar tendency that the prominent inclusions changed from the Al2O3MgO phase in sample S4 (Figure 6a,b) to the liquid phase (the gray area corresponds to the liquid inclusions at 1600 °C from the Al2O3CaOMgO ternary diagram) of Al2O3CaOCaS in sample S6 (Figure 6c,d) and S8 (Figure 6e,f).
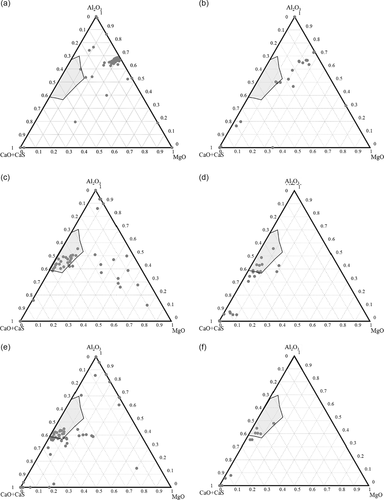
From the results obtained using the INCA-Feature method, four main groups of inclusions were detected, namely, pure Al2O3 inclusions (type A), Al2O3MgO inclusions (type B), Al2O3CaOCaS inclusions (type C), and CaOCaS inclusions (type D). When inclusions were investigated using the EE + SEM method, type A, type B, and a tiny amount of type C inclusions were observed in sample S4 taken before the Ca addition. However, only Ca-modified inclusions (type C and type D) were observed on the film filters of samples S6 and S8 taken after the Ca addition. In contrast, a non-negligible amount of type B inclusions was detected in sample S6 using the INCA-Feature technique. Furthermore, the compositions determined using the SEM after a completed EE process show a higher content of CaO (around 5–10% on average for different samples) compared to the result determined using the INCA-Feature technique. These differences were caused by different conditions in these two investigation methods. On one hand, when inclusions are investigated on the cross-section of metals (2D method, INCA-Feature), the Al dissolved in the metal matrix can increase the Al signal in analyzed inclusions. This is especially common during the analysis of inclusions smaller than 6 μm, as discussed in previous studies.[6] On the other hand, when a whole inclusion (>2 μm) is investigated on the filter using EDS (3D method, EE + SEM), mainly the outer layer, which can have higher CaO content, is analyzed.
When partly modified inclusions were investigated, such as the inclusion containing a solid core (Al2O3MgO) and a liquid or semiliquid shell containing a high CaO content, the 2D method will mostly provide information of the core part of an inclusion. In contrast, the 3D method will mostly give information about the liquid shell of an inclusion. Consequently, higher contents of Al2O3 and MgO can be obtained during the determination of inclusion compositions using the 2D method. In contrast, higher CaO or CaO + CaS contents can be obtained using the EE + SEM method. Thus, the EE + SEM method will give more information about how many inclusions are liquid or containing semi-liquid surface layers. The INCA-Feature method can determine the phases present in the core part of a selected inclusion as well as the amount of partially modified and totally modified inclusions.
3.2 Sample Qualities for PDA/OES Analysis
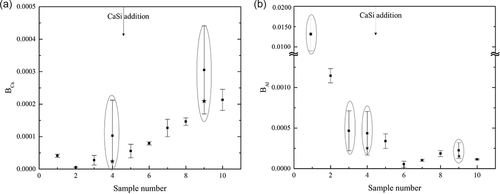
In this study, ten lollipop samples from different stages of the steelmaking process of industrial low-alloyed steels were taken and investigated using the PDA/OES technique. Two to three PDA/OES measurements were performed on each sample. Based on the algorithm used by the software, the B factors of Ca and Al in steel samples were determined. The obtained results are shown in Figure 7. The relative standard deviations (RSD) of the B factors of Ca and Al vary from 1% up to 128% and from 6% up to 204%, respectively. The deviations of BCa in most samples are less than 40%. In contrast, the results for BAl show much larger deviations, with four samples having larger deviations than 40%. The results showed enormous RSD values, which are marked by the ovals in Figure 7. It indicates that this fact is probably due to the sampling itself (the sample may contain slag droplets, which should be excluded from the analysis of results according to a previous study[17]), the sampling preparation, or the heterogeneous distribution of large-sized NMIs in samples. The large deviation might lead to a misunderstanding of the situation of inclusions. In this study, the abnormal extra-large results (the ones which were significantly larger compared to other two spots analyses) were removed from calculations for the S4 and S9 samples and acceptable values for these samples were added as shown by stars in the figures.
3.3 Process Control of Ca Treatment Based on PDA/OES Determinations
Janis et al.[20] reported that the minimum size of an inclusion (AxOy) detected using PDA/OES measurements depends on the content of the given element dissolved in the metal matrix (%A) and the concentration of the corresponding oxide in this inclusion (%AxOy). For elements with low dissolved contents in steel, such as Ca and Mg, very small pure particles or phases in complex inclusions can easily be detected, as shown in Figure 3b. However, for elements having relatively high soluble contents in the metal matrix, such as Al and Si, small-size inclusions cannot be detected.
In this case, the intensity peaks of small-size particles in a pulsogram cannot be distinguished from the variation of ground signals of the soluble elements in the metal matrix, as shown in Figure 3a. As a result, the number of detected small-size pure particles can be underestimated.[25] Moreover, this can cause some errors in the determination of complex inclusions. If the normalized contents of some elements in the inclusions are low, these elements may not be detected as a part of these complex inclusions at relatively high soluble concentrations of these elements in the metal matrix. As a result, the inclusion composition determined by PDA/OES will not be precise, and the size of this complex inclusion will be underestimated as well. Therefore, it is difficult to obtain the correct compositions of each individual inclusion using the PDA/OES technique as the SEM-EDS method. However, the compositions and size of large-sized inclusions, which are more important from the steelmaking point of view, can be determined online by PDA/OES. Thus, an overall evaluation of the concentrations of insoluble elements in all detected inclusions, such as the B factor, was recommended when using the PDA/OES method for online control of NMIs in the steelmaking process.
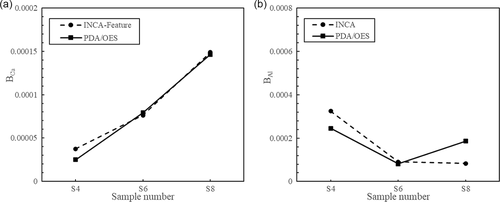
In this study, the B factor was used to compare the results obtained by the INCA-Feature and PDA/OES techniques for the evaluation of inclusions smaller than 15 μm. The PDA/OES data were determined using calibration lines. As Figure 8 shows, close BCa values were obtained from these two methods for samples S4 (before the Ca treatment), S6 (10 min after a Ca treatment), and S8 (20 min after a Ca treatment). An increase of the total Ca contents in inclusions can clearly be found with time after a Ca addition, according to the results from both the INCA-Feature and PDA/OES determinations. In contrast, the B-factor values for Al show a decreasing trend after a Ca addition. However, the differences in the values of BAl determined using the INCA-Feature and PDA/OES methods were more extensive than the BCa values, especially in sample S8.
Based on the B factors of Al, Ca, and Mg obtained from the PDA/OES analysis for grade A, the average compositions of the detected NMIs in samples taken from different stages were calculated and are plotted in a ternary diagram in Figure 9. The gray zone corresponds to the liquid inclusion zone at 1600 °C. The dashed line shows a possible semiliquid inclusion zone, in which inclusions can contain a solid core and a liquid (or semiliquid) outer layer. Here, one hollow circle represents the average composition of all detected inclusions in one sample. A clear tendency of the change of the average composition could be found after a vacuum treatment before a Ca addition (S4) and 10 min after a Ca addition (S6–S8). The solid circles represent the average chemical compositions of inclusions observed by using the INCA-Feature method in the S4, S6, and S8 samples. It can be seen that a good correlation was obtained for the S4 and S6 samples when using the two different methods, whereas about 25% difference in the %CaO content was found for the S8 sample. As shown in Figure 8, the values of BCa determined by these two methods are almost the same for sample S8, but the values of BAl show a big difference (BAl-PDA/OES > BAl-INCA). Also, in Figure 7, the value of BAl-PDA/OES in S8 is significantly larger than that in the other samples. As the results obtained from the EE + SEM and INCA-Feature methods provide no evidence that there is an obvious increase of Al in the inclusions, the difference of the average inclusion compositions in S8 may be caused by some big-sized Al-containing inclusions that are located in the detected zone. Although the determined positions of S8 using the two different techniques are different, both are close to the liquid zone (Figure 9). These results indicate that the inclusions were completely or partially modified and that the Ca treatment was successful.
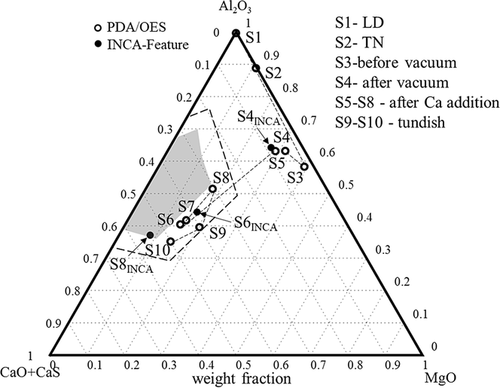
Though many Ca-modified liquid inclusions (located in the liquid zone) were observed using the INCA-Feature and EE + SEM methods in sample S6, as shown in Figure 6, the average composition of all NMIs (including inclusions containing a lower amount of CaO) determined by INCA-Feature was outside the liquid zone. This can be explained by the presence of some unmodified inclusions having high Al2O3 and/or MgO contents and some unmodified (Al, Mg)O cores in partially Ca-modified complex inclusions. Thus, a larger acceptable area (included the semiliquid inclusions and illustrated as the dashed line in Figure 9) is needed when judging if the Ca modification is successful or not. If the point in the ternary diagram is outside the acceptable zone, technical parameters (such as Ca-addition amount, stirring intensity and time) can be corrected to optimize the inclusion compositions. With this information, the inclusion characteristics can be corrected based on the B factors obtained from PDA/OES determinations.
3.4 Other Possibilities of PDA/OES Applications—Clogging Problem
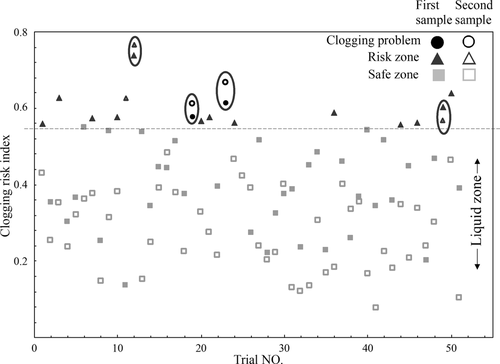
The lower values of CRI for inclusions, which have concentrations of Al2O3 and CaO corresponding to the liquid zone in the Al2O3CaO phase diagram or close to this zone, correlate to a lower CRI. If the CRI value for inclusions is higher, the inclusions in the melt will be solid. These kinds of inclusions will result in clogging problems during continuous casting. It should be pointed out that the semiliquid inclusions having a liquid outer layer are less harmful regarding the clogging problem compared to the solid NMIs, and can significantly decrease the clogging risk. Therefore, a semiliquid zone should be considered when the average composition determined using the PDA/OES method is considered, as shown in Figure 9. Thus, a threshold value of the CRI was set at about 0.75 (the semiliquid border shown as the dashed line in Figure 10). The CRI should be lower than the threshold value to avoid clogging problems during the continuous casting process.
In trials of the selected steel grade, 25% of the first samples of the trial heats (solid triangles and solid circles) are in the risk zone (CRI > 0.75). Furthermore, only 10% of the heats (hollow triangles and hollow circles) have the second samples in the risk zone. In total, only 8% of the heats (four heats, marked by ovals) have both samples taken from the tundish being in the risk zone. Among them, two heats resulted in a fixed clogging problem (circle markers). As shown in Figure 10, these problematic trials have a CRI in both samples higher than the threshold value. Therefore, by determining the B factor of Ca and Al in steel samples taken from the tundish, an early warning for the potential risk of a clogging problem can be obtained since PDA/OES determination results can be obtained in several minutes (≈3–5 min including sample preparation and PDA/OES analysis) after sampling of steel melt from the ladle before casting or from the tundish during casting. However, for further statistical studies, data of more trials and grades have to be collected and studied.
4 Conclusion
In this study, three different analytical techniques (PDA/OES, INCA-Feature, and EE + SEM) were applied for the evaluation of NMIs in metal samples taken on different stages of industrial production of low-alloyed Ca-treated steels. Overall, the obtained results can be summarized as follows: 1) With respect to Ca modification of NMIs, the EE + SEM method can provide information about the morphology, reliable size, and compositions of outer layers of totally (liquid) and partially (semiliquid) modified inclusions. In contrast, the INCA-Feature method will mostly provide the composition of the solid inner core of partially modified complex inclusions. As a result, the contents of CaO in inclusions obtained by the EE + SEM method are 5–10% larger on average compared to the results obtained using the INCA-Feature method. 2) The change of the NMIs’ average compositions during the process with time determined using the PDA/OES measurements correlates well with the tendency obtained using the INCA-Feature method. The average compositions of inclusions were located at the liquid zone or semiliquid zone for samples S6 and S8 after a Ca addition. 3) The study of clogging problems using the clogging risk index based on 51 trials in the database shows a possibility of obtaining an early warning during the continuous casting. The CRI values determined using the PDA/OES measurements for a steel sample take from the tundish should be lower than 0.75 (NMIs are modified to liquid and semiliquid inclusions) to avoid clogging problems.
Acknowledgments
H.D. acknowledges the financial support from the China Scholarship Council (CSC), Jernkontoret, Stiftelsen Prytziska Fonden, and Bergshögskolans Jubileumsfond.
Conflict of Interest
The authors declare no conflict of interest.
Open Research
Data sharing is not applicable to this article as no new data were created or analyzed in this study.


