Influence of Interlayer Forced Air Cooling on Microstructure and Mechanical Properties of Wire Arc Additively Manufactured 304L Austenitic Stainless Steel
Abstract
Wire-and-arc additive manufacturing (WAAM) is an innovative technology that involves deposition of subsequent layers of molten materials. Due to the high deposition rates, this technology is suitable for the production of large-scale complex structures. Further enhancement in the productivity can be achieved by an interlayer cooling strategy that reduces idle time between depositions. However, the effect of the interlayer cooling on microstructure and mechanical properties has to be addressed. In this view, the present work compares microstructural features and mechanical properties of WAAM-produced plates of austenitic AISI 304 L, focusing on the effect of both active interlayer air cooling and possible anisotropy induced by the additive process. Microstructural and mechanical characterization was conducted on samples extracted along the longitudinal, transverse, and diagonal directions to the deposition layers of WAAM plates, processed with and without interlayer active cooling. Results showed no remarkable influence of cooling conditions on the microstructure and mechanical properties of WAAM plates, which are indeed affected by the anisotropy induced by the additive process. The observed anisotropy in the elastic modulus, independent from different cooling conditions, was related to the crystallographic texture consequent to the highly oriented microstructure typically induced by the process.
1 Introduction
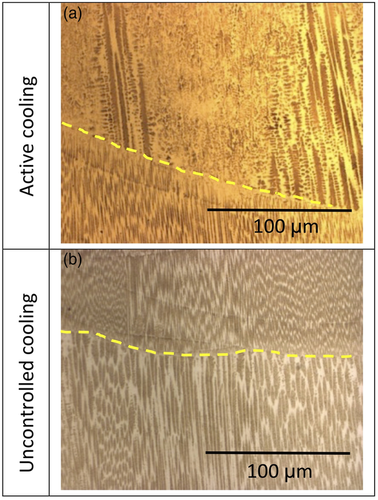
Wire-and-arc additive manufacturing (WAAM) belongs to the family of direct energy deposition (DED) technologies, defined according to EN ISO/ASTM 52900,[1] in which the fabrication of 3D parts is achieved by the deposition of subsequent layers of molten metals. Because of the high heat inputs induced by the layer-by-layer deposition of molten material, the manufactured part is subjected to complex thermal cycles, as the previously deposited layers are continuously reheated during the process.[2] Therefore, to facilitate the solidification of the newly deposited layer and to avoid the collapse of the wall, a proper interlayer idle time has to be imposed.[3] The delay between successive depositions, in fact, promotes heat dissipation and it is necessary to control the interlayer temperature, which, if too high, may lead to unstable melt pools. The materials’ final properties are also affected by temperature control because a low interlayer temperature increases solidification rates of the deposited material, thus hindering excessive grain coarsening and possibly improving final mechanical properties. However, long idle time can lead to an unprofitable total production time and consequently limit depositions rates, which are one of the main advantages of this additive process. In view of this, WAAM productivity can be increased by adopting an interlayer cooling strategy that limits idle time by forcing the cooling of the lastly deposited layer.[4] Toward this aim, different methodologies have been studied: water bath, high-pressure air, aerosol, CO2 gas jet, and a combined system with an air jet and a water-cooled platform.[4-11] However, when thinking about the industrial applicability of cooling strategies, the one performed with a high-pressure air jet is the most feasible, especially in case of large-scale structures. Currently, the issue of forced interlayer cooling has been mainly addressed process-wise with the support of numerical simulations[5, 6] or with the aim to reduce parts’ distortions,[7, 8] whereas limited effort has been devoted to assess the effect of different cooling conditions on the final mechanical properties of printed parts. Few studies have focused on the microstructure and mechanical properties of interpass-cooled WAAM Ti and Al alloys,[9-11] and a lack of knowledge on the role of active or forced cooling on ferrous alloys exists, in particular in case of stainless steels, which have been widely reported as suitable materials for WAAM parts, by reason of their good printability and mechanical properties.[12] The effect of forced cooling on the WAAM of 308 L stainless steel thin walls was only recently investigated in terms of surface quality, microstructure, and mechanical properties.[13] The study suggested that forced cooling had a major influence on the increase of layer thickness and on the improvement of the surface finish of WAAM parts, but it also succeeded in limiting microstructure coarsening and it slightly increased tensile properties. In the study, the investigated samples were extracted only from the direction parallel to the deposition layer, and therefore did not consider the possible anisotropy induced by the additive process, already reported by the literature for WAAM austenitic stainless steels.[14-16]
Based on this, the current study focuses on the investigation of WAAM austenitic stainless-steel plates manufactured with uncontrolled and active cooling conditions. A comprehensive and comparative microstructural and mechanical characterization was conducted to highlight the role of forced cooling in the production of WAAM thin walls. In addition, to take into consideration the possible anisotropy induced by the process, all the analyses were performed along three main directions, identified in the longitudinal (L), transverse (T), and diagonal (D) orientation, according to the deposition layers.
2 Experimental Section
2.1 WAAM Manufacturing of Test Samples
This work investigates the influence of the cooling process by comparing the microstructure and mechanical properties of specimens realized with an active interlayer cooling system, consisting of a flow of compressed dry air, and with uncontrolled cooling.
Specimens for the experimental tests were cut from plates realized by WAAM using grade ER 308LSi austenitic stainless-steel wire. Details of the printing process were already described by Laghi et al.,[15] where a preliminary characterization of plates produced with the active cooling system was reported. All plates were manufactured with the same set of process parameters. In detail, 1 mm wire diameter was used, and the used welding speed and wire feed rate were within the ranges of 15–20 mm s−1 and 4–8 m min−1, respectively. The used shield gases were 98% Ar and 2% CO2 at a flow rate between 10 and 20 L min−1, and the current and arc voltage of the deposition process were within the range of 100–140 A and 18–21 V, respectively, while the deposition rate was between 0.5 and 2.0 kg h−1. The welding source used was gas metal arc welding (GMAW), with pulse welding arc transfer. No arc correction was adopted during the printing process. The substrate was a printing plate of 1000 × 1000 × 30 mm3, with H-type beams welded as support.
A total of ten plates with nominal dimensions of 380 × 380 × 4 mm3 were realized at MX3D facilities,[17] five manufactured with the active cooling system and five under uncontrolled cooling conditions, thus allowing natural cooling of the printed layer. For the sake of conciseness, hereafter the specimens cut from plates produced with active cooling are indicated with “A,” whereas those cut from plates produced under uncontrolled cooling conditions are indicated with “U.” In case of active cooling, immediately after the deposition a nozzle blew dry compressed air (8 bar) on the layer. The nozzle was located at ≈30 mm from the layer with a 30° inclination and followed the same trajectory as the torch, moving with a speed of 10 mm s−1. In case of relatively small parts, as in this study, this procedure is able to reduce idle time between subsequent depositions up to 80%.
To evaluate a possible anisotropic mechanical behavior induced by the WAAM process, tensile specimens were cut from the plates following three main orientations to the deposition layer (Figure 1): 1) longitudinal (L), i.e., parallel to the deposition layer; 2) transverse (T), i.e., perpendicular to the deposition layer; and 3) diagonal (D), i.e., at 45° to the deposition layer.
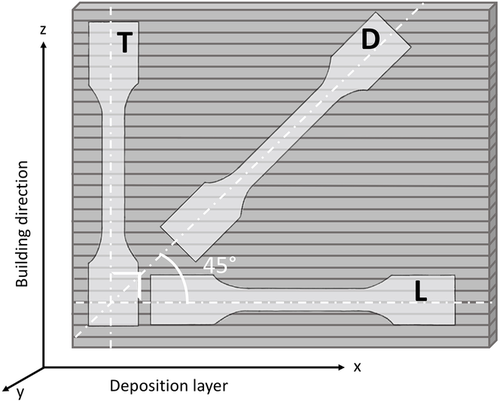
Tensile specimens were cut from plates having dimensions according to ISO 6892-1.[18] Given the inherent geometrical irregularities proper of WAAM printing process,[14, 19, 20] the surface of the specimens was machined before testing to reduce the variations in thickness and cross-section provided by the layer-by-layer surface roughness. From a nominal thickness of the plates of 4 mm, the resulting machined specimens were 2.5–3 mm thick.
2.2 Chemical and Microstructural Characterization
Glow discharge optical emission spectroscopy (GDOES: GDA-650, Spectruma Analytik GmbH, Hof, Germany, with a sputtered burnt spot of 4 mm diameter) was used to check the chemical composition of WAAM plates.
Samples for microstructural analysis were sectioned from grip regions of longitudinal (L), transverse (T), and diagonal (D) tensile specimens. The samples were mounted in a phenolic resin, grounded with silicon carbide papers up to 1200 grits, and finally polished, according to ASTM E3 standard[21] up to 1 μm polycrystalline diamond suspension for a mirror finish. Microstructural features were revealed by chemical etching with 20 s immersion in Vilella's reagent (1 g picric acid, 5 mL hydrochloric acid, and 100 mL ethanol).[22] In addition, to highlight the possible presence of the δ-ferrite phase, a specific color etching was applied following the procedure described by Hetzner.[23] Microstructural analysis was carried out by optical (OM, Zeiss Axio Imager A1 and Reichert MEF3) and field-emission gun scanning electron microscopy (FEG–SEM, TESCAN MIRA 3). The phase composition of representative samples was assessed by X-ray diffraction (XRD: X’Pert PRO diffractometer, PANAlytical, Almelo, NL), using Ni-filtered Cu Kα radiation generated from a conventional tube operating at 40 mA filament current and 40 kV acceleration voltage. Patterns were acquired over 40° < 2θ < 100° range, with a step size of 0.02° and 120 s step−1 counting time, with a 1D array of solid-state detector (X’Celerator PANAlytical).
2.3 Mechanical Characterization
The mechanical behavior of the WAAM plates was investigated by means of tensile tests, hardness, and nanoindentation measurements.
2.3.1 Tensile Tests
A total of 26 specimens were subjected to tensile tests along the three main directions with reference to the building orientation (as shown in Figure 1). In particular, 8 specimens were cut along L direction, 6 along T direction, and 12 along D direction. For each orientation, half of the specimens were cut from plates realized with active cooling (A) and the other half with uncontrolled cooling (U). Dog-bone samples were machined with nominal dimensions of 20 mm × 3 mm cross-sectional area and 130 mm gauge length. The tests were performed on a universal testing machine of 500 kN load capacity with a loading rate of 2 MPa s−1 according to ISO 6892-1.[18] Two types of monitoring systems were adopted for strain measurements: 1) a linear deformometer of nominal length of 50 mm, to detect the linear deformation of the specimen up to yielding, and 2) an optical-based system referred to as a digital image correlation (DIC) system to acquire information on the full field of strain during the whole test until failure. From the tensile tests, the following key mechanical parameters were evaluated:[18] Young's modulus (E), 0.2% proof stress (Rp.02), ultimate tensile strength (UTS), elongation to failure (A%) and strength ratio (Rp.02/UTS).
After the tensile tests, specimens fracture surfaces were analyzed with FEG–SEM to investigate the specific failure mechanisms.
2.3.2 Nanoindentation and Hardness Tests
Standard microhardness measurements (HV0.1) were also conducted in the interlayer regions of metallographic samples according to the Vickers test method described in the ISO 6507-1 standard,[24] using a 100 g load and 15 s duration time.
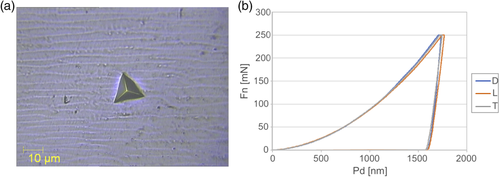
For nanoindentations, a depth-sensing Berkovich nanohardness tester (NHT indenter, Anton Paar TriTec, Peseux, Switzerland) was used. Nanoindentation experiments were performed on polished samples under load-controlled mode, with maximum load of 250 mN and load rate 200 mN min−1, according to ASTM E2546.[25] Nanoindentation was performed on 5 × 5 indentation matrixes with 30 μm interspacing between the indents, which is large enough to avoid any overlap of deformation volume. The indentation depth (around 1.6 μm for all the samples) was ensured to be deep enough to ignore any indentation size effect.[26] Three repetitions on each sample allowed obtaining statistically representative values from such a heterogeneous material. More details on the nanoindentation test are discussed in previous works,[27-30] where the authors explain how it is possible to calculate the indentation hardness (HI, GPa) and indentation elastic modulus (EIT, GPa). A representative optical image of the indentation and corresponding load–displacement curves are reported in Figure 2.
3 Results and Discussion
3.1 Compositional Analysis
Results of chemical composition analyses by GDOES are reported in Table 1 where the composition of samples with uncontrolled and active cooling is compared to the feedstock wire. Starting from an ER 308LSi wire, the composition of WAAM samples corresponded to the AISI 304 L chromium–nickel austenitic stainless-steel requirements, also reported in Table 1. This outcome was already evidenced in a previous work on the WAAM A plates[15] and it is reasonable since ER 308LSi wire is a common filler wire for the welding of AISI 304 L.
Creq and Nieq values were calculated according to the Schaeffler diagram[34] from data reported in Table 1, and it was found Creq = 20.5% and Nieq = 10.7% for WAAM A and Creq = 20.7% and Nieq = 11.8% for WAAM U. Therefore, a microstructure with γ-austenite and δ-ferrite (≈10 vol%[34]) is expected for both A and U conditions.
| Elements [wt%] | ||||||||||||
|---|---|---|---|---|---|---|---|---|---|---|---|---|
| C | Cr | Ni | Mn | Si | Co | V | Mo | Cu | P | S | Fe | |
| Feedstock wire | 0.02 | 20 | 10 | 1.8 | 0.85 | – | – | 0.2 | – | <0.025 | <0.020 | Bal. |
| WAAM A | 0.009 ± 0.002 | 19.50 ± 0.15 | 9.58 ± 0.05 | 1.73 ± 0.01 | 0.634 ± 0.004 | 0.47 ± 0.03 | 0.111 ± ± 0.001 | 0.015 ± 0.001 | 0.015 ± 0.003 | 0.022 ± 0.0001 | 0.011 ± 0.0005 | Bal. |
| WAAM U | 0.019 ± 0.001 | 19.58 ± 0.07 | 10.32 ± 0.05 | 1.74 ± 0.02 | 0.603 ± 0.006 | 0.10 ± 0.04 | 0.079±0.001 | 0.170 ± 0.004 | 0.081 ± 0.001 | 0.024 ± 0.002 | 0.001 ± 0.0001 | Bal. |
| AISI 304 L | <0.03 | 18.0–20.0 | 8.0–12.0 | <2.0 | <1.0 | – | – | – | – | <0.045 | <0.03 | Bal. |
3.2 Microstructural Characterization
Microstructural analyses at low magnification, as well as fractographic analyses discussed in the following, highlighted the general absence of macrodefects (cracks, porosities) between any two adjacent layers, resulting in a dense microstructure. These results were also confirmed by density measurements of the printed plates. Samples processed with and without active cooling were characterized, in fact, by similar average density values equal to 7930 ± 240 kg cm−3. The density was evaluated according to the Archimedes principle, described in the ASTM B311-17 standard,[31] by using an analytical balance and by measuring the specimen first in air and then immersed in distilled water, as also adopted in previous works.[14, 20] Low-magnification micrographs highlighted also the typical hierarchical microstructure resulting from WAAM, consisting of subsequent deposited layers in which liquid metal solidifies following an epitaxial growth and, within long epitaxial grains, a fine columnar–dendritic solidification structure is formed.[3, 12] Representative OM micrographs on metallographic samples extracted from the grip regions of L (a,d), T (b,e), and D (c,f) tensile specimens (according to the scheme in Figure 1) are reported in Figure 3. Deposition layers, epitaxial grain growth, perpendicular to deposition layers, and cellular–dendritic substructure inside long epitaxial grains, typical in WAAM-processed alloys, are visible. In the micrographs, layer boundaries are underlined with a yellow dashed line, and white dashed lines define borders of epitaxial grains that cross-over layers.
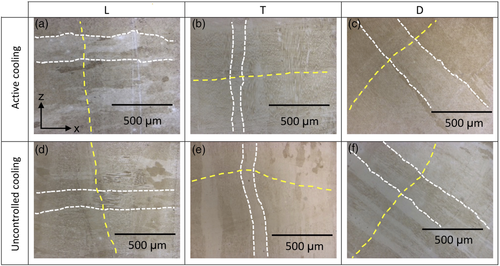
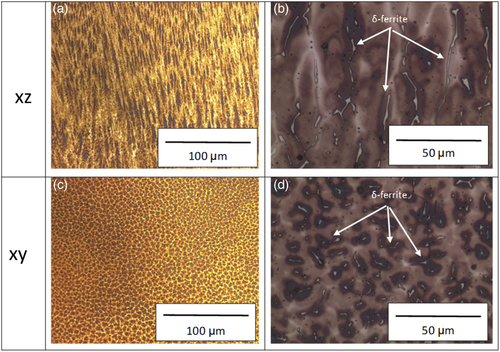
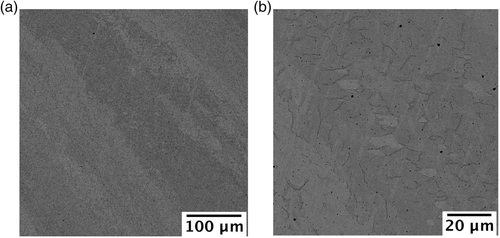
Figure 3 shows the typical hierarchical microstructure with regular deposition layers, perpendicular, parallel, and 45° oriented to the loading direction in the samples T, L, and D, respectively. Epitaxial grains extended across several deposition layers, as clearly visible in Figure 3. Such grains had a preferential orientation along the building direction (Z) and were perpendicular to the bottom substrate (XY plane) up to the top sections. As WAAM technology essentially consists of an additive multipass welding process, during each new layer deposition the upper part of the previous layer partially melts and, when solidification occurs, grains grow epitaxially from the already solidified material following the direction of the maximum temperature gradient, perpendicular to the solid/liquid interphase. Furthermore, because of heating induced by the deposition of each new layer, coarsening of grains in the upper region of the bottom layer, near the layer boundary, can occur. Grain coarsening is indeed clearly visible in Figure 4, which reports a representative interlayer region of the A and U samples and, according to all microstructural analyses performed, was unaffected by the application of the active cooling system. The existence of different solidification morphologies inside each deposited layer was reported also by other researchers,[32, 33] who evidenced, from the bottom to the top of each layer, a fine cellular structure in the proximity of the lower boundary, a fine columnar structure in the layer core, and a coarse columnar structure with secondary dendrite arms at the top of the layer, close to the upper boundary. This outcome is due to the variation of the GR−1 ratio (where G is the cooling rate and R represents the solid–liquid interface growth) along the layer and thermal cycles resulting from the additive process.[2] Moreover, despite the different cooling conditions, on both the U and A samples within the large epitaxial grains, the same fine columnar–dendritic submicrostructure is observed at high-magnification analyses (Figure 5), consisting of γ-austenite dendrites and vermicular δ-ferrite in the interdendritic spaces. Based on the chemical composition in Table 1 and according to the ternary Fe–Cr–Ni phase diagram, a ferrite–austenite (FA) solidification mode should be verified. The amount of δ-ferrite was evaluated by image analyses and was found to be in the range of 8–12 vol%, a value consistent with the one predicted by Schaeffler diagram (10 vol%).[34] The coexistence of γ- and δ-phases in WAAM austenitic stainless steels was also observed in the literature[12] and, besides chemical composition, it is related to both thermal cycles and nonequilibrium rapid solidification conditions. The presence of δ-ferrite in the interdendritic regions was confirmed by FEG–SEM analyses. The microstructure in the XZ plane of a representative diagonal sample is reported in Figure 6, showing the distribution of the δ-phase. Specifically, SEM image by secondary electrons (Figure 6a) shows that δ-ferrite (light gray phase in the micrograph) follows the large columnar grains, oriented at 45°, and it is homogenously distributed along the entire XZ section. Further details are given by the high-magnification SEM image by backscattered electrons (Figure 6b), which show the concentration of δ-ferrite in correspondence of cells boundaries. In addition, by comparison of metallographic cross-sections on XZ (Figure 5a,b) and XY (Figure 5c,d) planes, it can be seen that the morphology of grains and phases changes, being stretched along the building direction (Z-axis) on the XZ plane and approximately equiaxed in the XY one.
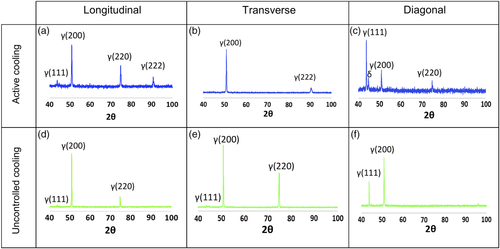
The phase composition of the printed materials was investigated by XRD and the diffraction patterns are reported in Figure 7. The analysis confirmed that samples processed with and without active cooling presented the same phases, and in fact γ-austenite and δ-ferrite main peaks were identified. Moreover, the peak distribution and intensity of γ-austenite evidenced an anisotropic crystallographic texture: in the D sample the main γ peak is the (111), whereas it is the (200) is the T and L samples. Such a difference in crystallographic texture can significantly influence the final mechanical properties. Experimental observations for polycrystalline austenitic stainless steels[35-37] have shown that the mechanical properties, such as Young's modulus, depend on the crystallographic orientation because Ehkl increases in the order E100 < E110 < E111.
3.3 Tensile, Hardness, and Toughness Data
Mean values and standard deviations of tensile properties are reported in Table 2. Overall, from the results of tensile tests it seems that the cooling strategy did not highly influence the tensile response of WAAM-produced AISI 304 L stainless steel specimens. The main difference between the two cooling strategies was related to the elongation at rupture, whose values were higher on average for specimens with uncontrolled cooling (U), especially for longitudinal (L) specimens. On the other hand, as expected, the mechanical parameters are more affected by the specimen orientation with regard to the deposition layers. In fact, diagonal (D) specimens registered the highest values of Young's modulus, 0.2% proof stress and UTS. This trend confirms the anisotropic nature of WAAM-produced AISI304L plates, as previously studied.[14-16]
| Specimen type | Printing strategy |
E [GPa] |
Rp0.2 [MPa] |
UTS [MPa] |
A% [%] |
Rp0.2/UTS [–] |
|---|---|---|---|---|---|---|
| T | A | 112 ± 7 | 351 ± 19 | 513 ± 39 | 21 ± 9 | 0.69 ± 0.03 |
| U | 111 ± 1 | 354 ± 18 | 592 ± 7 | 26 ± 3 | 0.60 ± 0.03 | |
| L | A | 133 ± 3 | 356 ± 10 | 560 ± 13 | 26 ± 5 | 0.64 ± 0.02 |
| U | 142 ± 4 | 322 ± 11 | 575 ± 17 | 34 ± 2 | 0.56 ± 0.02 | |
| D | A | 241 ± 38 | 420 ± 48 | 608 ± 77 | 22 ± 6 | 0.69 ± 0.03 |
| U | 249 ± 30 | 408 ± 27 | 602 ± 41 | 24 ± 5 | 0.68 ± 0.05 |
Figure 8 reports the bar charts comparing the mean values and standard deviations of the tensile properties for the three directions investigated (T, L, and D) with specimens extracted from plates printed with active cooling (A) or with uncontrolled cooling (U). Reference standard values of the conventionally manufactured 304 L stainless steel, according to European building code, is also provided (dotted red line).[36]
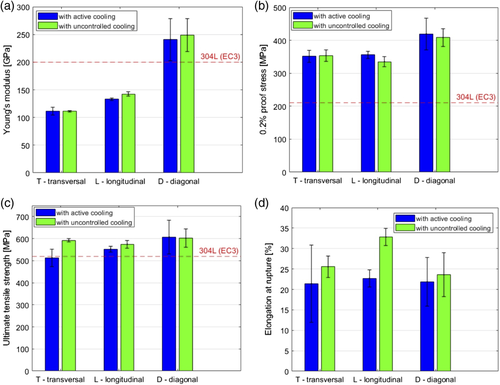
In general, specimens with active cooling showed slightly reduced values (reductions between 3% and 25%) for most of the mechanical properties for the T specimens, with some exceptions for the L specimens (UTS) and the D specimens (0.2% proof stress and UTS). The largest reductions were observed for the elongation at rupture. For the latter, T specimens reported the highest dispersion of results (evidenced by the high standard deviation). Reasoning for this was found in the presence of a defect on the fracture surface of one of the specimens tested with active cooling, as also reported in a previous work.[15]
As far as Young's modulus values are concerned (Figure 8a), the active cooling strategy led to slightly reduced values. As expected, high anisotropy was observed from the bar charts, as widely investigated in a previous work[15] and also reported by Kyvelou et al.[14]
When considering the 0.2% proof stress values (Figure 8b), both L and D specimens realized with active cooling resulted in slightly larger values. As far as the UTS is concerned (Figure 8c), the active cooling led to a slightly reduced values for both the T and L specimens, whereas no significant variation is registered for D specimens. As already mentioned, the highest discrepancy between specimens with different cooling strategies was found when considering the elongation at rupture (Figure 8d). Indeed, for all three orientations considered the specimens with active cooling led to significantly reduced values.
Table 3 reports the values of the A/U ratio for all tensile properties distinguishing the different orientations. In general, the ratio are within +/-5% to +/-10%, in line with the inherent variability of the mechanical parameters for each type of specimen tested (as reported in Table 2). The main differences were registered for the elongation at rupture, whose values were higher for U specimens along all the three directions considered. The main increase in A% is registered for the L direction, with a 25% increase.
| Relative ratio | Relative ratio |
E [–] |
Rp0.2 [–] |
UTS [–] |
A% [–] |
YS/UTS [–] |
|---|---|---|---|---|---|---|
| A/U | T | 1.00 | 0.99 | 0.87 | 0.84 | 1.14 |
| L | 0.94 | 1.11 | 0.97 | 0.76 | 1.15 | |
| D | 0.97 | 1.03 | 1.01 | 0.93 | 1.02 |
Table 4 reports the relative ratios of the three orientations considered, with either active (A) or uncontrolled (U) cooling. Overall, the trends do not seem to be highly affected by the different cooling strategies. In fact, a similarly marked anisotropic behavior is registered for both types of specimens (A and U).
| Relative ratio |
E [–] |
Rp0.2 [–] |
UTS [–] |
A% [–] |
YS/UTS [–] |
|
|---|---|---|---|---|---|---|
| A | L/T | 1.19 | 1.01 | 1.09 | 1.19 | 0.93 |
| D/T | 2.16 | 1.19 | 1.18 | 1.02 | 1.01 | |
| D/L | 1.81 | 1.18 | 1.09 | 0.86 | 1.09 | |
| U | L/T | 1.28 | 0.91 | 0.97 | 1.32 | 0.94 |
| D/T | 2.23 | 1.15 | 1.02 | 0.92 | 1.14 | |
| D/L | 1.75 | 1.27 | 1.05 | 0.70 | 1.22 |
3.4 Fracture Surfaces
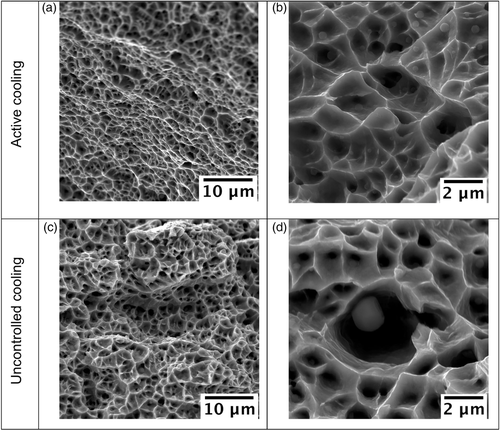
Representative SEM micrographs of fracture surfaces are reported in Figure 9. All samples, regardless of cooling condition and extraction direction, exhibited a ductile fracture mechanism. A ductile fracture is characterized by nucleation and growth of microvoids, called dimples, clearly visible at high magnification analyses (Figure 9a,b). Because of the very fine microstructure, dimples were still very fine, with an average dimension of the order of a few micrometers. As a confirmation of the microstructural and tensile results discussed previously, no major differences in dimples size and shape were evidenced among specimens obtained with or without the active cooling system or extracted along different directions, as also discussed in a previous study.[15]
3.5 Microhardness
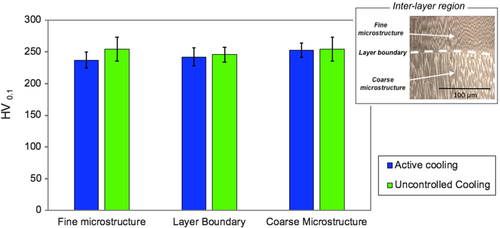
Vickers microhardness measurements (HV0.1) have been performed on metallographic L, T, and D samples, and results are reported in Figure 10. With the aim of assessing the effect of the active cooling on the microstructure, microhardness was evaluated in the interlayer region of samples. As shown by the scheme in Figure 10, measurements were conducted on the coarse columnar–dendritic structure at the top of the bottom layer, the columnar–dendritic structure at the basis of the upper layer, and at the layer boundary. All samples exhibited a comparable value of hardness of ≈250 HV0.1 and, by considering the standard deviation of the experimental results, no difference can be evidenced either according to different interlayer areas or cooling conditions, in agreement with previously discussed microstructural analyses.
3.6 Nanoindentation
One of the main features of metal additive processes is the location dependence of mechanical properties due to the layer-by-layer nature of the process, as well as heating and cooling rates during manufacturing. To assess the small-scale mechanical properties of the as-printed materials, depth-sensing nanoindentation experiments were therefore conducted. Instrumented indentation is a semidestructive, robust, and convenient approach to locally assess the mechanical properties of materials (e.g., location-dependent properties).[37] The nanoindentation technique is a unique tool to track variations in local mechanical properties when dealing with fine and inhomogeneous microstructure, such as the one observed in metal additive manufacturing.[15, 38] Past investigations showed the possibility to obtain hardness data from nanoindentation tests for a single laser track or within an individual melt pool, too small to be studied with conventional microhardness tests.[39-41] The nanoindentation size is 10 μm and localized properties are measured rather than average ones like in Vickers hardness measurement.
The differences in properties between different zones could be related to the crystallographic texture[42] and some studies confirmed that nanoindentation measurements can be suitable to analyze crystal orientation.[43] Repetitions on the same component are possible and it is a convenient technique to asses mechanical properties, including hardness (HIT) and Young's modulus (EIT). Indentation hardness (HIT) and indentation Young's modulus (EIT) were evaluated from the force–displacement curves applying the Oliver and Pharr method. Figure 11 shows the indentation hardness and elastic modulus for the D, L, and T processed with or without active cooling. As shown, all the samples tested presented almost the same mean hardness values, close to 4.4 GPa, but the elastic modulus for D is considerably higher than for T and L specimens, perfectly in agreement with tensile test results. These results reflect the grain orientation evidenced by XRD. E is highest in the <111> direction[14, 37-46] and this is also the main grain orientation in the D specimen.

The micromechanical behavior of WAAM 304 L austenitic stainless steel is very similar to the macromechanical one, confirming that instrumented nanoindentation as an easy, robust, and nondestructive technique to investigate mechanical properties, anisotropy, and texture useful in process design and optimization.
4 Conclusion
This work compares microstructural features and mechanical properties of plates manufactured by WAAM starting from an ER 308 L Si wire, focusing on the effect of interlayer active air cooling. To investigate possible anisotropy, microstructural and mechanical characterization was conducted along three different orientations with reference to the deposition layer: longitudinal (L), transverse (T), and diagonal (D). Based on the experimental observations, the following conclusions can be drawn: 1) The chemical compositions of plates obtained with and without interlayer active cooling complied with the nominal chemical composition of AISI 304 L austenitic stainless steel. 2) For both active and uncontrolled cooling conditions, the microstructure consisted of primary dendritic γ-austenite with trace δ-ferrite in the interdendritic regions. 3) No differences were evidenced in the microstructure of plates obtained with and without interlayer active cooling. A typical hierarchical microstructure consisting of long epitaxial grains, with a fine columnar–dendritic substructure within grains, was observed. Both grains and the substructure were highly oriented along the building direction, resulting in a marked microstructural anisotropy. 4) A strong variation in the elastic modulus among L, T, and D directions was observed and related to the crystallographic texture induced by the process. The trend in the elastic modulus was not affected by the different cooling conditions. 5) Similarly, Rp0.2 and UTS, as well as hardness, were more affected by the microstructural anisotropy rather than by the cooling conditions. In fact, no major differences were evidenced between samples obtained with and without the interlayer active cooling. 6) Macroscale tensile properties were also positively correlated to the microscale local mechanical properties obtained by nanoindentation tests, especially in terms of the elastic modulus.
Acknowledgements
The authors gratefully acknowledge the support of the Dutch company MX3D held in Amsterdam for giving the additive-manufactured elements tested. The authors would like to thank Iuri Boromei and Mattia Zanni at the University of Bologna for their support in the FEG–SEM analyses.
Conflict of Interest
The authors declare no conflict of interest.
Open Research
Research data are not shared.


