Phylogeny, disparity and mass extinction response in the trilobite order Harpetida
Abstract
The trilobite order Harpetida has long been easily recognized but many unanswered evolutionary questions about the group remain. This work explores the phylogenetic relationships within Harpetida and studies the harpetid response to the Late Ordovician mass extinction to better understand the relationship between extinction events and disparity. A discrete morphological character matrix was assembled from published descriptions and refined through first-hand observations. This matrix is the first attempt of its kind to characterize the overall morphology of Harpetida, rather than focusing on individual harpetid genera. Phylogenetic analyses under both maximum parsimony and Bayesian inference optimality criteria retrieve tree topologies that support harpetid monophyly but throw doubt onto previous hypotheses of the internal relationships of the order. Harpetid disparity proves remarkably stable over time. A modest peak in the Ordovician is followed by a slow decline throughout the Silurian and Devonian. After the Ordovician period, harpetids demonstrate little or no ability to colonize new areas of morphospace. This may represent a fundamental failure to recover, in which the lasting impacts of Late Ordovician mass extinction continue to suppress morphological innovation. These findings demonstrate that mass extinction events may have complex impacts that play out over many millions of years.
The Late Ordovician (end-Hirnantian) mass extinction was the first of the five major extinction events to shape the evolutionary history of the Phanerozoic (Raup & Sepkoski 1982) and was responsible for eliminating an estimated 85% of marine species (Sheehan 2001). Of these five mass extinctions, the Late Ordovician event was the second most severe in terms of proportion of genera and families that disappeared (Sepkoski 1996). This mass extinction is generally attributed to a brief period of intense glaciation at the South Pole, and is thought to have occurred in two discrete pulses (Congreve 2013a; Harper et al. 2014). The first of these is ascribed to a sudden temperature decrease, and the second to the retreating of the ice sheets and the displacement of anoxic waters onto continental shelf habitats (Sheehan 1973; Sheehan 2001; Brenchley et al. 2003; Congreve 2008; Finnegan et al. 2011; Sclafani et al. 2019).
Whether the Late Ordovician mass extinction had a substantial, long-term impact on the subsequent evolution of biota has been called into question (Droser et al. 2000; McGhee et al. 2004; McGhee et al. 2012). In particular, McGhee et al. (2004) stated that the extinction failed to eliminate any ecologically dominant taxa or evolutionary innovations and was of minimal ecological impact. However, recent work (Congreve et al. 2019; Scalfani et al. 2019) has challenged this scenario, suggesting that many groups that survived the Late Ordovician mass extinction in fact experienced significant changes in their morphologies, which influenced their potential for subsequent evolutionary success. We address this issue by exploring whether the trilobite order Harpetida experienced major morphological changes following the Late Ordovician mass extinction.
Mass extinction events are responsible for macroecological turnovers and, ultimately, impose constraints on the long-term evolutionary success of clades (Harper et al. 2014). Although much work has explored the effects of these events on taxonomic diversity, their impact on morphological disparity remains poorly understood (e.g. Dommergues et al. 1996; Lupia 1999; Thorne et al. 2011; Bapst et al. 2012; Korn et al. 2013; Ruta et al. 2013; Lamsdell & Selden 2017; Sclafani et al. 2019). Why do some extinction events remove morphologies at random, while others are highly selective (Raup 1992; Jablonski & Raup 1995; Jablonski 2001; Korn et al. 2013)? Why do some clades survive extinctions but fail to occupy new areas of morphospace (Thorne et al. 2011), while others seem primed for morphological innovation (Bapst et al. 2012)? Addressing these questions is important for understanding the patterns of evolution and extinction in the fossil record and for predicting how modern ecosystems may respond to future mass extinctions (Dirzo et al. 2014).
Previous studies have suggested that trilobites in particular exhibited unique patterns of survivorship following the Late Ordovician mass extinction. Chatterton & Speyer (1989) focused primarily on trilobite developmental strategy during the Late Ordovician and demonstrated that species with planktonic larvae were more prone to extinction. Congreve & Lieberman (2011) showed that sphaerexochine trilobites, which are thought to have had benthic larvae, were largely unaffected by the Late Ordovician mass extinction. However, the closely related deiphonine trilobites seem to have been much more strongly affected by this event, despite having a similar developmental strategy, lifestyle, and distribution (Congreve 2013b), suggesting that a more complex scenario may have been at work. Additionally, the Late Ordovician mass extinction eliminated all trilobites with a presumed pelagic adult lifestyle (Chatterton & Speyer 1989).
Cold-water adaptations are thought to have been key to the survival and recovery of various trilobites. This idea was examined in homalonotid trilobites by Congreve (2013a), who concluded that a cold-water adapted lineage was driven to evolve into a warm-water adapted lineage following the end-Ordovician mass extinction. Finnegan et al. (2012) found that the maximum palaeolatitude at which a genus had been previously sampled, a macroecological trait linked to thermal tolerance, strongly influenced extinction risk during the Late Ordovician; specifically, they observed an unexpectedly high extinction rate of low-palaeolatitude genera. Finnegan et al. (2016) examined both biogeographic and bathymetric factors and found that the extinction event preferentially affected genera restricted to deeper waters or to relatively narrow palaeolatitudinal ranges. All of this seems indicative of a strong ecological component to the mass extinction event. At the family level, Adrain et al. (1998) confirmed that extinction patterns in Late Ordovician trilobites were related to clade size; families that survive the mass extinction are more diverse than families that do not.
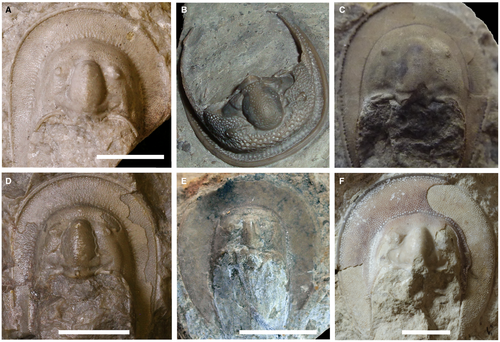
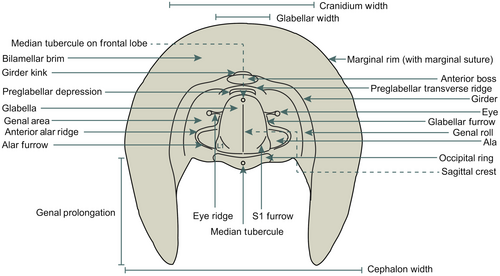
The present contribution examines the phylogeny and morphology of harpetid trilobites. Harpetida Whittington, 1959 was an order of trilobites first recorded in 500 Ma during the Late Cambrian (Hughes 2007) and went extinct during the Late Devonian at the base of the Upper Kellwasser Event (McNamara et al. 2009). Harpetids are identified by the horseshoe-shaped ‘harpetid brim’; long genal prolongations (broader and flatter than typical genal spines); reduced eyes, often with strong ridges; a small pygidium; and an anteriorly narrowing glabella (Fortey & Owens 1997). Because harpetid trilobites are morphologically distinctive (Figs 1, 2), they are an ideal group for the discovery of informative phylogenetic characters. In addition, harpetids were one of a handful of trilobite orders to survive the Late Ordovician mass extinction (Hughes 2007). As such, harpetids are also an ideal model group for exploring models of post-extinction recovery, specifically, linking patterns of disparity change with fluctuations in taxic richness.
History of the Harpetida concept
Harpetida was raised to ordinal status by Ebach & McNamara (2002). The group was previously placed within Ptychopariida, but harpetids are distinguished from true ptychopariids by their marginal facial sutures and lack of a rostral plate (Ebach & McNamara 2002). Ebach & McNamara (2002) recognized three harpetid families, Harpetidae, Harpididae, and Entomaspididae, and c. 30 genera. Although the monophyly of the group is generally accepted, Adrain (2011) did not positively identify a unified Harpetida. Instead, he placed the family Harpetidae (including those species previously assigned to Entomaspididae) within the order Harpida, while regarding the family Harpididae as incertae sedis.
Drawing on the conclusions of Fortey & Owens (1999), Adrain et al. (2004) described members of the family Harpetidae as belonging to a morphofunctional group of small, filter-feeding trilobites, characterized by a vaulted cephalic chamber flanked by genal prolongations, a thorax suspended above the sediment surface, weak axial musculature, a hypostome held above the level of the cephalic margin, and (usually) reduced eyes. Although highly generalized, this description offers a basis for understanding the harpetid morphotype. Early work in experimental biomechanics (Pearson 2017) has suggested that other members of this morphofunctional group are unlikely to have been genuine filter feeders, casting uncertainty onto harpetids’ ecological adaptations. Much of the debate hinges upon the function of the harpetid brim, which has been variously suggested to act as a plough, a sieve, a hydrostatic device, a sensory or respiratory organ, or a structure for strengthening and lightening the exoskeleton (Ebach & McNamara 2002; McNamara et al. 2009).
The study of disparity
While taxonomic diversity measures the number of taxa within a clade, disparity, or morphological diversity, measures the range of forms (Foote 1991a; Foote 1992a; Foote 1993; Foote 1994; Wills et al. 1994; Foote 1995; Foote 1997; Roy & Foote 1997). There are essentially two ways to quantify disparity (Briggs et al. 1992, Villier & Eble 2004; Hetherington et al. 2015; Deline et al. 2018). The first is through morphometrics, which can be further broken down into those techniques that use continuous measurements (traditional morphometrics) and those that use landmarks (geometric morphometrics). However, reliable morphometric data can be problematic to collect when working with taxa with highly variable or divergent morphologies. The alternative approach is to use discrete characters (which can be combined with continuous data), often derived from cladistic data (Foote 1992a; Wills et al. 1994; Wagner 1995; Lloyd 2016; Hopkins & Gerber 2017; Guillerme et al. 2020). Character-based disparity analyses overcome some of the challenges associated with divergent morphology, and multiple comparative studies have used discrete characters successfully to study shifts in disparity over time and across multiple mass extinctions (Foote 1994, 1999; Wills 1998; Lofgren et al. 2003; Wesley-Hunt 2005; Young et al. 2010; Thorne et al. 2011; Bapst et al. 2012; Hughes et al. 2013; Ruta et al. 2013; Lamsdell & Selden 2017).
Notably, character-based disparity analyses appear to yield findings comparable to more conventional, morphometric approaches (Villier & Eble 2004; Hetherington et al. 2015). Hetherington et al. (2015), looking at caecilian amphibians, found that disparity measurements based on skull morphometrics correlated well with disparity measurements based on discrete neuroanatomical characters. This supports the earlier findings of Villier & Eble (2004), who saw patterns of high early disparity in both landmark- and character-based analyses of spatangoid echinoids. However, assessments of disparity from traditional morphometrics may diverge from the other methods when very different aspects of morphology are being measured; Villier & Eble (2004) cite the example of quantifying an echinoid’s overall shape, as opposed to its tuberculation and plate architecture.
Brusatte et al. (2011) built on the idea of character-based disparity and presented a method for phylogenetically correcting for missing data in such studies. The method infers hypothetical ancestors at every node of the phylogenetic tree, reconstructs their character states, and includes them in the disparity analysis as if they were sampled taxa. Halliday & Goswami (2016) expanded on this approach by introducing the ‘extended punctuational’ method, which gives reconstructed ancestors a temporal range, rather than having them appear only in a single time bin. This technique better enables direct comparisons between disparity measures and taxonomic diversity measures, which are often phylogenetically corrected, and is especially useful for groups with periods of low sampled diversity, such as harpetids. However, this method must be applied cautiously, because the reconstructed ancestors are not truly independent data points and may introduce problematic side-effects (e.g. smoothing bias) (Lloyd 2016; Guillerme et al. 2020).
Using a wide variety of approaches to study disparity, Foote (1997) concluded that the evolution of morphological disparity is typically non-uniform, often expanding early in clade history while taxonomic diversity remains comparatively low. Hughes et al. (2013) likewise found that clades tend to reach their highest morphological disparity early in their evolutionary history. However, this pattern can be truncated by mass extinction events (Hughes et al. 2013), which is consistent with findings suggesting that a wide variety of environmental factors contribute to patterns of disparity, including global sealevel (Dommergues et al. 1996), bathymetry (McClain 2005; Hopkins 2014), substrate (Hopkins 2014), temperature (Hopkins 2014), and salinity (Lamsdell & Selden 2017).
Whatever the contributing factors, it has long been recognized that taxonomic diversity and disparity are frequently decoupled (Foote 1993; Lupia 1999; Thorne et al. 2011; Hopkins 2013; Ruta et al. 2013; Congreve et al. 2018). Hopkins (2013) studied this phenomenon in Cambrian trilobites and concluded that signals of high disparity with low taxonomic diversity are more likely to be the result of random or mean-targeted extinction, rather than increased rates of morphological diversification. This finding is of particular relevance to this study, given its focus on the harpetid response to mass extinction.
Disparity and mass extinction
Mass extinctions can affect disparity in various ways. Korn et al. (2013), studying the Devonian and Permian extinction events, suggested that disparity could be affected during periods of widespread extinction in accordance with one of three general modes. The first mode is essentially random, in which available morphologies are removed in a non-selective fashion. In this mode, overall morphospace occupation is not affected. Possible examples of this are seen in ammonoids during the Toarcian–Aalenian transition (Simon et al. 2010) and end-Permian mass extinction (Korn et al. 2013), and in blastoid echinoderms (Foote 1991b). The second characteristic mode is marginal, in which the edges of morphospace are selectively and symmetrical trimmed. In this mode, overall variation is reduced. Possible examples of this are seen in phacopid and proetid trilobites (Foote 1993). Finally, the mode of extinction may be lateral, with asymmetric selection eliminating a particular region of previously occupied morphospace. In this mode, the centroid of occupied morphospace shifts position. Possible examples of this are seen in the response of ammonoids to the Kellwaser and Hangenberg events (Korn et al. 2013).
Additionally, Lamsdell & Selden (2017) examined the disparity of eurypterids and suggested that even when mass extinctions remove morphologies with a high degree of apparent randomness, recovery (i.e. re-expansion following a morphological bottleneck) is often limited to those taxa that share a limited range of morphologies. This finding is consistent with the work of Thorne et al. (2011), Congreve et al. (2018) and Sclafani et al. (2019).
The disparity of phylogenetic groups tends to decrease over time, particularly during the interval immediately before or after a mass extinction (Zelditch et al. 2003). Valentine (1995) suggested that this may be due to a decrease in available ecological habitats, while Gould (1991) suggested that it may result from an increase in developmental constraints. Crônier expanded on this idea of developmental constraint in her work on phacopid trilobites (Crônier & Courville 2003; Crônier et al. 2005, 2011; Crônier & Fortey 2006; Crônier 2007, 2010, 2013). Her findings demonstrated that changes in the timing of development (i.e. heterochrony) were an important source of disparity in trilobites. In times of ecological stress, such as sealevel rise, trilobites tended to revert to more juvenile (paedomorphic), presumably less specialized forms (Crônier 2013). This reduced overall disparity by encouraging generalist morphologies.
Extinction events can also have a variety secondary or indirect effects on disparity and diversity. These can include adaptive radiations (Sundberg 1996; Bapst et al. 2012), in which disparity and diversity both increase rapidly after a period of sharp decrease. Alternatively, disparity may fail to recover despite modest gains in diversity (Thorne et al. 2011; Ruta et al. 2013).
To understand the various responses to mass extinctions, further case studies are needed. No previous study has explicitly explored the disparity of Harpetida and many fundamental questions about harpetid morphology and phylogeny remain unanswered (Ebach & McNamara 2002). Moreover, the question of selectivity in the Late Ordovician mass extinction remains open (Adrain et al. 1998; McGhee et al. 2004; Finnegan et al. 2012, 2016; Sclafani et al. 2019), especially with regard to trilobites (Chatterton & Speyer 1989; Congreve & Lieberman 2011; Congreve 2013a,b). In using harpetid disparity to explore selectivity during the Late Ordovician mass extinction, this work seeks to shed light on both of these issues.
Material and method
Phylogenetic methods
We summarized harpetid morphology in the form of a discrete character matrix (Beech & Lamsdell 2021), drawing upon the published trilobite literature. We drew many characters in this matrix from the Treatise on Invertebrate Paleontology (Fortey & Owens 1997) and from Ebach & McNamara (2002), which was a review of harpetid systematics that presented a number of discrete morphological characters (between 3 and 26 for each genus, exclusively concerning the cephalon and related structures) that were incorporated into several genus-level character matrices. Our study elevated this work to the ordinal level by synthesizing the relevant characters from these genus-level matrices together with characters drawn from the Treatise and direct observations of specimens housed at the Yale Peabody Museum of Natural History.
We coded 76 discrete morphological characters (Appendices S1, S2; Beech & Lamsdell 2021), consisting of 69 cephalic characters, three thoracic characters and four pygidial characters. We included data coded from 47 species, using 35 museum specimens observed first-hand, 14 museum specimens observed digitally, and c. 160 published figures. The coded taxa included 21 of the 29 recognized harpetid genera and included multiple representatives of each of the three previously recognized harpetid families: Entomaspididae, Harpididae and Harpetidae. The remaining 8 genera, Chencunia Qiu, 1984; Kathrynia Westrop, 1986; Palaeoharpes Lu & Qian in Zhou et al., 1977; Dictyocephalites Bergeron, 1895; Kitatella Petrunia in Khalfin, 1960; Metaharpides Pillet & Courtessole, 1981; Paraharpides Pillet & Courtessole, 1981; and Pscemiaspis Abdullaev & Khaletskaya, 1970 were excluded due to the difficulty of procuring adequate fossil material or figures from which to code character states (Table 1); the harpidid genus Chencunia, for example, is currently known only from a few partial pygidia from the upper Cambrian of China (Qiu 1984). Six ptychopariid trilobites were included as outgroup taxa, with the analysis rooted on a seventh outgroup, the redlichiid Eoredlichia intermedia Lu, 1940.
| Genus | Included |
|---|---|
| Baikadamaspis | Y |
| Bohemoharpes | Y |
| Bowmania | Y |
| Brachyhipposiderus | Y |
| Chencunia | N |
| Conococheaguea | Y |
| Dictyocephalites | N |
| Dolichoharpes | Y |
| Dubhglasina | Y |
| Entomaspis | Y |
| Eoharpes | Y |
| Eskoharpes | Y |
| Globoharpes | Y |
| Harpes | Y |
| Harpides | Y |
| Heterocaryon | Y |
| Hibbertia | Y |
| Kathrynia | N |
| Kielania | Y |
| Kitatella | N |
| Lioharpes | Y |
| Loganopeltis | Y |
| Loganopeltoides | Y |
| Metaharpides | N |
| Notchpeakia | Y |
| Palaeoharpes | N |
| Paraharpides | N |
| Pscemiaspis | N |
| Scotoharpes | Y |
To test harpetid monophyly, we needed to include several ptychopariids in our data matrix, given that it could not be known which ptychopariid taxa would prove most closely related to Harpetida. Lamsdell & Selden (2015) included both ptychopariids and harpetids in a data matrix designed to robustly test the monophyly of proetid trilobites. The work suggested several ptychopariid genera as viable candidates for inclusion in our new matrix, including Modocia, Coosella, Crepicephalus and Tricrepicephalus. These four taxa represent a broad sampling of Ptychopariida, capturing much of the disparity of the group. In addition, we chose to include representatives of the ptychopariid genera Cedaria and Ptychoparia. The similarity between these trilobites and the members of Harpetida has been noted by Rasetti (1945) in his work on the more basal members of the order (i.e. the entomaspidids). The notion of including a trinucleid trilobite (order Asaphida) was considered and eventually discarded on the basis of the high degree of morphological convergence currently assumed between trinucleid and harpetid trilobites (Adrain et al. 2004). To provide structure, the outgroup was rooted on Eoredlichia intermedia, from the paraphyletic order Redlichiida, which is thought to be the group that gave rise to Ptychopariida during the early to middle Cambrian (Hughes 2007; Hou et al. 2008; Dai & Zhang 2013).
We performed parsimony analysis in TNT (Tree analysis using New Technology) (Goloboff et al. 2008). The data matrix was subjected to cladistic analysis, using random addition sequences followed by tree bisection–reconnection (TBR) branch swapping with 100 000 repetitions with all characters unordered and of equal weight; for more on the subject of differential character weighting see Congreve & Lamsdell (2016). We also conducted Bayesian inference analyses in MrBayes 3.2.6 (Huelsenbeck & Ronquist 2001) with four independent runs of 100 000 000 generations and four chains each under the maximum likelihood model for discrete morphological character data (Mkv + Γ: Lewis 2001), with gamma-distributed rate variation among sites. All characters were treated as unordered and equally weighted (Congreve & Lamsdell 2016). Trees were sampled with a frequency of every 100 generations, resulting in 1 000 000 trees per run. The first 25 000 000 generations (250 000 sampled trees) of each run were discarded as burn in, and the 50% majority rule consensus tree calculated from the remaining 750 000 sampled trees across all four runs. Posterior probabilities were calculated from the frequency at which a clade occurred in the sampled trees included in the consensus tree.
Disparity methods
The disparity analysis relied on scripts written in R, adapted from the work of Hughes et al. (2013). Discrete morphological characters from the character matrix were converted to generalized pairwise Euclidean distances (GED). These distances differ from the other most commonly used distance metric, Gower’s coefficient (GC) (Gower 1971), primarily in the ways they handle missing data. The GED metric inserts a weighted mean fractional univariate distance based on those distances that are calculable, while the GC metric simply rescales calculable distances based on the amount of information available. Our GED distances were then combined with the known age ranges of harpetid taxa to track changes in disparity over geological time. Disparity was quantified based on the sums of ranges (measuring amount of morphospace occupied) and of variances (measuring dispersion of taxa around group centroids) (Foote 1992b; Wills et al. 1994; Ruta et al. 2013). We binned taxa from the matrix by geological age and produced morphospace plots, each representing the suite of available morphologies at a different point in the history of Harpetida. Multivariate statistical tests (permutational multivariate analysis of variance using the Euclidean distance measure, PERMANOVA) were performed in PAST (Hammer et al. 2001) to test the significance of overlap and separation of groups of taxa across all axes between time bins at the period, stage, and epoch levels (Anderson 2017). Significance was estimated by permutation and resampling of the taxa across groups with 9999 replicates. Statistical analysis was performed with and without Bonferroni correction to control the familywise error rate (Dunn 1961; Armstrong 2014). Particular attention was devoted to changes across the Late Ordovician mass extinction boundary. Bonferroni corrections have been criticized as overly conservative (Sokal & Rohlf 1995; Moran 2003; Nakagawa 2004; Garamszegi 2006) but for this study we found it appropriate to skew against false positives.
Additionally, PERMANOVA tests were used to verify that harpetids belonging to different taxonomic families occupied significantly different areas of morphospace. This method explored the possibility of correlation between harpetid distribution in morphospace and phylogenetic clade membership.
We included reconstructed ancestors in addition to the sampled taxa to phylogenetically correct for intervals of low sampling. We generated these according to the methods described by Brusatte et al. (2011) and Halliday & Goswami (2016). We mapped reconstructed characters onto the nodes of the parsimony consensus tree using Mesquite (Maddison & Maddison 2018) and coded each node as if it were a sampled taxon. Thirty-six reconstructed harpetids were generated in all. These reconstructed taxa were assigned age ranges using the extended punctuational method (Halliday & Goswami 2016). This method treats the ancestral morphology as occurring along the entire phylogenetic branch so that the total morphological disparity of each time bin can be accurately assessed (Halliday & Goswami 2016).
Results
Phylogenetic analysis
The parsimony analysis yielded 18 most parsimonious trees with an ensemble consistency index of 0.456, an ensemble retention index of 0.815, a rescaled consistency index of 0.572, and a tree length of 189. A strict consensus of these trees is shown in Figure 3. Bayesian inference analysis retrieved a broadly similar set of relationships, also shown in Figure 3. The parsimony strict consensus tree showed a monophyletic Harpetida preceded by a paraphyletic grade of ptychopariid trilobites. In the Bayesian analysis Ptychoparia striata appeared as the sister to group to Harpetida (Fig. 3).
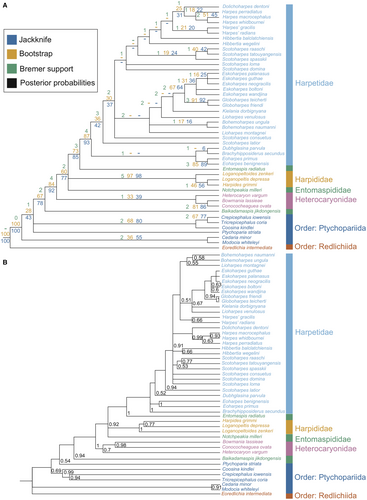
Two of the three previously recognized harpetid families (Harpetidae and Harpididae) were retrieved as monophyletic groups in both Bayesian and parsimony analyses. By contrast, Entomaspididae consistently appeared as a polyphyletic grade of basal harpetids, with Harpididae clustered within Entomaspididae. The entomaspidid Baikadimapsis jikdongensis appeared as the sister to all other harpetids in both Bayesian and parsimony analyses.
Three taxa previously assigned to Harpetidae (Conococheaguea ovata, Bowmania lassieae and Heterocaryon vargum) also fell within the entomaspidid grade. In both Bayesian and parsimony analyses, these three taxa formed a clade within the entomaspidid grade, which may indicate support for a monophyletic Heterocaryonidae.
The remaining harpetidids formed a large clade. This group included representatives of many recognized harpetid genera. Of these, Eoharpes, Dubhglasina, Brachyhipposiderus, Bohemoharpes, Kielania, Globoharpes, Eskoharpes and Dolichoharpes appeared as monophyletic in both Bayesian and parsimony analyses. In the parsimony analysis Hibbertia appeared as a paraphyletic grade, while Scotoharpes was found to be polyphyletic. Bayesian analysis retrieved a monophyletic Hibbertia but a paraphyletic Scotoharpes. Both analyses found Lioharpes to be polyphyletic and Harpes to be either polyphyletic or paraphyletic. Collectively this group corresponded well with the established harpetid family Harpetidae and is defined by a wide bilamellar brim, marginal sutures, and small, tuberculate eyes. The entomaspidid trilobite Entomaspis radiatus was retrieved as the sister group to Harpetidae in both analyses.
Disparity analysis
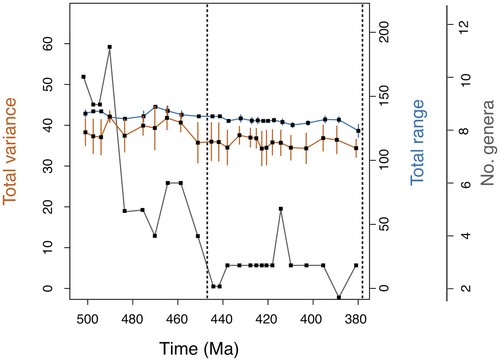
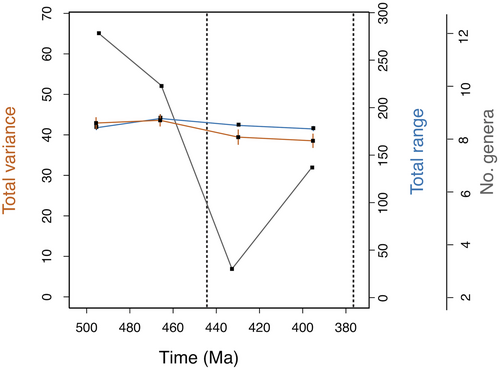
Disparity levels remained largely stable within Harpetida over time. Analyses at the stage and epoch level failed to show statistically significant changes in the sum of variances over time (Fig. 4), but analysis at the period level suggested that harpetid disparity reached a modest maximum in the Ordovician and then declined steadily until the group’s extinction in the Late Devonian (Fig. 5). At all levels of analysis, the sum of ranges likewise showed a slow overall decline following a modest peak in the Ordovician (Figs 4, 5).
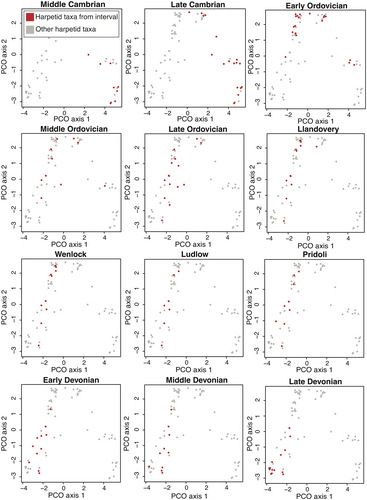
Harpetid morphospace occupation remained statistically significantly different for all four time periods (Table 2; Fig. 6). From their initial occupied region of morphospace, early harpetids expanded their overall morphospace occupation as the group diversified and then underwent a migration in occupied morphospace by egression through extinction of their ancestral morphospace region and preferential radiation within the newly occupied area of morphospace, so that from the Middle Ordovician onward morphospace occupation had been largely inverted, with overall morphospace occupation decreasing only slightly as the group transitioned into the Silurian. Originations continued across this newly defined region of morphospace until the Late Devonian, when another shift occurred, with the centroid moving toward what had previously been the margins of occupied morphospace, again driven by preferential extinction within specific sub-regions of morphospace.
| Cambrian | Ordovician | Silurian | Devonian | |
|---|---|---|---|---|
| Cambrian | – | 16.09 | 26.03 | 28.32 |
| Ordovician | 0.0006 | – | 3.613 | 8.482 |
| Silurian | 0.0006 | 0.0012 | – | 5.626 |
| Devonian | 0.0006 | 0.0006 | 0.0006 | – |
- PERMANOVA test results of Harpetida, including reconstructed ancestors, (permutations, n = 9999, total sum of squares = 9731, F = 13.6, p (same) = 0.0001) for statistical differences between taxa for each of the four period-level time bins based on principal coordinate analyses. Values in non-italic font are for the Bonferroni corrected p-values, those in italic are the raw F-values.
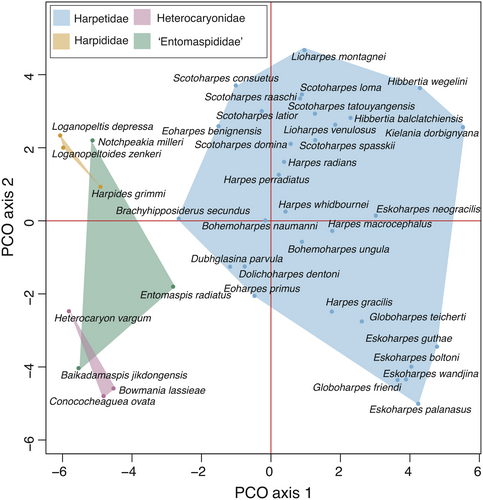
As expected, harpetid distribution in morphospace is largely correlated with phylogenetic clade membership. PERMANOVA testing of family-level partitions showed highly significant statistical differences in the morphospace occupied by each putative harpetid family, with the lowest levels of significance seen between Entomaspididae and Harpididae (Table 3). The most populous family, Harpetidae, occupied a distinct region of morphospace encompassing about half of the total occupied morphospace, including the regions occupied in the Middle Ordovician and Late Devonian. Harpididae, Heterocaryonidae and entomaspidids occupy overlapping regions of morphospace that include the regions occupied in the Cambrian and Early Ordovician (Fig. 7).
| Entomaspididae | Heterocaryonidae | Harpididae | Harpetidae | |
|---|---|---|---|---|
| Entomaspididae | – | 5.195 | 5.877 | 4.383 |
| Heterocaryonidae | 0.0006 | – | 12.66 | 10.42 |
| Harpididae | 0.0054 | 0.0006 | – | 7.76 |
| Harpetidae | 0.0006 | 0.0006 | 0.0006 | – |
- PERMANOVA test results of Harpetida (permutations, n = 9999, total sum of squares = 9105, within-group sum of squares = 7230, F = 7.521, p (same) = 0.0001) for statistical differences between taxa for each of the four harpetid families based on principal coordinate analyses. Values in non-italic font are for the Bonferroni corrected p-values, those in italic are the raw F-values.
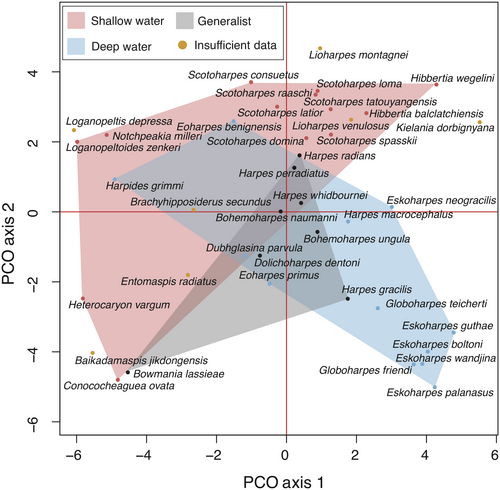
PERMANOVA testing showed that inferred shallow water harpetids occupied significantly different areas of morphospace than inferred deep water harpetids (Table 4). Shallow water taxa also occupied significantly different areas of morphospace than generalist taxa. However, generalist taxa did not occupy significantly different areas than deep water taxa (Table 4). Specifically, shallow water taxa occupy areas of harpetid morphospace including the Cambrian and Early Ordovician region as well as the region colonized during the Middle Devonian. Deep water taxa are predominantly located in the region of morphospace occupied in the Late Devonian (Fig. 8).
| Shallow | General | Deep | |
|---|---|---|---|
| Shallow | – | 1.944 | 2.147 |
| General | 0.0222 | – | 1.599 |
| Deep | 0.0294 | 0.246 | – |
- PERMANOVA test results of Harpetida (permutations, n = 9999, total sum of squares = 3634, within-group sum of squares = 3397, F = 1.603, p (same) = 0.003) for statistical differences between taxa for each of the habitat affinities based on principal coordinate analyses. Values in non-italic font are for the Bonferroni corrected p-values, those in italic are the raw F-values.
Discussion
Harpetid phylogeny
Harpetid monophyly
Both our Bayesian and parsimony trees show strong support for the monophyly of harpetids. They group separately from all of the varied ptychopariids included in the analysis, and represent a unique order within the subclass Librostoma.
Entomaspidid polyphyly
In the retrieved phylogenies, harpidids are nested within the polyphyletic entomaspidids. The harpidid clade includes all three of the harpidid taxa present in the data matrix and is defined by several morphological characters, such as a genal ridge running posterolaterally from the eye; concave genae; radiating, anastomosing genal cacae; an expanded L3; and the lack of genal spines. In addition, some (although not all) harpidids are distinguished by marginal sutures. Importantly, this suggests that the so-called ‘hypoparian’ suture condition, in which the cephalic sutures skirt the margin of the cephalon (Raw 1949), emerged at least twice in the harpetids: once in the harpidids and once again in the harpetidids. Given the number of morphological characters uniting the recognized harpidids, it seems desirable to retain the family Harpididae, although the group currently falls within the entomaspidid grade.
Three taxa previously assigned to the harpetidids (Conococheaguea ovata, Bowmania lassieae and Heterocaryon vargum) also form a small clade within the entomaspidid grade. That these three should resolve here, rather than among the harpetidids, is perhaps unsurprising given their unusual morphology. For example, none of these taxa displays the usual harpetid brim (Fig. 2). Bowmania instead sports a wide fringe of radiating spines (Ludvigsen 1982; Adrain & Westrop 2004) that may have performed a similar ecological function, making it perhaps the most morphologically unusual of all harpetids. Meanwhile Conococheaguea and Heterocaryon have no brim-equivalent structure, only a narrow trough (Rasetti 1959; Adrain & Westrop 2004). Moreover, these taxa lack other key harpetidid synapomorphies, such as a tuberculate eye structure, alae, marginal sutures, and broad, flattened genal prolongations.
The genera Conococheaguea, Bowmania and Heterocaryon should be removed from the harpetidids and assigned to a separate family. Heterocaryon was once the type for the trilobite family Heterocaryonidae, proposed by Hupé (1953). The family is no longer recognized, due to the supposed similarity between the genera Heterocaryon and Bowmania and the genus Entomaspis in both cephalic and pygidial structure (Ludvigsen 1982). However, these findings indicate that the name could be resurrected to describe this new clade of harpetids, which until this point have remained largely in a taxonomic limbo (Hupé 1953; Rasetti 1959; Jell & Adrain 2002). This new incarnation of the family Heterocaryonidae is defined by a few key synapomorphies, including high cephalon convexity and equilateral glabellar lateral margins.
Harpetidid genera
With Conococheaguea, Bowmania and Heterocaryon recognized as heterocaryonidids, the harpetidids resolve as a clade. They are the largest harpetid family and include many currently recognized genera. However, the monophyly of several of these genera now appears dubious.
The genus Scotoharpes is clearly polyphyletic. Most species of the putative genus form a loose grouping, with a clade of three taxa (‘Scotoharpes’ spasski, ‘Scotoharpes’ tatouyangensis and ‘Scotoharpes’ raaschi) forming a polytomy with two other Scotoharpes species, as well as a substantial clade of other harpetidids. Yet even if these two Scotoharpes (‘Scotoharpes’ loma and Scotoharpes domina, the type species for the genus) group with the others, this grouping would be paraphyletic. There are also two other supposed Scotoharpes (‘Scotoharpes’ latior and ‘Scotoharpes’ consuetus) that fall much more basally within the harpetidids and do not appear closely related to each other. Therefore, Scotoharpes monophyly is rejected.
Some characters that were supposedly diagnostic for Scotoharpes, such as a glabella that is longer than it is wide, deep posterior glabellar furrows, the absence of a large anterior boss, and the anterior–posterior position of the eyes (Ebach & McNamara 2002), now appear plesiomorphic for harpetidids. Others, such as low alae, deep pits demarcating the outer margin of the genal roll, and a flat preglabellar field, appear in only some species of the genus. This finding supports the assessment of Ebach & McNamara (2002), who noted in passing that Scotoharpes might very well be non-monophyletic and consist of several clades, describing the genus as a ‘dumping ground’.
Lioharpes also appears to be polyphyletic. The two species in this analysis resolve in a polytomy in the parsimony consensus tree and resolve as polyphyletic in the Bayesian tree. As with Scotoharpes, the members of Lioharpes seem to share a generalized harpetid morphology, with little to unite them in particular. For example, the radiating ridges found at the genal roll–brim boundary, thought by Fortey & Owens (1997) to be diagnostic for Lioharpes, are also seen in other harpetidid genera such as Bohemoharpes and Scotoharpes (Norford 1973; Ebach & McNamara 2002). Likewise, the narrow alae seen in Lioharpes are also seen in some species of Scotoharpes, Dubhglasina and Brachyhipposiderus, suggesting that this character is plesiomorphic for harpetidids (Norford 1973; Ebach & McNamara 2002).
The genus Helioharpes has already been identified as a subjective synonym of Harpes by Jell & Adrain (2002). This study supports this conclusion; both species of ‘Helioharpes’ included in our analysis independently appear as sister taxa to separate clades of Harpes. In fact, recognition of the synonymy of Harpes and Helioharpes suggests that Harpes may be monophyletic, given that all ‘Helioharpes’ and Harpes in this analysis form a single clade. However, this clade also contains the genus Dolichoharpes.
Several potential solutions exist. One is simply to synonymize Dolichoharpes with Harpes. This would create a monophyletic Harpes, but may seem unsatisfactory, given that many species of Dolichoharpes have a distinctive appearance that is different from other harpetidids (Whittington 1949). In particular, the genal prolongations of Dolichoharpes often appear narrower than those of Harpes and sometimes dramatically so, as in the case of Dolichoharpes dentoni (the representative of the genus included in this analysis; see Fig. 1). However, this striking change in appearance is achieved by a relatively small angular rotation of the genal spines, and Harpes and Dolichoharpes are united by many other, subtler morphological similarities. For example, anterolaterally directed eye ridges appear to be a synapomorphy of Dolichoharpes and Harpes (including ‘Helioharpes’) (Ebach & McNamara 2002). Therefore, it may be best to treat Dolichoharpes in synonymy with Harpes, or to acknowledge that Harpes may consist of multiple recognizable genera. Complicating the issue is that fact that Harpes is another phylogenetic ‘dumping ground’ (Ebach & McNamara 2002) for ambiguous harpetid taxa. As such, Harpes (as presently conceived) may well be genuinely polyphyletic, consisting of two related but distinct clades, each also closely related to Dolichoharpes. In this case, the clade containing the type species, Harpes macrocephalus, would be the genuine Harpes, while the other may represent a novel genus.
Another possible instance of paraphyly is seen in Hibbertia. The two species of Hibbertia included in this study appear in the parsimony consensus tree as a grade leading to the problematic Harpes and/or Dolichoharpes clade discussed above. However, in the Bayesian tree Hibbertia resolves as a clade. Further research is needed to fully assess the monophyly of this genus.
All other harpetidid genera included in this analysis appear to form monophyletic groups. Some of these are represented by only one species, and so their monophyly has yet to be genuinely tested; such is the case for Kielania, Brachyhipposiderus and Dubhglasina. Other genera, such as Globoharpes and Eskoharpes, appear well supported. Eskoharpes is particularly notable given that its clade includes ‘Harpes’ neogracilis, supporting its transfer to Eskoharpes by McNamara et al. (2009).
Disparity in Harpetida
Disparity through time
In the disparity-corrected analysis, the sum of ranges and sum of variance (Figs 4, 5) both show only a muted peak in harpetid disparity during the Ordovician. If genuine, this early peak may represent the initial diversification of harpetids, which would be consistent with the work of previous researchers (Foote 1997; Hughes et al. 2013) who found that clades generally morphologically diversify early in their history.
No abrupt Late Ordovician decline is seen in harpetid disparity (Figs 4, 5). Instead, disparity appears to decrease slowly and steadily from the Late Ordovician onward. The rate of decrease does not significantly increase during the Late Ordovician mass extinction. This finding closely resembles that of Ruta et al. (2013), which showed that anomodont therapsid disparity decreased steadily over time, relatively unaffected by the end-Permian mass extinction. More broadly, these findings might be said to agree with those of Lupia (1999), who showed that the rate and character of change in the disparity of Late Cretaceous angiosperms was not altered by the end-Cretaceous mass extinction, and with Zelditch et al. (2003), whose work with piranha suggested that disparity tends naturally to decay over time. This scenario also shows that disparity and diversity were significantly decoupled in harpetids, which supports the idea that disparity and diversity are frequently decoupled (Foote 1993; Lupia 1999; Thorne et al. 2011; Hopkins 2013; Ruta et al. 2013).
The fact that harpetids in particular were relatively unaffected by the Late Ordovician mass extinction may perhaps be explained by their life history strategy. Harpetid larvae are thought to have been benthic rather than planktonic (Chatterton & Speyer 1989). In this they resemble sphaerexochine trilobites, which also had benthic larvae and were largely unaffected by the Late Ordovician mass extinction. Both of these examples agree with the general findings of Chatterton & Speyer (1989), who concluded that trilobites with benthic larvae were generally far more resilient to the Late Ordovician mass extinction.
Despite their resilience, harpetid disparity remained low or continued to fall from the Late Ordovician onward, until the group went extinct at the end of the Devonian; no long-term recovery of disparity could be discerned (Figs 4, 5). This finding is again consistent with that of Ruta et al. (2013) and also Thorne et al. (2011), who found that ichthyosaurs failed to fully recover their former disparity following the end-Triassic mass extinction. These cases are analogous to that of a ‘dead clade walking’ or DCW (Jablonski 2002), that is, a clade that fails to recover in terms of taxonomic diversity following a mass extinction. However, the failure of a clade to recover in terms of disparity (rather than diversity) in the aftermath of an extinction event lacks a widely accepted name. The authors submit the term ‘fixed clade walking’ or FCW as a possible designation for such cases, to mirror the cadence of the term ‘dead clade walking’ while emphasizing a loss of morphological variability.
The concept of an FCW is related to, but not synonymous with, the concept of stabilomorphy (Kin & Błażejowski 2014). On its surface, an assessment of stabilomorphy simply observes that a group of organisms (such as harpetids) remains relatively morphologically stable over time and space. However, Kin & Błażejowski (2014) also explicitly link stabilomorphy to successful adaptation, writing of stabilomorphs ‘…their level of adaptation, the quality of their adaptive strategy is so high (so effective), that small changes which had to continually occur over several millions years…did not result in any significant morphology variations.’
In contrast, the term ‘fixed clade walking’ claims no relationship between a loss of morphological variability and successful adaptation. Instead, an FCW implies a form of ‘survival without recovery’ (Jablonski 2001). Following a major perturbation, an FCW is unable to generate new morphologies, not because their adaptive strategy is beyond improvement, but because changed conditions suppress further morphological innovation.
Morphospace through time
Studying harpetid morphospace provides additional insights (Fig. 6). Early in their history, the morphospace occupation of harpetids expands considerably (Fig. 6). PERMANOVA testing confirms that Cambrian and Ordovician harpetid morphospace were statistically significantly different (Table 2). These changes support an assessment of early diversification and moreover show that harpetids were very morphologically dynamic during their early history. However, this dynamicity seems to wane somewhat as the order enters the Silurian. Although Silurian and Ordovician harpetid morphospace remain statistically different, the significance of this difference has declined (Table 2). In particular, the area of morphospace occupied during the Late Ordovician is quite similar to that occupied throughout the Silurian. Yet the sum of variance does gradually decline (Figs 4, 5), even while overall morphospace occupation changes little (Fig. 6). From this it seems clear that morphologies were being removed in a random, non-selective fashion (Korn et al. 2013). These losses were gradual, rather than occurring suddenly at the end of the Ordovician, indicating that harpetid morphospace was generally agnostic to the Late Ordovician mass extinction.
During the Devonian the centroid harpetid morphospace shifts once more, and the emergence of morphologically distinctive genera (Eskoharpes and Globoharpes) during this time suggests that the order retained some ability to innovate (Fig. 6). However, the scale of these shifts in morphospace is relatively small (Fig. 6), and overall measures of disparity continue their slow decline (Figs 4, 5). Harpetids lose access to large areas of morphospace and never regain any of the regions that they held prior to the end of the Ordovician (Fig. 6). From this, it seems evident that harpetids became less morphologically dynamic over their history. Other researchers have observed that groups emerge from mass extinction events lacking the ability morphologically or ecologically to diversify (Jablonski 2002; Thorne et al. 2011; Ruta et al. 2013). It is possible that, although the Late Ordovician mass extinction had little immediate impact on harpetid disparity, the biotic crisis nevertheless permanently damaged the ability of harpetids to generate new morphologies, supporting our description of the order as an FCW. These findings emphasize that the impacts of a mass extinction event can be complex and may take many millions of years to fully unfold.
Patterns of morphospace occupation
The phylogenetic signal within harpetid morphospace appears strong. Statistically significant differences are found between the areas of morphospace occupied by all four putative harpetid families (Table 3). Of these, three families also group well along principal coordinate (PCO) axis 1 and PCO axis 2 (Fig. 7). The polyphyletic entomaspidids (perhaps unsurprisingly) do not group well (Fig. 7). This group also shows the least statistically significant difference to another harpetid family, in this case the harpidids (Table 3).
Harpetids associated with deep water habitats occupy significantly different areas of morphospace than those associated with shallow water habitats (Table 4). This finding is consistent with the work of Hopkins (2014), which noted a strong environmental influence on patterns of disparity in trilobites, and emphasizes the way in which studies of disparity can bridge the gap between the ecological and the phylogenetic understanding of evolutionary history. One interesting detail of this analysis is that Bowmania emerges as a generalist harpetid, despite its unusual morphology. This places Bowmania into the same ecological category as taxa with a more generalized harpetid morphotype such as Harpes and Bohemoharpes, which appear quite distantly from Bowmania (Fig. 8). This may support the idea that Bowmania evolved a different solution to a recurring ecological problem, using a fringe of radiating spines in place of the familiar harpetid brim.
Systematic palaeontology
Class TRILOBITA Walch, 1771
Subclass LIBROSTOMA Fortey, 1990
Order HARPETIDA Whittington, 1959
Diagnosis
Cephalon subsemicircular to ovate in outline, with long genal prolongations (broad, flat) or spines (narrow, rounded). Glabella convex, narrowing forward, with up to three pairs of lateral glabellar furrows, preoccipital pair isolating triangular lateral lobes; occipital ring convex; preglabellar field sloping outward and downward to flat or upwardly concave fringe or bilamellar border; alae may be present; prominent eye lobes or tubercles centrally located on genae, with strong eye ridges and in some forms with genal ridges also; sutures commonly marginal except on dorsal side at genal angles, and (in genera with eye lobes) where sections of sutures run inward close together. Thorax with 12 or more segments; axis convex; pleurae flat, with broad pleural furrows. Pygidium short, subtriangular or elongate, with convex axis. Radiating, anastomosing genal caecae may be present on genae and preglabellar field, and extending onto fringe; external surface of cephalon may be tuberculate or granulose (modified from Fortey & Owens 1997).
Range
Upper Cambrian to Upper Devonian.
Family ‘ENTOMASPIDIDAE’ Ulrich in Bridge, 1931
Type genus
Entomaspis Ulrich in Bridge, 1931.
Included genera
Baikadamaspis Ergaliev, 1980; Entomaspis Ulrich, 1931; Notchpeakia Adrain & Westrop, 2006.
Diagnosis
Exoskeleton small. Cephalon semicircular, characterized by anterior and posterior sections of facial sutures close to each other, both directed outward and backward; librigenae fused together through doublure, consisting of narrow dorsal strips connecting eyes to margin and to genal spines (modified from Fortey & Owens 1997).
Remarks
The family Entomaspididae is resolved in the present analyses as polyphyletic and needs to be redefined so as to be monophyletic. The family is here used to denote various basal harpetids, with the quote marks denoting polyphyly.
Range
Upper Cambrian to Lower Ordovician.
Family HETEROCARYONIDAE Hupé, 1953
Type genus
Heterocaryon Raymond, 1937.
Included genera
Bowmania Walcott, 1925; Conococheaguea Rasetti, 1959; Heterocaryon Raymond, 1937.
Diagnosis
Angle of cephalic curvature greater than 90°. Yoked librigenae, but lacking true bilamellar fringe. Facial sutures directed outward and forward. Small eye lobes, diverging posteriorly, with eye ridges anterolaterally directed. High cephalon convexity and equilateral glabellar lateral margins. Highly convex genae. Lacking alae. Narrow, rounded genal prolongations (i.e. spines). Pygidium of four to eight segments.
Remarks
This family-level name has been resurrected to describe a clade including the genus Heterocaryon and two other taxa previously assigned to Harpetidae but whose unusual morphology otherwise placed them within the entomaspidid grade in these phylogenetic analyses.
Range
Upper Cambrian.
Family HARPIDIDAE Whittington, 1950
Type genus
Harpides Beyrich, 1846.
Included genera
Chencunia Qiu, 1984; Dictyocephalites Bergeron, 1895; Harpides Beyrich, 1846; Kitatella Petrunia in Khalfin, 1960; Loganopeltis Rasetti, 1943; Loganopeltoides Rasetti, 1945; Metaharpides Pillet & Courtessole, 1980; Paraharpides Pillet & Courtessole, 1980; Pscemiaspis Abdullaev, 1970.
Diagnosis
Cephalic border not sharply set off from convex genae and preglabellar field; alae small, semicircular; facial sutures marginal, or with parallel anterior and posterior sections running close to each other and directed anterolaterally from eye tubercles to margin; genal caeca radiating over cheek lobes and in some cases extending onto cephalic border. Hypostome subrectangular, length (sag.) equal to that of glabella. Thorax with 20 or more segments; axis narrow; long (tr.) pleurae curving back at outer part may be extended into spines, with deep pleural furrows and convex posterior bands (Fortey & Owens 1997).
Range
Upper Cambrian to Lower Ordovician.
Family HARPETIDAE Hawle & Corda, 1847.
Type genus
Harpes Goldfuss, 1839.
Included genera
Bohemoharpes Vanek, 1963; Brachyhipposiderus Jell, 1985; Dolichoharpes Whittington, 1949; Dubhglasina Lamont, 1948; Eoharpes Raymond, 1905; Eskoharpes McNamara et al., 2009; Globoharpes McNamara et al., 2009; Harpes Goldfuss, 1839; Hibbertia Jones & Woodward, 1898; Kathrynia Westrop, 1986; Kielania Vanek, 1963; Lioharpes Whittington, 1950; Palaeoharpes Lu & Qian in Zhou et al., 1977; Scotoharpes Lamont, 1948.
Diagnosis
Eye tubercles each with two lenses; semicircular alae adjacent to posterior glabellar lobes; bilamellar fringe with opposed pits in outer surfaces, genal rolls steeply sloping, brim gently sloping, with stout girder on lower lamella separating these two parts, flattened prolongations of fringe varying in length; cephalic suture skirts marginal band of fringe. Hypostome pear-shaped in outline, with ovate middle body, large anterior, small posterior, and wings. Thorax with 12–29 segments, pleurae bent down ventrally at tips. Pygidium small, short (sag.), triangular, with few segments. External surface of glabella and genae with raised ridges in reticulate pattern, tuberculate, or smooth; minute tubercles on fringe between pits and marginal band, on internal rim, and elsewhere (modified from Fortey & Owens 1997).
Range
Lower Ordovician to Upper Devonian.
Conclusion
The present study evaluates the morphology and evolution of harpetid trilobites, a group that has long been easily recognized but often incompletely understood. This study provides strong support for harpetid monophyly. Two of the three existing harpetid families have also been found to be monophyletic, while the third, Entomaspididae, has been found to be non-monophyletic. In addition, support has been found for the monophyly of a fourth harpetid family, the Heterocaryonidae, which unites several previously problematic taxa. At a finer taxonomic scale, several harpetid genera are found to be poorly supported (e.g. Scotoharpes, Lioharpes), while several others are found to be well supported (e.g. Eskoharpes, Globoharpes). Importantly, marginal sutures, a key innovation within Harpetida (Rasetti 1945; Ebach & McNamara 2002), are found to have arisen on at least two separate occasions in the order.
Harpetid disparity proves remarkably stable over geological time. A modest peak in the Ordovician is followed by a slow decline throughout the Silurian and Devonian. After the Ordovician, harpetids demonstrate little or no ability to colonize new areas of morphospace. This may represent a fundamental loss of morphological variability in the wake of the Late Ordovician mass extinction, a condition we here term ‘fixed clade walking’. These findings demonstrate that mass extinction events may have complex impacts that play out over many millions of years, affecting not only species diversity but also the range of living forms.
Acknowledgements
The authors would like to thank Kathleen Benison and Curtis Congreve for their invaluable feedback on the scope, specifics and presentation of this project. The authors are also grateful to Thomas Hegna for his expert advice on selecting an appropriate outgroup for Harpetida and to Karla Hubbard and Kirk Pearson for their comments on the ecological role of the harpetid brim. This work would not have been possible without the support of West Virginia University and the Yale Peabody Museum of Natural History and their Schuchert and Dunbar grants-in-aid program. Moreover, the authors would like to thank Susan Butts and Jessica Utrup for all their help in accessing and analysing harpetid trilobite fossils. The authors also thank Marcello Ruta and an anonymous reviewer for their detailed comments that greatly improved the manuscript. JCL is supported by National Science Foundation CAREER award EAR-1943082 ‘Exploring environmental drivers of morphological change through phylogenetic paleoecology’.
Author contributions
JCL conceived of the initial study; JDB and JCL developed the study; JDB gathered the study data; JDB performed analyses with input from JCL; JDB and JCL interpreted the results of the analyses; JDB and JCL wrote the manuscript.
Open Research
Data archiving statement
Data for this study, including a full set of character state illustrations, are available in MorphoBank (O’Leary & Kaufman 2012): http://morphobank.org/permalink/?P2804 This is Paleobiology Database official publication number 399.


