SERS Sensing of Dopamine with Fe(III)-Sensitized Nanogaps in Recleanable AuNP Monolayer Films
Abstract
Sensing of neurotransmitters (NTs) down to nm concentrations is demonstrated by utilizing self-assembled monolayers of plasmonic 60 nm Au nanoparticles in close-packed arrays immobilized onto glass substrates. Multiplicative surface-enhanced Raman spectroscopy enhancements are achieved by integrating Fe(III) sensitizers into the precisely-defined <1 nm nanogaps, to target dopamine (DA) sensing. The transparent glass substrates allow for efficient access from both sides of the monolayer aggregate films by fluid and light, allowing repeated sensing in different analytes. Repeated reusability after analyte sensing is shown through oxygen plasma cleaning protocols, which restore pristine conditions for the nanogaps. Examining binding competition in multiplexed sensing of two catecholamine NTs, DA and epinephrine, reveals their bidentate binding and their interactions. These systems are promising for widespread microfluidic integration enabling a wide range of continuous biofluid monitoring for applications in precision health.
1 Introduction
Continuous monitoring, diagnostic devices, and precision health have become of significant societal interest but require improved detection of meaningful target biomarkers. Neurotransmitters (NTs) are key biomarkers since they control an array of biological and physiological processes as chemical messengers that transmit electrochemical signals.[1, 2] An imbalance or dysregulation of particular neurotransmitters, such as dopamine (DA), is linked to diverse neurological and psychiatric disorders such as Parkinson's disease,[3] schizophrenia,[4] Alzheimer's, depression,[5] and attention deficit-hyperactivity disorder (ADHD).[3] DA also influences cognitive behavior, including mood, concentration, and motivation, as well as metabolism and functions of the immune system.[6, 7]
To understand the intricate changes in neurochemistry, as well as a holistic understanding of the influence of DA in physiological processes, a highly sensitive, selective, and accurate quantitative sensing platform that can be used frequently with nanomolar levels of detection is required.[8] Several conventional techniques to detect neurotransmitters include the classic electrophysiological methods by measuring the changes in membrane currents,[8, 9] or more technically-demanding high-performance liquid chromatography, mass spectrometry,[10] fluorescence detection,[1] ELISA, capillary electrophoresis,[11] and microdialysis.[2, 12] Nonetheless, all techniques face the same fundamental challenges which are imposed by the inherently low concentration of neurotransmitters in biofluids, by the chemical structural similarities between different neurotransmitters decreasing selectivity, and by the resulting very restricted sampling intervals.[13] Furthermore, these conventional techniques are all limited by long operation times, large sample volumes, requirements for bulky instrumentation, labor-intensive operation, and the need for highly trained personnel, which are all costly.[1, 14]
To move toward innovating the next generation of personalized point-of-care medical sensors, key challenges must be tackled including integration, improved sensitivity of analytes, reproducibility, reusability, and multiplexed sensing. A promising emerging technique addressing these challenges is based on optical sensing using surface-enhanced Raman spectroscopy (SERS). SERS exploits the plasmonic properties of metal nanostructures where light couples to collective electron oscillations (plasmons) in the metal. These plasmons allow optical fields to be focused below the diffraction limit, down to dimensions approaching molecular length scales.[15] The spatially-localized optical fields known as hotspots are typically formed in gaps or at the edges of self-assembled nanostructures.[16, 17] The resulting plasmonic field enhancements greatly enhance impinging light, as well as its consequent Raman scattering from molecules. The signature vibrational SERS fingerprints recorded from different molecules (which do not need analyte labeling) enable multiplexing, and its exceptional sensitivity down to real-time single molecule specificity[18-21] has the potential to deliver a low-cost solution to bioanalyte sensing. However, suitable flow-based reusable and reproducible SERS platforms are challenging to deliver. At the same time, a detailed understanding of the SERS sensing process has been hindered by the lack of precise knowledge about molecular binding, surface chemistries, nanoscale geometries, and their interplay.
Here, we describe a versatile SERS platform and its use for quantifying catecholamine neurotransmitters, which reveals analyte binding and competition, and attains effective reusability. While signal enhancements are relatively easy to obtain with SERS substrates, detailed control of the precise hotspot geometry is mostly lacking, leading to irreproducible/unpredictable signals when anything other than simple thiolated targets or dyes are used.[22] When self-assembled Au nanoparticles (AuNPs) are optimally aggregated to form nanogap hotspots, these deliver archetypal substrates due to their reproducibility, ease of fabrication, scalability, low cost, and accuracy (Figure 1).[22] However aggregating AuNPs in solution (“Solagg”, Figure 1a) using a gap-defining molecule or salt as the coagulant, yields suspended SERS-active substrates which experience Brownian motion requiring large focal volumes to allow averaging of SERS signals, interference from aggregating agents, and restricts any scope for reusing or cleaning the system. In addition, the difficulty of controlling the number of active nanogaps compared to the bulk analyte concentration restricts detection limits.
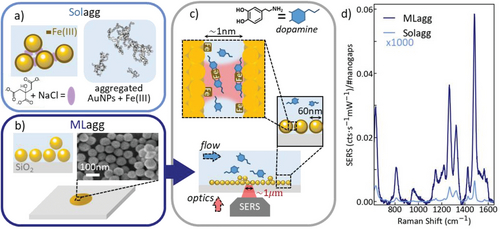
A new approach is to aggregate AuNPs into 2D random close-packed arrays, immobilizing them onto a substrate that fixes the nanogap positions and spacings for further treatment. These monolayer aggregate films (MLagg, Figure 1b) can be reliably formed through liquid–liquid interface assembly,[23] and transferred to any desired substrate (here Raman-grade glass). The resulting low-tortuosity molecular access into the nanogaps gives effective analyte access from fluids, vapors, or gases flowing over the MLagg. At the same time, light directly probes the same nanogaps from the opposite side (Figure 1c), giving a favorable device geometry (compared to for instance optically-opaque electrochemically-roughened Ag, or colloidally-sedimented nanoparticles). Another key hallmark of employing nanogaps immobilized as a film on a substrate is the ability to clean and reuse them, which is optimal for applications of such sensors in point-of-care technologies. Both acid (HCl) and oxygen plasma treatments are found here to thoroughly clean all organic molecules off the nanogap surfaces to reinstate pristine surface chemistry.[24, 25] This transforms the ability to maintain consistency and reproducibility of sensor performance, especially as it removes all potential interfering aggregating agents, as well as capping agents such as citrate.[26] Finally, substrate-immobilized nanogaps can be integrated into microfluidic systems, for instance for monitoring fractionation, or as a SERS substrate suitable for in situ cleaning and calibration against standards for quantification.
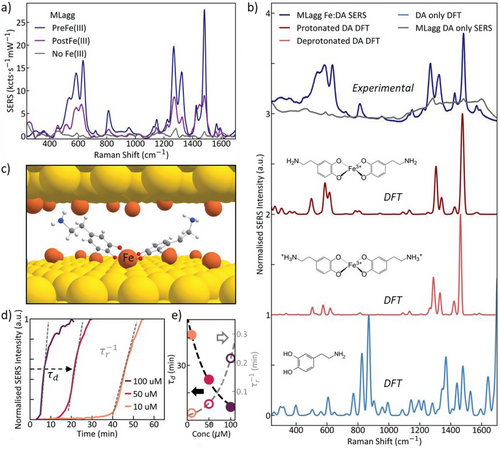
However, the affinity of NTs for such substrates is too low for MLagg films to facilitate NT sensing at clinically relevant concentrations (Figure 2a “No Fe”), which this work addresses. By utilizing MLagg films, we outline how NT sensing is optimized by exploiting the complexation of Fe(III) and catecholamines[27-32] to demonstrate nanomolar sensitivity. We find MLagg films outperform the Solagg colloids by a factor of 5000 in terms of SERS intensity per hotspot and implement a cleaning treatment for repeated flow sensing through plasma cleaning protocols with good repeatability. We elucidate factors that play key roles in the surface chemistry of analyte binding which influences quantitative measurements. Finally, we explore competitive binding mechanisms and vibrational coupling between different NTs (DA and epinephrine (EPI)) for multiplexed sensing.
2 Results and Discussion
Recent work has demonstrated that Solaggs can be sensitized more specifically to catecholamine NTs by incorporating Fe(III) ions into the SERS substrate.[32] It is believed that Fe(III) attaches to the Au surface and then binds NTs into the hotspots. Two protocols for introducing Fe(III) were explored, either where Fe(III) is introduced simultaneously with DA after the AuNP aggregation process (PostFe), or by prior incubation of the AuNP constituents with Fe(III) solution before the AuNP aggregation (PreFe). This work showed that the presence of Fe(III) is crucial for detecting NTs and that the PreFe protocol gives the best results, allowing nanomolar NT detection. It suggests that individual NTs diffuse more readily into the nanogaps (compared to first forming the larger Fe complex), where they then bind to surface-bound Fe(III).
The same protocols are now applied to MLagg films, with an additional initial precleaning process using oxygen plasma (see Experimental Section). The PreFe protocol is found to be three times more sensitive than PostFe, with a 30-fold increase over no Fe(III) sensitization (Figure 2a). This confirms that MLagg films behave similarly to Solaggs seen before.[32] For both PreFe and PostFe sensing, DA peaks are observed at 812, 1269, 1324, 1425, and 1482 cm−1 which can be assigned to the well-documented iron catechol complex of DA[27, 28, 30, 33-36] and matches with density functional theory (DFT) calculations regardless of the NT protonation state (Figure 2b).
Furthermore, comparing the sensitized MLagg with the sensitized Solagg (Figure 1d), we find that when normalizing for power, time, and the number of hotspots (Section 1, Supporting Information), 5000-fold stronger signals for the MLagg system are achieved per hotspot. This shows that the PreFe MLagg system provides the highest SERS response out of these protocols and is used here for the remaining characterization and optimization. This also permits lower laser power excitation (<1 mW) allowing cheaper and safer laser products to be implemented (such as Class 2 lasers), aiding the transition to miniaturized technology.
The trio of SERS peaks in the range of 450–600 cm−1 is attributed to iron-catechol complexation (Fe─O) bond vibrations,[27, 28, 30, 37, 38] and their changes with pH of the environment are attributed to either the mono-, bis-, or tris-complexation of DA to Fe(III). These peaks, therefore, allow us to distinguish between the different metal–ligand complexes.[28] In particular, the peaks at 585 and 633 cm−1 are assigned to the interaction between Fe─O (C3) and Fe─O (C4) stretches of the Fe-catechol bonds,[30, 38] which confirms the formation of DA:Fe(III) complexes. The peak at 530 cm−1 is assigned to the charge transfer interaction of the bidentate iron-catecholamine complex (Figure S1, Supporting Information, peak a). The relative ratio of the integrated 530 cm−1 peak compared to the 585 and 633 cm−1 peaks signals the coordination of the DA:Fe(III) complexation state.[28, 30, 38] The analysis here indicates that bis-complexation of NTs dominates for the Fe(III)-sensitized MLagg system (Figure 2c).
To determine the sensitivity and to optimize the performance of these sensors, it is important to determine the analyte diffusion and binding kinetics and resolve the key surface chemistries involved. The kinetic behavior of MLagg sensing is first tracked in time using the dominant SERS peak intensity at 1482 cm−1 for different DA concentrations varying from 10 to 100 µm (Figure 2d). This shows the SERS signals increase at an initially near-linear rate, but only after a characteristic offset delay (τd), which corresponds to stripping off a protective molecular coating in the nanogaps (see discussion below). Smaller DA concentrations are seen to increase the offset time, and to slow analyte diffusion into the hotspots () (Figure 2e). These parameters are extracted from fitting the concentration data to a Langmuir isotherm model[39] (Figure 2d). The unexpected offset delay observed implies the existence of surface protection that must be overcome before DA can bind with the Fe(III) and be detected. To understand this, the surface chemistry is analyzed at several stages of the MLagg fabrication process.
After the AuNPs are first aggregated into MLagg films, the background from these bare films (Figure 3a, yellow) produces initial SERS spectra with multiple broad peaks from 1100 to 1600 cm−1. This highlights one of the key confounding factors in practical SERS sensing from surfactants and contaminants, both modifying surface binding and introducing unwanted vibrational lines. To condition a pristine surface, the MLagg then undergoes oxygen plasma treatment for 15 min. The oxygen plasma removes any organic deposits including all AuNP stabilizing/capping agents such as citrate.[23] After the oxygen plasma treatment, all organic peaks disappeared, leaving a broad gold oxide peak around 600 cm−1 (Figure 3a, blue). Residual oxidized citrate gives the 1050 cm−1 peak when treatment is not long enough.[40] The primed substrate from this repeatable cleaning protocol gives a newfound opportunity to reuse MLagg sensors even after loading the nanogaps with the analyte. This reuse delivers a key property for versatile long-term sensor use, since it is more sustainable, aids in reproducibility, and enhances accessibility for wider target users.
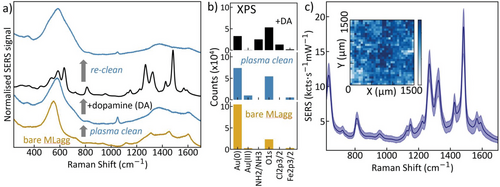
To demonstrate the effectiveness of this cleaning protocol, DA is now flown onto the plasma-cleaned MLagg giving large signals (Figure 3a, black) as before (Figure 2a). To further emphasize this control, after a subsequent plasma cleaning cycle no trace of DA is found (Figure 3a, blue).[23] This oxygen plasma cleaning treatment and re-exposure to the analyte can be repeated many times (Figure S3, Supporting Information), with the SERS DA signal remaining stable after an initial slow decrease over the first 11 cycles. No changes in vibrational fingerprint or uniformity across the sample are seen, with a decrease in statistical variability observed as the gap morphologies reach stable configurations due to the exposure to HCl. We note that Fe(III) is not added back, suggesting it remains robustly incorporated and active, however, we expect more reliable data if rigid rescaffolding molecules are re-introduced at each cleaning cycle.[23] The stability of these SERS substrates significantly improves upon those that are quickly damaged when exposed to cleaning protocols such as ultraviolet irradiation or other gas plasmas.[25, 41, 42]
We note that even where literature claims SERS substrates to be reusable,[43, 44] no thorough statistical analysis is quantified to indicate their performance. Reusability is often claimed by employing dye molecules, such as rhodamine 6G or malachite green, which inherently have large Raman cross-sections.[45-48] This raises questions about the practical reproducibility, uniformity, and sensitivity in the realistic performance of such SERS substrates which is rarely reported or statistically analyzed. Decomposition by UV irradiation results in residual ions and molecules from degraded analytes on the substrate requiring additional washing steps, and significantly lengthening each cycle to several hours.[45, 48] Literature reports of dye molecule degradation (to “near invisible” or 99%),[46, 49] do not yet quantify the behavior of SERS substrates after irradiation. Such issues have a significant effect on practical application, both in terms of remaining interferants interacting with the sensing analyte, as well as the irreproducibility of hotspot enhancements due to damage. The cleaning method outlined here eliminates all molecules from the gap. We emphasize that cleaning here is only possible because we utilize monolayers of nanoparticles so that nanogaps are accessible to plasma ions—this is ineffective for substrates with greater nanoscale tortuosity.
For both “plasma cleaned” and “re-cleaned” samples (Figure 3a blue/grey), the large peak observed at 600 cm−1 arises from the formation of Au oxides.[40, 50] To investigate this further, X-ray photoelectron spectroscopy (XPS) is used to map the various elements and their charge states in the MLagg. Relative XPS intensities (Figure 3b, spectra shown in Figure S3, Supporting Information) are extracted for the different sample conditions. After plasma cleaning, a metastable Au(III) oxide layer[51] is clearly present on the gold surface (Figure 3b blue, Au(III); further details in Section S5, Supporting Information). This oxide layer (estimated to be 0.3 nm thick, Section S5, Supporting Information) is important in maintaining the gap when the molecular spacers are removed by the oxygen plasma, and avoid the Au facets sintering together.[23, 51] When re-exposed to DA solution, the Au(III) XPS peak disappears as expected for removal of the Au oxide. The powder form of DA utilized here is dopamine hydrochloride in a 1:1 ratio with hydrochloric acid (HCl) which is required for crystallization. We find that it is this HCl that strips out the oxide layer. Without removal of the oxide, DA cannot bind to Fe(III) which thus explains the longer offset times observed for lower DA concentrations with correspondingly less HCl (Figure 2d).[40]
Another important factor for SERS substrates is their uniformity and reproducibility which can be quantified from their relative standard deviation (RSD).[22] The RSD is defined as the standard deviation of SERS peak intensities over their mean intensity (often reported in %). Substrates with RSD values between 5% and 15% are considered to perform well, while exceptional reproducibilities reach RSDs as low as 1–3%. This typically occurs when nanogap spacings are precisely controlled, such as when utilizing robust scaffolds such as cucurbit[n]urils (CB[n]) to define 0.9 ± 0.05 nm gaps.[52, 53] Field enhancements (E/E0) from gap plasmons are exceptionally sensitive to changes in gap spacing as SERS signals ∝|E/E0|4∝d−4.[22, 54] Recording 50 SERS spectra from across a uniform area of the substrate (Figure 3c) yields RSD uniformity of 6%, similar to CB[n]-defined MLagg substrates. Variations arise from any non-uniform coverage of Fe(III), as well as local domains of 2-monolayer-stacked AuNPs, that vary the number of hotspots probed at each measurement location.[23] Variation in uniformity across an MLagg (Figure 3c inset, see also Section S6, Supporting Information) also shows occasional areas without AuNPs. Gross features, such as holes (Figure S4, Supporting Information), are not representative of the SERS performance itself so while the global RSD is ≈ 23% over an entire MLagg map, local regions (2500 µm2) are much better. Based on the XPS data, Fe(III) coverage of 40 ± 5% is calculated per AuNP (see Section S5, Supporting Information), but this might vary between hotspots. Overall the sensitized MLagg thus proves to be a reproducible and accurate SERS platform.
To determine the limit of detection (LOD) of sensitized MLagg films, they were immersed for long periods in DA solutions of various concentrations which ensures equilibrium binding even at the lowest concentrations (24 h). SERS spectra were collected from ten points on each sample. The resulting averaged spectra (Figure 4a) display the signature DA peaks clearly down below 500 nm. The peaks at 800 cm−1 exist at different wavenumbers when looked at closely (Figure S5, Supporting Information). Principal component analysis (PCA) is performed and the non-linear response observed (Figure 4b) implies that competitive binding or inhibition is present (Section S9, Supporting Information). Indeed, two separate behaviors can be found. We suspect that excess HCl (which is always present in DA solutions) assists the nanogaps to strip the oxide layer at a different rate at higher concentrations. Between 10 and 100 µm, the HCl concentration seems to reach a bottleneck between the rate of DA attachment to Fe(III) and the removal of oxide, which below 10 µm is limited by the concentration of HCl present. We note that decreases in SERS signal at higher concentrations are typically explained by dipole depolarization at higher analyte coverage and is a common feature of SERS substrates.[55, 56]
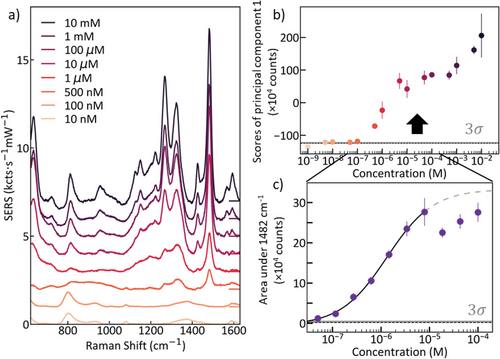
The quantitative range for PCA calculation is thus limited here to 5 nm–100 µm and the first principal component is fit to a Langmuir–Hill model (Section S10, Supporting Information). The LOD is then determined as the intersection of the Langmuir–Hill fit with the 3σ confidence band of the noise level. The LOD for this system is 13.8 nm (while for the uncleanable Solagg, the LOD is 1.3 nm), and since the mean concentration of DA in human urine is 4 µm, this indicates that MLaggs are potentially suited for clinical applications.[57] Furthermore, the limit of quantification (LOQ) is 49 nm using a confidence level of 3σ. We also note other (non-SERS) work claims a wide range of extracellular DA levels spanning from 0.5 to 100 nm with errors in the same order as the reported values.[6, 58] The Hill coefficient extracted from fitting is 1.3 (Section S10, Supporting Information), signifying positively cooperative binding of the DA to Fe(III) and clearly suggesting that further understanding of the different surface chemistries present in different SERS platforms is required to fully identify the accessible application space.
PCA extraction does not always identify the appropriate quantitative ranges that can be calibrated. As a comparison, the DA peak area at 1482 cm−1 is extracted (Figure 4c) and the Langmuir–Hill fit to the quantitative region yields a LOD of 34 nm, similar to the PCA. Since PCA utilizes the entire spectrum while peak areas use a restricted portion, such differences are expected. The observed monotonic behavior identifies the clinical concentration range, showing a loss of calibration for analyte concentrations above 10 µm.
By contrast, when the films are exposed to DA concentrations for only 10 min (Figure S6, Supporting Information), the LOD observed was only 22.8 µm. Again this is likely due to the restricted stripping within this time of oxide from nanogaps at low (HCl), where longer onset times (Figure 2d) prevent immediate DA detection. We thus emphasize that the Langmuir equilibration time (typically not considered in assay specification), and other effects such as opening up of hotspot sites or binding to Fe(III), always need to be considered for LOD specification. One advantage of these MLagg sensors is that they may be useful for automatically filtering only the small analytes which can fit into these nanogaps, while larger proteins and cellular components are swept away (indeed with exosomes and lipoproteins no signals are resolved). Clearly, however, enhanced binding affinities are desirable for reducing assay timescales in realistic applications.
For clinical application in sensing neurotransmitters from human fluids such as urine, it is important for the sensor to be selective, however, it must also measure multiple analytes simultaneously. We thus study multiplexed sensing of DA and EPI to characterize the discrimination of two similar species and if any interactions influence their signals. EPI is also a catecholamine with a very similar structure to DA except for different functional groups (Figure 5a), hence they also form Fe-catechol complexes and again produce highly enhanced SERS signals (Figure 5b). Their SERS spectra are consequentially similar, in both Fe-catechol and catechol ring vibration regions. Even so, the characteristic differences in peak ratios and additional peaks allow independent molar concentrations to be faithfully extracted, as we now show.
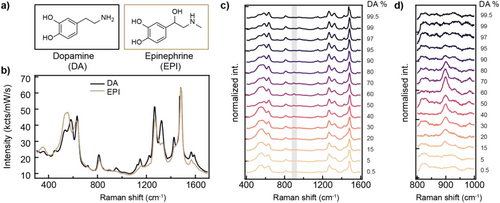
When the ratio of DA:EPI is swept from 0% to 100%, the measured SERS spectra (Figure 5c) can predominantly be reconstructed using linear superpositions of the individual 100% DA and EPI SERS spectra (Figure S8a, Supporting Information). An intriguing additional effect is however also seen, which is a new SERS peak at 895 cm−1 only appearing with mixtures and strongest for 60:40% DA:EPI (Figure 5d and Figure S8b, Supporting Information). This implies again that bis-complexation with Fe(III) in the nanogaps is most stable, and produces a previously-unseen vibrational transition. Using DFT, we find this vibration corresponds to a hydrogen bond between the NH2 end group of DA and the OH tail group of EPI (and arising from NH2 tail wagging). We find this DA-EPI hydrogen bond cannot be produced when they are bound to the same Fe(III). This suggests that the observed vibration comes from the interaction of catechol tails between adjacent complexes. This then provides strong proof that the Fe(III) sites in the hotspots are within 1 nm of each other (comparing the relative Raman cross sections of the molecules). This extends the concept of bianalyte methods to such interacting versions, giving a nanoscale ruler to track the density and proximity of binding complexes. It also provides a way to improve quantification in mixtures (Section S11, Supporting Information), as shown in measuring blind mixtures after developing a calibration curve (Figure S9, Supporting Information).
As a result of these investigations, we arrive at a more detailed nanoscale understanding of how Fe(III)-sensitized MLagg substrates produce strong SERS signals for catechols. Removal of all other organics by oxidation leaves high coverage Fe(III) inside the nanogap hotspots. Stripping of the oxides leaves these Fe(III) active on the Au surface, and able to bind catechols in a bis-complex (Figure 1c). We find similar binding activities for different catechols so that faithful extraction of multiplexed concentrations can be achieved, with limits of detection below 13 nm. Exploiting this Fe(III)-catechol complexation, it is possible to detect a wider range of catecholamine and benzenediol structures, including iron-catechol, as they possess distinct SERS spectra.
3 Conclusion
In conclusion, we demonstrated the sensing of neurotransmitters using Fe(III)-sensitized AuNPs on highly sensitive and reproducible MLagg SERS substrates. These MLagg films are deposited on transparent glass substrates resulting in efficient access and sensing from both sides by fluid and light, achieving an RSD of 6% and LOD of DA below 13 nm exceeding clinical limitations. By using oxygen plasma cleaning treatments, it is possible to completely remove all analytes, reuse the films, and provide reproducible pristine hotspots for sensing. Such cleaning is only possible for monolayer NP samples, where the gaps are accessible to the plasma ions. During the oxygen plasma cleaning, the formation of gold oxides can be directly observed by SERS and XPS, as well as their subsequent reduction prior to the detection of DA. Multiplexed sensing of neurotransmitters reveals excellent mixing and identical site competition, as well as unusual complexation and vibrational coupling suggesting inter-complex interactions, supported by DFT calculations. These devices are extremely promising for microfluidic integration and for translational implementations such as “smart toilets” for continuous monitoring and drug compliance. Simplified forms of plasma cleaning are accessible and should be explored, as well as alternative methods for removing organics within the nanogaps.
4 Experimental Section
Fabrication of Monolayer Aggregate Films (MLagg)
Standard 60 nm nominally-spherical AuNPs stabilized with citrate were purchased from BBI Solutions. 500 µL of these 60 nm AuNPs were added to an Eppendorf tube containing 500 µL of chloroform, pipetted in using a Pasteur pipette to form a two-phase system. This allowed aggregation of the AuNPs to be initiated with the addition of 150 µL of 0.5 m NaCl. The tube was then shaken for ≈1 min until the color changed from clear red to opaque greyish purple. The mixture was left to settle causing the aggregated AuNPs to settle at the interface between the chloroform and the aqueous phase. This aqueous phase was washed three times by the addition and removal of 300 µL of DI water, in each round diluting and removing any excess citrate and salts. The remaining liquid was removed slowly from the aqueous phase until a small dense droplet of aggregated AuNPs was formed. This droplet was carefully transferred onto a glass slide (Fisherbrand Borosilicate Glass, 16 mm), which was washed prior to using ethanol and DI water. The droplet was left to dry forming a monolayer film, and upon drying, the film was rinsed using DI water and then dried using nitrogen gas flow. The surfactants on the AuNP surfaces were stripped away using oxygen plasma treatment by exposing the film to an oxygen plasma for 15 min (30 sccm, 90% RF power) using a Diener electronic GmbH & Co. KG Plasma etcher. The substrate was removed from the plasma etcher and the film was immersed in 355 µL solutions of dopamine hydrochloride (10 nm–10 mm) pipetted into black polypropylene 96 well microplates (Greiner Bio-One Ltd). All chemicals were purchased from Sigma-Aldrich.
Raman Measurement
The MLagg films were measured using a Renishaw inVia confocal Raman microscope, with 20× objective (NA = 0.40) and 785 nm excitation. The spectrum was typically collected using 1 s integration time and 0.5% laser power (≈ 2.2 mW incident on the sample) unless otherwise specified.
MLagg Film Characterization
Scanning electron microscope images were obtained using an FEI Philips Dualbeam Quanta 3D with an accelerating voltage of 5 kV, and a current of 25 pA. XPS (ThermoFisher Escalab 250Xi) was conducted using a monochromated Al Kα X-ray source. Survey spectra were recorded with a pass energy of 100 eV and elemental peaks for high-resolution spectra utilized 50 eV. The XPS measurements were collected from ten separate fabrications over three different runs, resulting in a representative dataset.
Density Functional Theory Calculations
DFT calculations were performed using the B3LYP[59, 60] hybrid generalized gradient approximation exchange-correlation functional, augmented with Grimme's D3 dispersion correction with Becke–Johnson damping (GD3BJ).[61] The Def2SVP[62] basis set was employed for all atoms. All DFT calculations were implemented using an ultrafine integration grid in Gaussian 09 Rev. E.[63]
Acknowledgements
The authors acknowledge financial support from the European Research Council (ERC) under Horizon 2020 research and innovation programme THOR (Grant Agreement No. 829067), PICOFORCE (Grant Agreement No. 883703), and POSEIDON (Grant Agreement No. 861950) and from the EPSRC (Cambridge NanoDTC EP/L015978/1, EP/L027151/1) and the Cambridge IAA account. M.N. was supported by a Gates Cambridge fellowship (OPP1144). B.N. acknowledges support from the Royal Society (URF∖R1∖211162). R.A. acknowledges support from the Rutherford Foundation of the Royal Society Te Apārangi of New Zealand, the Winton Programme for the Physics of Sustainability, and Trinity College, University of Cambridge. The authors thank Dr. Carmen Fernandez-Posada for assistance in collecting X-ray photoelectron spectra. The authors acknowledge the use of the Cambridge XPS System, part of Sir Henry Royce Institute Cambridge Equipment, EPSRC grant EP/P024947/1 and EP/R00661X/1.
Conflict of Interest
The authors acknowledge a patent has been filed, patent: Surface-enhanced spectroscopy substrates, UK 2304765.7, 30/3/2023.
Author Contributions
The experiments were devised by M.N. and J.J.B. M.N. performed the experiments and data analysis, with substrate fabrication input from R.A. and D.G.B. C.A.R. with T.F. and E.R. carried out the DFT simulation calculations. B.N. gave input and carried out PCA calculations. The manuscript was written and revised with contributions from all authors.
Open Research
Data Availability Statement
The data that support the findings of this study are openly available in Apollo at https://doi.org/10.17863/CAM.


