Imaging the Single-Electron Ln–Ln Bonding Orbital in a Dimetallofullerene Molecular Magnet
Abstract
Chemically robust single-molecule magnets (SMMs) with sufficiently high blocking temperatures TB are among the key building blocks for the realization of molecular spintronic or quantum computing devices. Such device applications require access to the magnetic system of a SMM molecule by means of electronic transport, which primarily depends on the interaction of magnetic orbitals with the electronic states of the metallic electrodes. Scanning tunneling microscopy in combination with ab initio calculations allows to directly address the unoccupied component of the single-electron molecular orbital that mediates the ferromagnetic exchange coupling between two 4f ions within a lanthanide endohedral dimetallofullerene deposited on a graphene surface. The single-electron metal–metal bond provides a direct access to the molecule's magnetic system in the transport experiments, paving the way for investigation and controlled manipulation of the spin system of individual dimetallofullerene SMMs, essential for molecular spintronics.
1 Introduction
For almost two decades there has been a considerable experimental and theoretical effort regarding the investigation of charge transport through single-molecule magnets (SMMs),[1-6] which are considered to have a great potential for the realization of molecular-level spintronic[7-11] or quantum computing devices.[12-15] Whereas first transport experiments in the field have been performed on SMMs incorporating 3d transition metal ions,[1, 2, 4] a new promising class of lanthanide (Ln)-based complexes emerged, showing high magnetic blocking temperatures, often combined with a sufficient redox stability.[16-18] Recent experiments aiming at the investigation of electron transport through individual SMMs involving its magnetic system showed, however, that at least in Ln-based double-decker SMMs 4f-electrons are generally difficult to access owing to their spatial localization and energetic position far away from the Fermi level.[19-25] Direct addressing of 4f magnetic moments inside molecules via electronic transport would thus require systems with electronic orbitals at feasible energies combined with a certain spatial extend as can be realized for early Ln species[25] or systems with electron states that strongly hybridize with 4f orbitals without altering the peculiar magnetic properties of the magnetic complexes.[26, 27] Particularly interesting in this sense are functionalized endohedral dimetallofullerenes incorporating a single-electron bond between two ferromagnetically coupled Ln atoms and representing one of the most promising classes of SMMs at the moment.[28] However, whereas their carbon cage fully absorbs the charge redistribution upon surface deposition, being beneficial for their magnetic stability,[29] their endohedral structure at the same time hinders direct access to the molecular interior, being inevitable in terms of applications. Consequently, no experimental proof has been reported up to now that demonstrates access to their magnetic core in transport measurements.
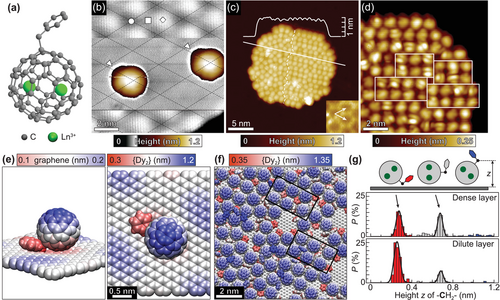
In this work, we focus on the endohedral dimetallofullerene complexes Ln2@C80(CH2Ph), referred to as {Ln2} in the following.[30] These molecules consist of a roughly spherical fullerene cage that encapsulates two Ln3+ ions, see Figure 1a. The two lanthanide ions share a single-electron covalent bond, which is stabilized by adding a CH2Ph side group to the C80 cage. This metal–metal bond results in a strong exchange between the Ln centers in the [Ln3+ – e – Ln3+] system resulting in exceptional magnetic properties both in the bulk[28] and in sub-monolayers.[31, 32] Liu et al.[33] have shown that the Ln–Ln bonding molecular orbital (MO) is split into two components, which are fully spin-polarized and energetically well-separated, with the unoccupied component lying below the cage-based lowest unoccupied MO (LUMO) and being partially localized on the C80 cage thus being in principle addressable in scanning tunneling microscopy/spectroscopy (STM/STS). A decrease in energy upon moving from lighter to heavier 4f elements in a series from Ln = La to Ln = Er[28] can serve as a basis to reliably identify the Ln–Ln bonding state among the C80-based molecular orbitals. Here we combine STS and density functional theory (DFT) calculations to probe and assign the molecular orbitals of {Ln2} complexes (Ln = Dy, Er) deposited on graphene/Ir(111) by electrospray deposition.[34-36] We further investigate the variation of the energetic position of the observed MOs upon going from {Dy2} to {Er2} and perform spatially and energy-resolved orbital mappings, which yield an unambiguous proof of the nature of the observed LUMO state, being the spin-polarized single-electron MO localized at the [Ln3+ – e – Ln3+] system inside the fullerene cage. This state represents a unique handle for a direct access to the molecule's 4f-based magnetic system in transport experiments.
2 Results and Discussion
Figure 1b shows an STM topographic image of two isolated {Dy2} molecules on the graphene/Ir(111) surface. Each molecule appears as a spherical main body with a smaller protrusion on one side (marked by a white triangle in Figure 1b). The shape of the main body and its apparent height of about 1 nm matches well the C80 fullerene cage, whereas the smaller protrusion is assigned to the CH2Ph side group. {Dy2} preferably adsorbs in the fcc region of the graphene Moiré superstructure with the side group oriented roughly along the direction of the graphene lattice.[31] Beside isolated molecules, small close-packed molecular islands mainly form at step edges, but also on the bare surface. Figure 1c shows an STM topographic image of a molecular island of {Dy2} on graphene/Ir(111) with an apparent height of 0.94(2) nm. Whereas on the left-hand side of the island the molecules are densely-packed, without any visible long-range order, on the right-hand side of the island we observe a rather well-ordered structure that consists of bimolecular rows (Figure 1d). The orientation of the rows does not coincide with the main crystallographic directions of the underlying graphene lattice. Although a preferred adsorption site on the graphene Moiré is observed for isolated molecules, the molecule–substrate interaction does not play a major role during the formation of dense layers. The surface adsorption behavior of {Er2} on graphene/Ir(111) is found to be similar to that of {Dy2} as shown in Figure S1, Supporting Information.
The local ordering of {Dy2} SMMs on graphene/Ir(111) has been further investigated using classical molecular dynamics (MD) simulations (see Methods and Supporting Information for details). A graphene sheet was periodically corrugated in order to mimic the Moiré superstructure. In the MD simulations performed for a dilute molecular layer, {Dy2} molecules tend to reside in the valleys of the periodically buckled graphene surface with the side group pointing downward as shown in Figure 1e, which corroborates the preferred adsorption site and orientation observed in STM for isolated molecules. At low coverage, {Dy2} molecules start to form rows, which follow the high symmetry directions of the graphene lattice (see Figure S2, Supporting Information). Upon increasing the density of molecules on the surface we observe a change toward the rather distorted close-packed structure with only some areas showing domains of row packing, see Figure 1f. However, those ordered domains show different surface orientations, which mostly do not follow the high order crystallographic directions of the underlying substrate. Additionally, a large number of rotational arrangements with respect to the CH2Ph side group is observed, corroborating the observation of only weak alignment of all magnetic easy axes in a molecular sub-monolayer.[31] A good measure of the individual molecular rotation is given by the height z of the –CH2– linker above the surface, and histogram analysis reveals the formation of only two dominant rotations in a dense layer, see Figure 1g. They are characterized either by the side group pointing downward as observed for an isolated molecule or pointing sideward or upward with respect to the surface plane. The respective population depends on the molecular density, pointing to an enhanced spatial constraint in dense layers. The development of two dominant molecular rotations can be as well identified in STM topography by analyzing the apparent height of molecules within the islands. Figure 2a shows the corresponding histograms obtained upon STM data analysis of {Dy2} and {Er2} islands on graphene/Ir(111). The distributions can be very-well fitted by a sum of two Gaussians, which represent normal and bright molecules with an average height difference of 63(5) pm. Comparison with the MD simulations suggest the side group protruding from the C80 cage to point downward for the first ones and pointing sideward for the latter ones.
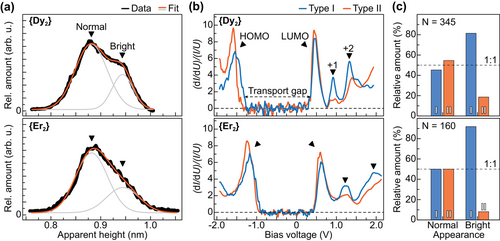
We now focus on the investigation of the electronic properties of the molecules by means of differential tunneling (dI/dU) spectroscopy on a large number of molecules. Typical spectra acquired over the center of molecules are plotted in Figure 2b showing two major spectral shapes referred to as Type I and Type II. In both cases, the spectra are dominated by a well-defined transport gap separating two main peaks, referred to as highest occupied MO (HOMO) and LUMO. Furthermore two less-pronounced features lying higher in energy are visible, which we refer to as LUMO+1 and LUMO+2. The absolute peak positions show a certain distribution due to variations of the molecule-molecule and molecule–substrate interactions within the islands[29, 37, 38] in addition to the different molecular rotations (see Figure S3, Supporting Information). As shown in Figure 2c bright molecules mainly show Type I spectral shape with a pronounced LUMO+1 resonance, whereas a majority of normal molecules exhibit a suppressed LUMO+1 intensity (Type II), suggesting that this MO is related to the CH2Ph side group. Smaller variations in the other resonances furthermore support a different molecular orientation of both types on the surface.
Figure 3 compares the experimentally obtained dI/dU spectra with DFT calculated density of states (DOS) features of the surface-adsorbed {Dy2} and {Er2} complexes. The projected DOS (PDOS) shows that the occupied component of the single-electron Ln–Ln bonding MO in both complexes is buried below several cage-based HOMO orbitals, whereas its unoccupied counterpart forms the well-separated LUMO. The dI/dU resonance measured at about +0.5 eV for both complexes can thus be associated with the unoccupied component of the single-electron Ln–Ln bonding MO. Higher-lying cage-based orbitals constitute the peaks observed on the unoccupied side of the dI/dU spectra and are referred to as LUMO+1 and LUMO+2. On the other hand the peak in the occupied part of the dI/dU spectra can be assigned to the cage-based HOMO orbitals together with the occupied component of the single-electron MO.
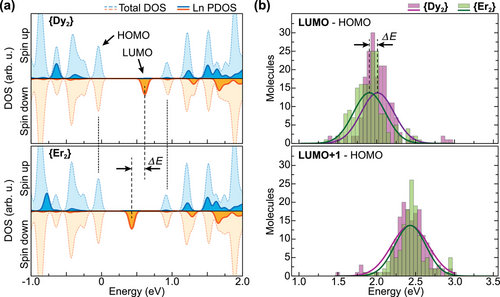
As shown above, both {Dy2} and {Er2} exhibit very similar STM appearance and spectroscopic signatures, thus hardly being distinguishable in the experiment. However, we observe a clear difference between both compounds regarding the relative energetic positions of molecular orbitals. In order to quantify this difference, we accumulated extended spectroscopic data sets in order to obtain statistically significant absolute peak positions albeit different molecular rotations and variations of measurement locations. Therefore in Figure 3b we plot the energies of LUMO and LUMO+1 relative to the respective HOMO energy of each molecule. For {Dy2} we find average values and standard deviations of eV and =+2.43(24) eV, whereas for {Er2} these values amount to eV and +2.43(20) eV. All results are presented as Gaussian curves in the histogram. We thus observe a net shift of the LUMO with respect to its neighboring orbitals of roughly ΔEDy→Er = −106(16) meV upon going from {Dy2} to {Er2}, with the uncertainty reflecting the standard error. This result is very well in line with the DFT calculations of both compounds, where the LUMO shifts by roughly ΔEDy→Er ≈ −180 meV in an otherwise constant HOMO–LUMO+1 gap (see Figure 3a). Furthermore the relative shift of the LUMO is in very good agreement with previously reported electrochemical measurements revealing a systematic shift of the first reduction potential in the {Ln2} series from Ln = La to Ln = Er, and in particular with the difference of 0.18 V between {Dy2} and {Er2}.[28]
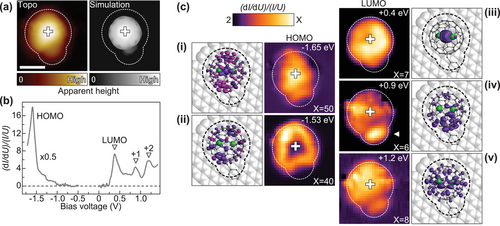
A direct contribution of the single-electron Ln–Ln MO to the tunneling current is further evidenced upon the comparison of spatially resolved dI/dU spectroscopy measurements on an isolated {Dy2} complex and the corresponding DFT calculations. Figure 4a shows an STM topography of the molecule together with a simulated image obtained using a Tersoff–Hamann approximation. An STS spectrum recorded over the center of the molecule (marked by a cross) is shown in Figure 4b and is in very good agreement with those obtained on molecules within the islands. Acquiring spectra on a grid over the molecule allows us to deduce dI/dU maps at the respective resonance energies, plotted together with DFT frontier electronic orbitals in Figure 4c. The extended data set is presented in Figure S4, Supporting Information. Within the HOMO resonance, we observe two different intensity contributions that are lying close in energy, in accordance with the calculated DOS. Whereas HOMO-1 is localized over the center of the C80 cage, HOMO exhibits a pronounced donut-like shape. The LUMO resonance being assigned to the unoccupied component of the single-electron Ln–Ln bonding orbital exhibits faint intensity over the whole fullerene cage with a clear maximum located close to the center, which is well reflected in the measurement. LUMO+1 and LUMO+2 also show a reasonable agreement between theory and experiment. The LUMO+1 resonance is mainly localized close to the side group (marked as white triangle) with slightly suppressed intensity on the rest of the C80 cage. This is in line with the observed correlation of molecular height and spectral characteristics related to the intensity of the LUMO+1 peak. LUMO+2 is delocalized over the C80 cage with a rather small intensity contribution at the side group. Overall, calculations reveal only minor alteration of molecular orbitals upon going from a gas-phase to surface-adsorbed molecule, see Figure S5, Supporting Information. We thus infer that the electronic structure of {Dy2} is largely unaffected by the graphene substrate, which is in line with the previously reported molecular magnetism.[31]
We note that the approach to the molecular magnetism presented here is substantially different compared to previous STM studies. Fahrendorf et al.[25] reported on electron transport involving 4f states for NdPc2 on Cu(111), with no magnetic measurements performed. On the other hand, Kondo screening of the 4f moment was observed in surface-adsorbed LnPc2 SMMs.[26, 39] The latter experiments have recently been expanded to the investigation of exchange-splitting of the Kondo peak in individual DyPc2 molecular magnets.[27] In contrast to that, the findings of our study suggest that tunneling into the LUMO resonance allows to address the spin-polarized single-electron MO that mediates the ferromagnetic coupling between the two Dy3+ ions.[33] Tracking the magnetoresistance of the contact upon tunneling through the fully spin-polarized LUMO using a spin-polarized or superconducting[40] tip could be used to read out the magnetic state of the giant spin. Accessing this state in {Dy2} suggests that also in related dimetallofullerenes with Gd–Er as metal centers,[28] the magnetic system of the molecules can be addressed in electron transport experiments.
3 Conclusion
To summarize, we performed a detailed structural and electronic characterization of Ln2@C80(CH2Ph) single molecular magnets deposited on graphene/Ir(111). Spatially resolved molecular orbitals show good agreement with DFT calculations for gas-phase and surface-adsorbed molecules and allow us to assign the LUMO resonance to the unoccupied component of the single-electron metal–metal bonding orbital of the [Ln3+ – e – Ln3+] moiety inside the C80 cage. We further corroborate this result by switching from Ln = Dy to Ln = Er, where a net shift of ΔEDy → Er = −106 meV of the LUMO energy is observed with respect to the neighboring C80-based orbitals, which is fully consistent with electrochemical measurements and ab initio calculations. Overall, the results of our combined STM and DFT study unambiguously confirm that we energetically and spatially resolved the unoccupied component of the single-electron Ln–Ln bonding orbital, being an integral part of the exchange-coupled [Ln3+ – e – Ln3+] system inside the C80 cage. We thus obtain direct access to the molecule's magnetic system in an electron transport experiment, which opens a possible route to probe and controllably manipulate the spin state of the 4f-metal-based SMM aiming at realization of molecule-based spintronic units.
4 Experimental Section
All samples were prepared in situ. The Ir(111) single crystal (Surface Preparation Laboratory B. V.) was cleaned by repeated cycles of Ar+ sputtering at 2 kV, heating in an O2 atmosphere of 5 × 10⁻⁷ mbar at 900–1150 °C and flash annealing in UHV up to 1500 °C. Graphene was prepared by exposing the clean Ir(111) surface to an ethylene atmosphere at a pressure of 1.1 × 10⁻⁷ mbar for 20 min while keeping the sample at T = 1200 °C. Ln2@C80(CH2Ph) molecules with Ln = {Dy, Er} were freshly solved in 1,2-dichlorobenzene and deposited in situ by ESD while the sample was kept at room temperature. The used ESD setup is described in detail elsewhere.[36, 41]
Scanning tunneling microscopy and spectroscopy experiments were performed in a two-chamber UHV system (base pressure 5 × 10⁻¹¹ mbar), equipped with an Omicron Cryogenic-STM. The STM was operated at a temperature of 3 K. All STM measurements were carried out in the constant-current mode using grinded and polished PtIr tips (Nanoscore GmbH). The sign of the bias voltage (U) corresponded to the potential applied to the sample. For spatially resolved molecular orbitals, I(U) spectra were collected on a 30 × 30 grid over an area of 2.75 × 2.75 nm2. The obtained spectra were numerically differentiated and normalized to the (I/U) signal using an offset constant of 1 pS. Spatial maps at specific bias voltages were derived from the spectroscopic data and smoothed by using a Gaussian filter.
Classical MD deposition of 200 and 400 molecules on a graphene surface with Moiré superlattice corrugation was done using the LAMMPS package[42] in a simulation box of 21.3 × 24.6 × 10.0 nm3. The corrugation amplitude of the graphene was set to 25 pm together with a lattice periodicity of 2 nm. The systems were parameterized using GAFF2 force fields with AMBER tools and in-house python scripts.[43, 44] The deposition algorithm included quick NVE injection (microcanonical ensemble) and two-step NVT annealing (canonical ensemble, with Nose–Hoover thermostat) at 300 and 100 K following a quenching down to 10 K with an overall time of ≈0.5 ns. In this model, the ramping reflecting wall was employed to mimic the constant front movement with a speed of 800 m s−1. An example of the LAMMPS protocol and results of sparse molecular packing are provided in Supporting Information.
The molecular orientation of isolated molecules near the graphene surface as predicted by MD was used as an initial guess for DFT level optimization. These structures were further optimized using the DFT/PBE level of theory and projector augmented-wave method as implemented in VASP5 code and standard pseudopotential.[45-47] All optimizations were conducted in the Γ-point. Gas-phase {Er2} and {Dy2} systems were individually optimized down to a gradient of 10−5eV nm−1. The initial and final geometries are available in Supporting Information.
Acknowledgements
M.F. gratefully acknowledges financial support by the Deutsche Forschungsgemeinschaft (DFG) – FO 640/7-1 and SFB 1432 (Project No. 425217212). A.A.P. acknowledges financial support by the Deutsche Forschungsgemeinschaft (DFG) - PO 1602/5, 1602/7 and 1602/8. S.M.A. acknowledges financial support by the Deutsche Forschungsgemeinschaft (DFG) - AV 169/3-1.
Open access funding enabled and organized by Projekt DEAL.
Conflict of Interest
The authors declare no conflict of interest.
Author Contributions
F.L. and A.A.P. synthesized the Ln2@C80(CH2Ph) molecules. F.P. and T.B. performed surface deposition, STM and STS characterization and analyzed the data. S.M.A. performed DFT calculations and classical MD simulations. M.F. conceived and supervised the experiments. F.P. and M.F. wrote the manuscript with input from all authors.
Open Research
Data Availability Statement
The data that support the findings of this study are available from the corresponding author upon reasonable request.


