Time-Resolved Fluorescence Anisotropy of a Molecular Rotor Resolves Microscopic Viscosity Parameters in Complex Environments
Abstract
Understanding viscosity in complex environments remains a largely unanswered question despite its importance in determining reaction rates in vivo. Here, time-resolved fluorescence anisotropy imaging (TR-FAIM) is combined with fluorescent molecular rotors (FMRs) to simultaneously determine two non-equivalent viscosity-related parameters in complex heterogeneous environments. The parameters, FMR rotational correlation time and lifetime, are extracted from fluorescence anisotropy decays, which in heterogeneous environments show dip-and-rise behavior due to multiple dye populations. Decays of this kind are found both in artificially constructed adiposomes and in live cell lipid droplet organelles. Molecular dynamics simulations are used to assign each population to nano-environments within the lipid systems. The less viscous population corresponds to the state showing an average 25° tilt to the lipid membrane normal, and the more viscous population to the state showing an average 55° tilt. This combined experimental and simulation approach enables a comprehensive description of the FMR probe behavior within viscous nano-environments in complex, biological systems.
1 Introduction
Viscosity, while defined macroscopically as “resistance to flow”, in a molecular context refers to the amount of free volume for a molecule to move within.[1] Time-resolved fluorescence anisotropy imaging (TR-FAIM) of rigid fluorophores is a well-established, minimally invasive method to image viscosity in vitro.[2] By examining the extent of fluorescence depolarization after polarized excitation, a rotational correlation time can be extracted in each pixel and used to calculate a corresponding viscosity based on rotational diffusion of the probe, through the Stokes–Einstein–Debye relation.[3]
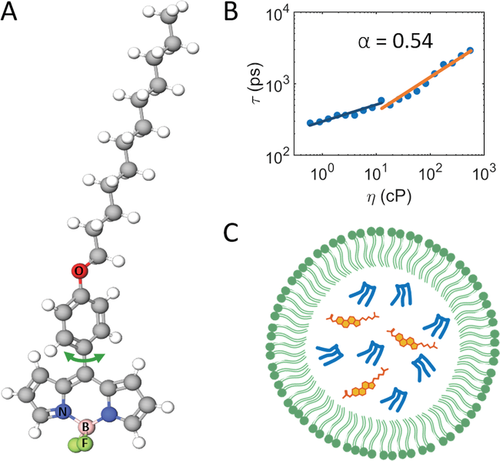
Another technique, which has received considerable attention lately, is the use of fluorescent molecular rotors (FMRs).[4-8] FMRs report on viscosity through their fluorescence lifetime; rotation around a central single bond gives access to a non-radiative relaxation pathway. If the rotation is restricted, such as in high viscosity environments, access to the non-radiative pathway is diminished and the fluorescence lifetime increases.[1, 9] The fluorescence lifetime can be converted into a viscosity through a calibration plot based on the Förster–Hoffmann relation. Viscosity imaging is possible through combination with fluorescence lifetime imaging (FLIM).
On the surface, TR-FAIM and FMR-FLIM are alternatives: each method provides viscosity imaging of, for example, cellular environments. However, TR-FAIM and FMR-FLIM probe subtly different aspects of the physical environment: rotational diffusion and free, available volume of and around the FMR, respectively. In purely isotropic media, these physical quantities are equivalent and will convert into the same viscosity, but in heterogeneous environments they become distinct. Combining TR-FAIM and FMR-FLIM, that is, performing TR-FAIM using an FMR, thus allows us to simultaneously measure free volume from the fluorescence lifetime and rotational diffusion from the rotational correlation time.
This is especially powerful when studying biological systems. Practically all biochemical reactions are diffusion-mediated, and so will depend on the physics underlying their diffusion step[10]–mainly viscosity[2] and any physical barriers, such as organelle nanostructures.[11] Mapping viscosity in specific biological settings is consequently an increasingly active area of research,[12] but as biological environments are generally extremely heterogeneous,[13] a single viscosity parameter will not capture the complexity of the system. Being able to capture both rotational diffusion and free volume thus represents a significant improvement.
In this paper, we show for the first time that TR-FAIM and FMR-FLIM can be combined to measure the rotational diffusion of the FMR BODIPY-C12, and the free volume around it, in heterogeneous environments. Our results show dip-and-rise fluorescence anisotropy decays due to multiple dye populations within synthetically constructed adiposomes, or model lipid droplets (mLDs), and lipid droplets (LDs) in live HeLa cells. We fit these decays using associated anisotropy models, as pioneered by Ludescher et al.,[14] to extract rotational correlation times for each component (fluorescence lifetimes are extracted using the usual exponential intensity decays). By then performing atomistic molecular dynamics (MD) simulations, we show that these multi-component signals can be resolved and attributed to specific physical states of BODIPY-C12 in the mLD and LD systems, thereby defining their nano-environment.
1.1 Theoretical Background
1.1.1 Time-Resolved Fluorescence Anisotropy
Note that since the fluorophores have different r∞ values, because both are hindered, each have a b parameter. Here, b1 is related to r∞1 and b2 is related to r∞2. We call this the bound/bound model.
1.1.2 Fluorescence Lifetime Imaging with FMRs
2 Results and Discussion
2.1 Heterogeneous Environments Create Dip-and-Rise Anisotropy
For all experimental work, BODIPY-C12 (Figure 1A) was used. It has previously been used to probe membrane fluidity,[17] and MD simulations have shown that its chain inserts into the tail region of a DOPC bilayer.[6] BODIPY-C12 is readily taken up by HeLa[18] and SK-OV-3 cells[17] in which it stains LDs, along with other regions.[19, 20] To fully understand BODIPY-C12 signals in heterogeneous environments, we start our experiments in solution.
The time-resolved fluorescence anisotropy measurements of BODIPY-C12 in four methanol solutions of different viscosities were measured simultaneously by obtaining polarization-resolved FLIM images of a multi well plate. Viscosity was increased by adding glycerol. The total intensity decays are shown in Figure 2A, next to a frequency histogram of the fluorescence lifetimes for the different viscosities in Figure 2B. The fluorescence decays were fitted to a monoexponential decay model and the lifetimes were found to be 0.944 ± 0.001, 1.357 ± 0.001, 1.914 ± 0.002, and 3.577 ± 0.003 ns, in order of increasing glycerol content. As the FMRs rotate freely, the anisotropy decay curves (Figure 2C) are fit using Equation (2).
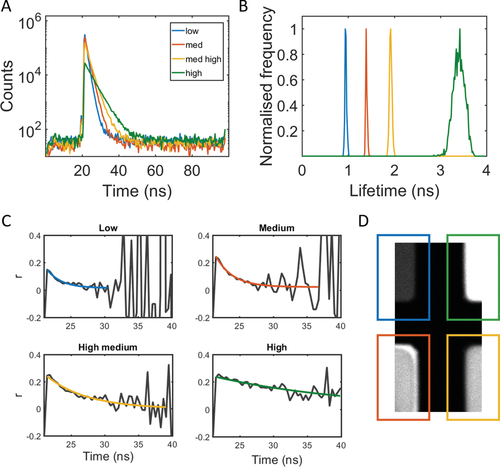
The rotational correlation times were found to be 2.6 ± 0.3, 3.0 ± 0.1, 5.8 ± 0.6, and 19.4 ± 1.5 ns, in order of increasing glycerol content. Fluorescence lifetimes, rotational correlation times, and corresponding viscosities are given in Table 1. The lifetimes and rotational correlation times, obtained from monoexponential decay analysis, convert to overlapping viscosity values, which is entirely expected due to the isotropic media.
| θ [ns] | η [cP] | τ [ns] | η [cP] |
|---|---|---|---|
| 2.6 ± 0.3 | 93.6 ± 10.6 | 0.944 ± 0.001 | 66.0 ± 17.0 |
| 3.0 ± 0.1 | 107.3 ± 4.7 | 1.357 ± 0.001 | 129.2 ± 35.7 |
| 5.8 ± 0.6 | 208.0 ± 21.4 | 1.914 ± 0.002 | 244.1 ± 72.1 |
| 19.4 ± 1.5 | 690.7 ± 55.2 | 3.577 ± 0.003 | 775.9 ± 258.1 |
- Blue refers to the low viscosity mixture, orange to the medium, yellow to the high medium, and green to the high viscosity mixture.
The fluorescence in two wells can then be combined through binning of the signal from two wells, to create a pseudo-experimental heterogeneous (but isotropic) environment. Binning the intensity from the low and high viscosity wells and fitting a bi-exponential decay function, we obtain fluorescence lifetimes of 0.90 ± 0.01 and 3.34 ± 0.06 ns for the two fluorophore populations, in excellent agreement with individual well values –0.944 ± 0.001 and 3.577 ± 0.003 ns (see Table 1). Calculating anisotropy decays from the binned signals, we see dip-and-rise profiles (see Figure 3). Such profiles have previously been observed for bound and unbound populations of NADH,[16] for adsorption of dyes onto nanoparticles and in polymers,[13] for dyes in aggregating proteins,[21] and for dyes interacting with DNA.[22] To the best of our knowledge, this is the first demonstration of time-resolved fluorescence anisotropy measurements of FMRs and thus the first documentation of their dip-and-rise decays.
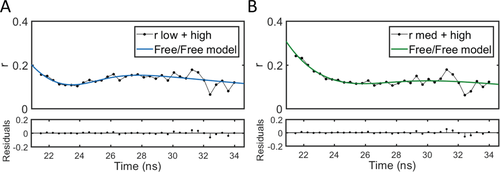
As the dye is freely rotating, we fit the decays to the free/free model (Equation (5)) by fixing the lifetimes, extracted from the intensity decays. The free/free model yields two rotational correlation times for each system. For the low/high combination in Figure 3A, we get 2.4 ± 0.8 ns for the first component and 19.1 ± 4.5 ns for the second component. This is in good agreement with the values from the individual decays (2.6 ± 0.3 and 19.4 ± 1.5 ns, see Table 1). For the medium/high combination in Figure 3B, we get 2.9 ± 0.6 ns for the first component and 17.5 ± 6.3 ns for the second component, again in good agreement with the individual wells (3.0 ± 0.1 ns and 19.4 ± 1.5 ns). The smaller difference between the medium and high viscosity mixtures results in a less pronounced dip.
We have shown here that by binning two viscosity regions, we create a pseudo-experimental heterogeneous environment and observe dip-and-rise anisotropy decays. They can be fitted using the free/free model; two rotational correlation times can be extracted. Importantly, the viscosity calculated from the fluorescence lifetime and the rotational correlation time overlap—this is what we expect in isotropic media. This first step sets us up for exploring heterogeneity found in complex biological systems.
2.2 Polarization-Resolved FMR-FLIM in Lipid Systems
Here, we focus on LDs as an example of a complex biological environment. We first synthesized and imaged model lipid droplets (mLDs), a simple model for LDs. mLDs consist of a DOPC monolayer around a core of triolein and cholesterol oleate. Figure 4A shows intensity images of immobilized mLDs, and Figure 4B shows the binned intensity decay. The fluorescence anisotropy decay, as seen in Figure 4C,D, shows dip-and-rise behavior. This is fitted to the models outlined, with the fluorescence lifetimes and pre-exponential factors fixed, based on a fit of the fluorescence decay, and the rotational correlation times constrained to the higher viscosity regime by .
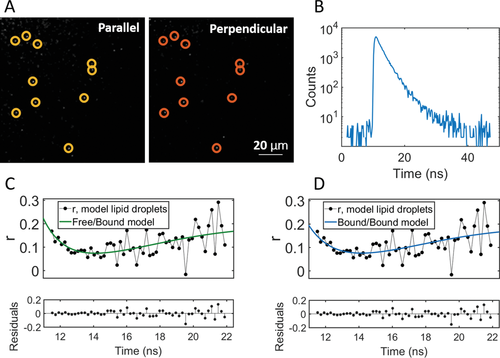
For this system, the ratio between the pre-exponential factors in the intensity decay for the short and long component was 6:1. In Figure 4C,D, fits using both free/bound (Equation (6)) and bound/bound (Equation (7)) models are shown. The output from the free/bound and the bound/bound fits are the same within error, and the bound/bound model gives only a marginally better goodness of fit. However, the hydrophobic nature of BODIPY-C12 suggests that it would not stay in the aqueous solution[23] and thus not have a significant freely tumbling population. Further, the MD simulations presented below clearly show two populations based on the tilt of the dye molecule within the mLD monolayer, which would be consistent with the bound/bound model. The lifetimes are found to be 1.76 ± 0.02 ns and 4.1 ± 0.1 ns; the rotational correlation times are 1.2 ± 0.6 ns and 5.9 ± 3.8 ns.
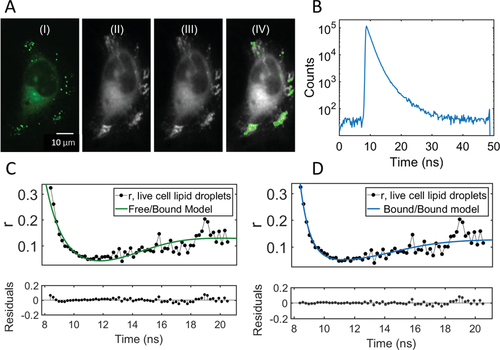
Next, we imaged LDs in live HeLa cells. In Figure 5A, LDs can be seen within the cell as bright puncta (see Supporting Information for co-localization from ref. [19]). The ratio of short-to-long components, based on the pre-exponential factors in the intensity decay seen in Figure 5B, is roughly 35:1; that is, the short component dominates far more than in the mLDs. In Figure 5C,D, we see the fit of the free/bound and the bound/bound model, respectively. The free/bound model does not align well with the data at short times, and does not correctly describe the position of the dip. The bound/bound model, on the other hand, is a good fit. Lifetimes are found to be 1.31 ± 0.05 ns and 5.0 ± 1.1 ns; rotational correlation times are 0.8 ± 0.2 ns and 10.3 ± 0.7 ns. It should be noted that the second component is likely not due to accidental inclusion of non-LD staining in the bins, as the lifetime of BODIPY-C12 outside of the lipid droplets is 1.6 ns.[19] Based on the obtained lifetimes, we calculate corresponding viscosity values based on the Förster–Hoffmann calibration plot (using Equation (8)), carried out in methanol/glycerol mixtures (see Supporting Information). The rotational correlation times are proportional to viscosity multiplied by the molecular volume through Equation (4), assuming spherical rotation. The volume is based on previous calibrations[17] and is found to be 74 Å3. Table 2 shows the converted viscosities from each parameter, in bold.
| θ [ns] | η from θ [cP] | τ [ns] | η from τ [cP] | |
|---|---|---|---|---|
| Component 1 (mLD) | 1.2 ± 0.6 | 68.4 ± 22.9 | 1.76 ± 0.02 | 208.6 ± 60.7 |
| Component 1 (LD) | 0.8 ± 0.2 | 46.1 ± 6.9 | 1.31 ± 0.05 | 120.2 ± 34.4 |
| Component 2 (mLD) | 5.9 ± 3.8 | 324.3 ± 108.5 | 4.1 ± 0.1 | 1016.3 ± 350.6 |
| Component 2 (LD) | 10.3 ± 0.7 | 569.1 ± 38.4 | 5.0 ± 1.1 | 1480.2 ± 769.0 |
We find that the viscosity calculated from the rotational correlation time is significantly lower than that calculated from the lifetime, both in mLDs and LDs. This is in line with what has previously been reported,[24] and in contrast to the solution work where the viscosities overlap (see Table 1). It demonstrates that in a heterogeneous environment, overall molecular tumbling (measured by anisotropy) and free volume allowing for intramolecular twisting (measured by lifetime) are not equivalent like in homogeneous, isotropic solutions—they appear to be probing different aspects of the physical environment. Therefore, under the current theoretical framework of the Stokes–Einstein–Debye and Förster–Hoffmann equations and the usual lifetime calibration, rotational correlation times and FMR lifetimes should be considered separately, as two separate measurements.
Two components in LD systems have, to our knowledge, not been observed before—we believe this is due to signal-to-noise issues, as previous studies have analyzed single pixel decays only.[17, 20] However, multiple components have previously been found in other lipid systems, such as some bilayers and large unilamellar vesicles (LUVs), with the origin thought to be multiple orientations of the FMR in the DPPC (dipalmitoylphosphatidylcholine) gel phase.[25, 26] Moreover, Olšinová et al. found two components of BODIPY-C12 both in the solid (gel) phase and the liquid ordered phase of giant unilamellar vesicles (GUVs).[27] It is therefore not clear exactly what induces multiple components in lipid systems. Consequently, we turn to MD for further investigation.
2.3 MD Simulations of BODIPY-C12 in mLDs and LDs
MD simulations have been performed to investigate the interaction of BODIPY-C12 with both the mLD and LD. Two systems were simulated: the mLD system is identical in composition to the experimental mLDs (i.e., a DOPC monolayer-coated core of triolein and cholesterol oleate), while the representative LD system has a lipid composition based on previously published computational work of LDs.[28] Full details of the simulation methods are available in the Experimental Section. Two replicas of each of the mLD and LD systems were run. We have explored the position of BODIPY-C12 within the lipid layers as well as its orientation and conformation. We find that by considering these features, we can describe different microscopic states of BODIPY-C12 in the lipid layers that we subsequently assign to the experimentally determined dye populations.
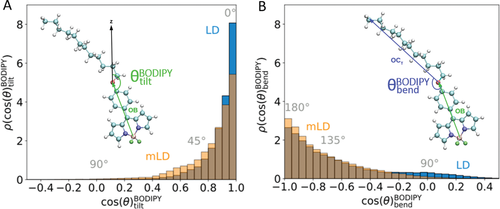
The position of the BODIPY-C12 within the system is characterized by two intrinsic distances, zB,N and zCT,CT. zB,N is the distance in the z-dimension between the boron atom in the BODIPY-C12 headgroup and the N atom of the headgroups of the PC (or PE, in the LD systems) lipid molecules that make up a discretized intrinsic surface (the construction of which is discussed in Supporting Information). zCT,CT is the distance in the z-dimension between the terminal carbon atom in the hydrocarbon tail of the BODIPY-C12 molecule and the terminal carbons in the hydrocarbon tails of the lipid molecules that make up an analogous discretized intrinsic surface. The tilt angle of the BODIPY-C12 headgroup (meaning the fluorescent BODIPY core of the FMR) and internal bend angle of the FMR are used to describe the orientation and conformation of the FMR (defined in Figure 6A,B). BODIPY-C12 is oriented with the OB vector lying normal to the monolayer–water interface (parallel to the z-axis) with B closer to the monolayer–water interface than O when (i.e., ). When BODIPY-C12 is oriented parallel to the z-axis but with O closer to the monolayer–water interface than B, (i.e., ). When BODIPY-C12 is linear, the internal bend angle of the molecule, (i.e., ), while (i.e., ) corresponds to the molecule folding back upon itself.
Experimental measurements are collected after allowing BODIPY-C12 to equilibrate in the lipid droplets for a time far greater than is possible to simulate via MD. Therefore, we only consider the final stage of the MD simulations, that is, after the BODIPY-C12 molecule has clearly entered the lipid system and its orientation has become stabilized. These pre-equilibration portions of the simulations are shown in Figures S5 and S6, Supporting Information, (as the section of all plots without a shaded background) for the mLD and LD systems, respectively. In the LD systems, the dye inserts into and settles in the lipid monolayer (within 30 ns in both replicas), while a more complicated two-step insertion process is observed in the mLD simulations. In the mLD systems, BODIPY-C12 does not enter the lipid monolayer for 80 ns (replica 1) or 65 ns (replica 2). Then the FMR takes until 140 ns (replica 1) or 170 ns (replica 2) to settle into its equilibrium orientation within the lipid monolayer.
In both of the mLD and the LD simulations (Figures S5 and S6, Supporting Information, respectively), generally, BODIPY-C12 is oriented with the boron-containing headgroup near the ester groups of the lipid molecules and the carbon tail of BODIPY-C12 inserted into the neutral lipid layer. However, in the mLD simulations, BODIPY-C12 can be seen to switch between two different tilt angles. Interestingly, this is not the case in the LD system, where a single tilt angle is more prevalent. This is subsequently reflected in Figure 6A, where the tilt angle distribution from the LD simulations is far more strongly peaked at (i.e., the BODIPY-C12 molecule is more strongly constrained to lie parallel to the z-axis), while the mLD distribution has a much heavier tail. This corresponds to more instances of the BODIPY-C12 molecule lying flatter (orthogonal to the z-axis). In both of the mLD and LD simulations, BODIPY-C12 maintains a near-linear conformation (). We see that the LD bend angle distribution is broader than for the mLD (see Figure 6B). The broader range of internal conformational states observed in the LD simulations may be a result of the orientational motion of the entire BODIPY-C12 molecule being more hindered in the LD lipid system.
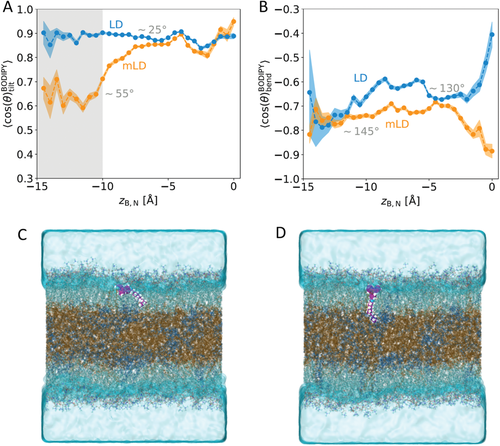
There is a broader distribution of tilt angles in the mLD systems, as shown in Figure 6A. In the LD system, the orientation of the BODIPY-C12 molecule is more constrained vertically. To probe this observation from our simulation results further, we consider the average tilt angle (, Figure 7A) and the average bend angle (, Figure 7B) as a function of the intrinsic distance, zB,N. Interestingly, we see that in the mLD systems, the average tilt angle depends strongly on the position of BODIPY-C12 within the interface of the lipid droplet. When zB,N > −10 Å, the BODIPY-C12 headgroup is nearly parallel with the z-axis (). However, when the hydrocarbon tail of the dye inserts into the neutral lipid layer (zB,N < −10 Å), the BODIPY-C12 headgroup tilts to lie nearly parallel to the monolayer–water interface (). However, in the LD system, the tilt of the BODIPY-C12 headgroup is always such that the molecule is oriented with its headgroup approximately parallel to the z-axis, irrespective of the vertical position of the molecule within the lipid system. Snapshots from the simulations illustrating tilt angles of ≈25° and ≈55° are shown in Figure 7. The average bend angle shows only modest changes as a function of the position of BODIPY-C12 within the lipid monolayer of the lipid droplet. Since the bend angle does not vary in an analogously distinctive way to the tilt angle throughout the monolayer, we attribute the different dye populations observed experimentally wholly to differences in the tilt angle. While we observe the emergence of a significant divergence in the average tilt angle at zB,N < −10 Å between the two systems, the average bend angles converge to the same value in this region. In the mLD systems, BODIPY-C12 has a higher probability of being positioned at zB,N < −10 Å than in the LD systems (see Figure S8, Supporting Information). This further suggests that the flatter headgroup tilt angle observed in this region in the mLD is likely to make up a significant population of the experimental BODIPY-C12 ensemble. We believe that the simulations presented here are the most detailed study to date of FMR orientations in any lipid system.
2.4 Resolution of Experimental Populations
Our final aim is to understand the complex two-population fluorescence anisotropy signal at the microscopic level through insight gained from the simulations. As outlined above, we characterized two states in the mLD system, one of which (the ≈ 25° tilt angle state) is common between both the LD and mLD systems, while the other state (corresponding to a ≈ 55° tilt angle) was only found in the mLD system. We can connect these two states to the experimental data through the fluorescence intensity decay pre-exponential factors which represent the two populations. For the data presented above, the ratio of the pre-exponential factors, and hence of the different populations, were found to be roughly 6:1 (short to long lifetime) for the mLD but 35:1 (short to long lifetime) for the LD system (see Table 3). Within a limited time period (say, a couple of hundred nanoseconds like the simulations here), one would likely observe two states in the mLD system but only one in the LD system; this is precisely what we observe in the simulations. We therefore feel confident in assigning the lifetimes and rotational correlation times to a specific state, and by extension, a specific nano-environment.
| mLD | LD | |
|---|---|---|
| A1 | 4470 | 114200 |
| A2 | 790 | 3180 |
| Ratio | 6:1 | 35:1 |
The most commonly observed state in both systems was that corresponding to an average tilt angle of ≈ 25°. Because it is observed in both the mLD and LD systems, and experimentally both systems show the short lifetime to be the most prevalent (see Table 2), the 25° average tilt angle state corresponds to the shorter lifetime and rotational correlation time component. Based on the mLD system simulations, the longer component then corresponds to the state with a 55° average tilt angle. The fact that only one tilt is found for the LD system could be because the 55° tilt is rare enough that it is unlikely to be observed within the simulation time, but it could also mean that two different viscosity regimes (with the same tilt) actually exist within the LD system.
3 Conclusion
Using a combination of FMR-FLIM and TR-FAIM, we measured fluorescence lifetime and rotational correlation time simultaneously, allowing us to describe the environment of lipid droplet membranes in comprehensive detail. The time-resolved fluorescence anisotropy of an FMR was demonstrated for the first time, with its decay showing unmistakable dip-and-rise behavior. Importantly, we break down the macroscopic concept of viscosity into complementary but distinct, measurable viscosity-related parameters, which helps to build a much more realistic picture of nano-environments in non-isotropic, heterogeneous systems. We used molecular dynamics simulations to resolve the two populations found in the experimental data, enabling us to assign each lifetime and rotational correlation time to a specific average orientation of the BODIPY-C12 molecule within the mLD and LD systems. This is an example of how we can begin to investigate complex biological systems experimentally by supporting interpretation with simulation. Similar approaches (with appropriate model systems) may be applied to a range of complex systems; other organelles, such as mitochondria or lysosomes for which BODIPY-based FMRs already exist, are obvious next candidates.
4 Experimental Section
Experimental Details
BODIPY-C12 is a meso-substituted boron dipyromethene dye, and was synthesized as reported previously.[24] The BODIPY base without the phenyl ring is not sensitive to viscosity.[29]
Solution Work
A stock solution of BODIPY-C12 was prepared in methanol and solutions of varying viscosity were obtained by mixing different ratios of glycerol and methanol (both from Sigma Aldrich). For the calibration Equation (8), mixtures were prepared from 0% up to 90% glycerol at 5% intervals while maintaining the same dye concentration at 3 µM.
TR-FAIM and FLIM Experiments
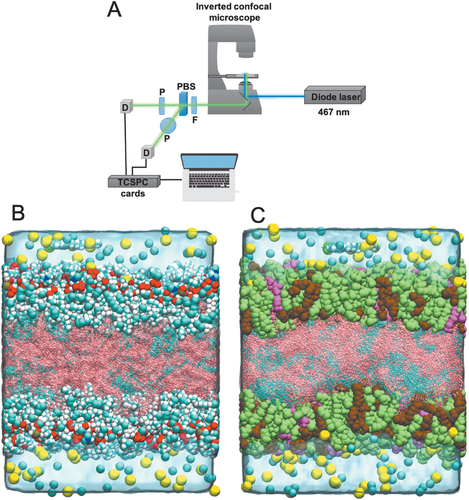
Time-resolved fluorescence anisotropy measurements were obtained using an inverted confocal scanning microscope (Leica TCS SP2) coupled with a 467 nm pulsed diode laser (Hamamatsu PLP 10-470, optical pulse duration 90 ps, repetition rate 20 MHz, average power in the µW region). The fluorescence passed through a band pass filter (520/28 nm from Semrock (FF01-520/28-25) for cell and solution work, 514/30 nm from Semrock (FF01-514/30-25) for model lipid droplets), and a polarizing beam splitter (Edmund Optics) before being collected on two hybrid PMT detectors (Becker & Hickl HPM-100-40, based on a Hamamatsu R10467U-40 hybrid photomultiplier) and fluorescence decays constructed using TCPSC cards (Becker & Hickl, SPC-150) (see Figure 8A). A water immersion 63× NA1.2 objective was used for the cell work and the model lipid droplets. A 5× NA0.15 was used for imaging the multiwell plate with the individual solution measurements. Anisotropy and total intensity was calculated using z = 2, though for a more accurate measurement of lifetimes and rotational correlation times, z should be experimentally ascertained. However, because the aim of this paper was to compare viscosity values from lifetimes and rotational correlation times from the same measurement, it was not deemed a necessary correction.
Cell Work
HeLa cells were cultured in DMEM with 10% FBS, 1% 1× non-essential amino acid, 1 mm sodium-pyruvate, and 0.1 % penicillin/streptomycin on a 75 cm2 culture flask (Greiner) in an incubator at 37 °C with 95% air/5% CO2. The cells were transferred to a 6-well glass bottom plate (WaferGen smartslide-6 micro-incubator) and incubated overnight. The medium was replaced with OptiMEM prior to staining and imaging. To stain, a volume of 20 µL of BODIPY-C12 (stock solution 2.65 mm) was added into each well and agitated, before being placed in an incubator for 30 min. The dye was removed and the cells were washed with clear DMEM five times. Finally, the wells of the micro-incubator were filled by DMEM at 37 °C with 5% CO2 atmosphere and were placed on the stage of the confocal fluorescence microscope to carry out time-resolved fluorescence anisotropy experiments at 37°C. Appropriate aggregation tests are shown and explained in Supporting Information. The instrumental set-up is illustrated in Figure 8A.
mLD Synthesis and Preparation
mLDs were synthesized partly according to a protocol published by Wang et al. in 2016.[30] Specifically, 100 µL of DOPC in chloroform (Sigma) was added to a 200 µL eppendorf tube and dried with N2. 50 µL of buffer B (pH 7.4, 20 mm HEPES, 100 mm KCL, 2 mm MgCl2) was added; then a 2:1 mixture of glyceryl trioleate (Sigma) and cholesterol oleate (Stratech Scientific Ltd), coming to a total of 2.5 mg. The mixture was vortexed 10 s on and 10 s off for 24 cycles, and then centrifuged at 20 000 g for 5 min. The pellet was discarded and the mixture was centrifuged again at 1000 g for 5 min. After the second centrifugation step, no pellet formed.
mLDs were immobilized by incubating them in a poly-l-lysine treated 8-well plate (Ibidi) at 37 °C for 30 min (200 µL in a well). In order to check that neutral lipids had been encapsulated as intended, the supposed mLDs were incubated with 1 µm Nile Red (ThermoFisher) for 30 min, washed, and imaged. Nile Red successfully stained the mLDs which looked spherical and around 1 µm in diameter (see Supporting Information). As a control, 100 µL of DOPC in chloroform was dried into an Eppendorf tube, buffer B was added, and the mix was vortexed and centrifuged like above. Nile Red staining like above was unsuccessful. Finally, mLDs were co-stained with BODIPY-C12 and Nile Red, and imaged for co-localization in two emission windows: 500–550 nm for BODIPY-C12 and 550–650 for Nile Red. Co-localization was done using the Colocalization Threshold plugin in ImageJ (see Supporting Information).
Molecular Dynamics Simulations
All-atom classical molecular dynamics simulations were used in order to gain a molecular scale understanding of the interactions between BODIPY-C12 dye and lipid systems. The lipid droplets were modeled in a planar arrangement, in which a central neutral lipid layer was surrounded by a phospholipid monolayer on either side, and then finally there was a layer of a 0.15 m NaCl aqueous solution (as seen in Figure 8B,C). This general configuration had been used previously in the simulation studies of LDs[28, 31-33]
We created two different models, one with the phospholipid layer consisting of purely 1,2-dioleoyl-sn-glycero-3-phosphocholine (DOPC) molecules (mLD system) and another with the phospholipid layer consisting of 1-palmitoyl-2-oleoyl-sn-glycero-3-phosphocholine (POPC), 1,2-dioleoyl-sn-glycero-3-phosphoethanolamine (DOPE), and 1-stearoyl-2-arachidonoyl-sn-glycero-3-phosphoinositol (SAPI) lipids in a 65:27:8 ratio (LD system), respectively. The neutral lipid phase consisted of triolein and cholesterol ester in a 2:1 ratio. Table 4 contains a summary of the number of each type of molecule in each system. Each system also contained one BODIPY-C12 molecule which was initially inserted into the aqueous phase. Two replicas of each system were created in which the BODIPY-C12 molecule was started in a different position within the aqueous phase.
| System name | Phospholipid layers | Neutral lipid layer | Water | Ions |
|---|---|---|---|---|
| mLD-1 | 348 DOPC | 203 triolein & | 21634 | 58 Na+ & |
| mLD-2 | 101 cholesterol ester | 58 Cl− | ||
| LD-1 | 260 POPC | 229 triolein | 23555 | 95 Na+ |
| LD-2 | 108 DOPE | & | & | |
| 32 SAPI | 114 cholesterol ester | 63 Cl− |
In order to create the systems shown in Figures 8B,C, two lipid bilayers were first built using the CHARMM-GUI membrane builder[34-36] with the compositions shown in Table 4. A 25 Å thick water layer was added above and below each of the bilayers. Both membranes were then neutralized with a physiological salt concentration of 0.15 m NaCl. These initial structures were energy-minimized using steepest descent to remove steric clashes between atoms. Then a series of simulations were carried out in order to equilibrate each of the bilayer systems. These simulations consisted of a series of simulations using the NVT (constant Number of particles, Volume, and Temperature) and then the NPT (constant Number of particles, Pressure, and Temperature) ensembles to equilibrate the temperature and density of the systems. In doing so, the prescribed simulations by CHARMM-GUI[34] were followed. The final NPT stage of these prescribed simulations was run for at least 275 ns.
In order to construct the neutral lipid layer, a bulk system containing triolein and cholesterol ester in a 2:1 ratio in a simulation box was first built, which had the same x− and y−dimensions as the two equilibrated bilayers using the Packmol software.[37] Then a steepest descent energy minimization simulation was used to remove any steric clashes that resulted from the initial construction of the systems within Packmol. This was followed by a NVT simulation run for 25 ps in order to thermalize the systems. Then, the density of the systems was equilibrated using a NPT simulation with a Parrinello–Rahman semi-isotropic barostat in which the compressibility in the x− and y−dimensions was set to 0.0 so that these box dimensions will not change. These simulations were performed for 20 ns. The resulting systems were then modified in order to create a 60 Å layer of neutral lipids with a 2:1 ratio of triolein and cholesterol ester, which was consistent with the thicknesses found to be required to see their effect in previous work.[28]
After equilibrating the bilayers and neutral lipid layer separately, the space between the hydrocarbon tails of the two lipid bilayers was then increased such that it would accommodate the neutral lipid layers. In order to equilibrate these systems, the same simulation protocol was used for these combined systems as described for the lipid bilayer systems themselves. Then using the final configuration from these simulations of the two lipid systems (mLD & LD), a BODIPY-C12 molecule was inserted into the aqueous phase of these systems. The only difference between the two replicas that were created of the two systems was the initial location of the dye molecule, which was randomly chosen within the x−y plane such that they were each at least 10 Å from the same lipid leaflet.
After adding the BODIPY-C12 molecule to each system, a series of molecular dynamics simulations was conducted to equilibrate the system while constraining the motion of BODIPY-C12, so its center of mass remained in the same position. First, a steepest descent minimization was used to remove any steric clashes after inserting the dye molecule in the aqueous phase. Then, an NVT ensemble simulation was used to equilibrate the temperature for 75 ps. Finally, the production simulation with a semi-isotropic NPT ensemble was run for at least 275 ns.
The GROMACS package[38] was used to perform all of the MD simulations reported in this manuscript. In all simulations, the systems were thermostated at a temperature of 295 K, and when a barostat was used, the target pressure was 1 bar. Periodic boundary conditions were applied in all three dimensions. To describe the interactions between the various molecules in the respective systems, the CHARMM36 all-atom force field was used for all lipid molecules[39, 40] and the CHARMM TIP3P model was used for water. The Ligand Reader and Modeler on CHARMM-GUI[34, 41] was used to create the molecular model of triolein and cholesterol ester, which were then parameterized with the CHARMM General Force Field (CGenFF),[42-44] as was done previously for tripalmitin.[45] Finally, the interactions of BODIPY-C12 was described by the same forcefield parameters as were used previously.[6] The Verlet cut-off scheme was employed to generate the pair lists and the electrostatic interactions were calculated using the Particle-Mesh Ewald algorithm. Both electrostatic and van der Waals interactions were cut off beyond 1.2 nm. All bonds involving hydrogen atoms were constrained using the LINCS algorithm.[46]
Acknowledgements
I.E.S. and P.-H.C. contributed equally to this work. I.E.S. would like to thank King's College London for funding her LIDo (London Interdisciplinary Doctoral Programme) iCASE Studentship. R.M.Z. and C.D.L. acknowledge the supportive research environment of the EPSRC Centre for Doctoral Training in Cross-Disciplinary Approaches to Non-Equilibrium Systems (CANES, No. EP/L015854/1). B.C. and P.S. acknowledge the funding provided by the EPSRC DTP Studentship Block Grant. The authors are grateful for the computational support that they received via the United Kingdom's HEC Materials Chemistry Consortium, which is funded by EPSRC (EP/L000202/1, EP/R029431/1) and via the UKCP consortium, which is also funded by the EPSRC (EP/K013831/1, EP/P022472/1), that allowed them to use the ARCHER UK National Supercomputing Service (http://www.archer.ac.uk) and the UK Materials and Molecular Modelling Hub (MMM Hub), which is partially funded by the EPSRC (EP/P020194/1), to carry out the MD simulations reported in this manuscript.
Conflict of Interest
The authors declare no conflict of interest.


