Long-term application of mineral fertilizer weakens the stability of microbial N-transforming functions via the decrease of soil microbial diversity
Abstract
Introduction
Ensuring functional stability is crucial for the sustainable development and soil health of agroecosystems amidst escalating climate changes. Although mineral fertilization is known to enhance the strength of soil N-transforming functions, its effects on functional stability remain unclear.
Materials & Methods
This study evaluated three stability components (resistance, resilience, and recovery), along with the dimensionality of soil microbial N-transforming functions during drought-rewetting process. We investigated enzymatic activity and functional gene abundances after 10 years of fertilization under three strategies, mineral fertilization (NPK), mineral fertilization plus organic amendments (OMN), and no fertilization (CK).
Results
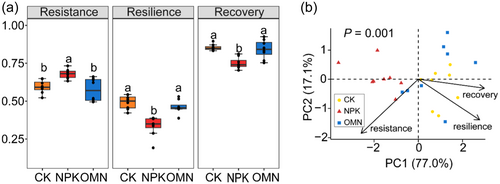
The resistance was 0.60, 0.66 and 0.56; the resilience was 0.46, 0.28 and 0.46; and the recovery was 0.83, 0.73 and 0.82, respectively in the CK, NPK and OMN treatments. Soils with long-term mineral fertilization exhibited the highest resistance but the lowest resilience and recovery during drought-rewetting. Furthermore, mineral fertilization demonstrated the lowest dimensionality of stability, with smallest ellipsoid volume and most negative correlations. Soil microbial alpha diversity was identified as a key predictor of functional stability, positively correlating with stability across fertilization strategies.
Conclusion
Mineral fertilization, which decreased alpha diversity, posed challenges for sustainable development of agroecosystems under drought conditions. Mineral fertilization plus organic amendments provided strong N-transforming functions and moderate stability, making it as an optimal fertilization strategy. These results offer valuable insights for optimizing agroecosystem management and advancing soil sustainability.
1 INTRODUCTION
In ecological studies, soil microbial communities serve as critical safeguard against environmental disturbances (Banerjee and van der Heijden, 2023), enabling ecosystem functions to revert to a reference state after disturbances (Griffiths et al., 2008; Shade et al., 2011). Previous studies have shown that microbial community composition is highly sensitive to external disturbances (Allison and Martiny, 2008), while microbial functions often exhibit lower sensitivity and relative stability (Mori et al., 2016). This decoupling between microbial functions from taxonomic composition can be attributed to functional redundancy within soil microbial communities (Louca et al., 2018). As a result, focusing on soil microbial functional traits will provide a more direct basis for predicting their responses and feedback to environmental changes.
Agroecosystems, as anthropogenic ecosystems highly affected by agricultural practices, like all natural ecosystems, are currently facing increasingly intense climate extremes, for example, warming and severe drought (IPCC, 2019; Jansson and Hofmockel, 2020). These changes pose significant challenges to food security and soil health worldwide. Maintaining microbial functional stability is essential for agroecosystems to endure these perturbations and sustain critical ecological processes amidst both farmland management practices and climate changes. Therefore, soil microbial functional stability is vital for the sustainable development of soil (Qiao et al., 2022) and overall soil health (Sommer et al., 2017). Fertilization, mainly with nitrogen (N), is a common agricultural practice to improve crop yield and meet an increasing global demand for food production (Ju et al., 2009; Maeder et al., 2002). Mineral fertilization, in particular N fertilization has been well known to increasing N availability and enhancing microbial N-transforming functions (Chu, Lin et al., 2007). However, it remains uncertain how mineral fertilization affects the stability of these microbial functions in the context of escalating climate changes.
Soil microbial stability comprises three components: resistance, resilience and recovery (Pimm, 1984). Resistance refers to the extent to which the functions of microorganisms remain unchanged when disturbed. Resilience is the speed at which microbial functions return to its reference state. Recovery is the ability to fully return to the pre-disturbance state and reach a new equilibrium (Ingrisch and Bahn, 2018; Ives et al., 1999). However, a key challenge in stability studies is that the components of stability often respond differently to disturbances. For instance, the community with higher resistance have been observed to exhibit either lower resilience (de Vries et al., 2012) or lower recovery (van Kruistum et al., 2018) under drought disturbance. In grassland, stability components were found to be largely uncorrelated, indicating disparate and multidimensional responses to eutrophication (Chen et al., 2023). Therefore, relying on just one component may misrepresent overall stability.
To address this issue, the dimensionality of stability (DS) approach was introduced to recognize the nonindependence of stability components and simplify the concept of stability (Donohue et al., 2013). This approach provides a single and more intuitive indicator of stability, which compared by the volume, orientation and shape of multidimensional ellipsoids in stability components. The approach has been applied in freshwater ecosystems, where DS was found to be mainly affected by nutrient content (Hillebrand et al., 2018; Polazzo and Rico, 2021). However, this approach has not yet been widely used in soils with high heterogeneity. In agroecosystems, a quantitative assessment of stability using the DS approach can be a valuable tool for guiding management strategies (Polazzo and Rico, 2021).
The North China Plain is a major grain-producing region in China, contributing to approximately one-quarter of the country's total cereal crops. The soils in this region are typically low in fertility and frequently experience severe drought disturbances stemming from the monsoon climate (Zhao, et al., 2010). The Fengqiu field experiment, which has been running for over 10 years, is located in the heart of the North China Plain, provides a valuable opportunity to explore microbial functional stability under long-term fertilization. In this study, we investigated the effects of three fertilization strategies (mineral fertilization, mineral fertilization plus organic amendments and no fertilization) on enzymatic activities and N-related functional genes under a process of drought disturbance and rewetting. Then we assessed three stability components, resistance, resilience and recovery, and along with the DS of soil microbial N-transforming functions. The aims of this study were (1) to assess stability when stability components exhibiting various tendency; (2) to identify key factors influencing microbial functional stability in agroecosystems, and (3) to examine the effects of long-term fertilization on the stability of soil microbial N-transforming functions. We hypothesized that both long-term of mineral fertilization and no fertilization would weaken microbial N-transforming functional stability while mineral fertilization plus organic amendments would enhance functional stability.
2 MATERIALS AND METHODS
2.1 Soils
Soil samples were collected from a long-term fertilization plot experiment at Fengqiu Agroecological Experimental Station (35° 00′ N, 114° 24′ E), Henan province, China. The soil is classified as Aquic Inceptisol, with a texture of sandy loam. The plot experiment was established in 2011 under a rotation of winter wheat (Triticum aestivum L.) and summer maize (Zea mays L.). Three fertilization strategies: CK (without fertilization), NPK (mineral NPK fertilization) and OMN (mineral NPK fertilization plus organic amendments) were used as the treatments in the current study. For the NPK treatment, N, P, and K were applied in the form of urea (200 kg hm−2), superphosphate (80 kg hm−2), and potassium sulphate (150 kg hm−2), respectively for maize and wheat season. The treatments NPK and OMN were designed to supply the same rate of total N. For the treatment OMN, one-half of N came from urea and the other half was from composted mushroom residues. All superphosphate and potassium sulphate were applied as basal fertilizers, whereas urea was applied as both basal and supplementary fertilizers. Other details of the site history and experiment layout have been described by Yao et al., (Yao et al., 2020).
In June 2021, after the harvest of wheat, soil samples were collected from each plot at a depth of 0–15 cm. Soils were mixed to form one sample after visible roots and stones were removed. The soil samples were passed through a 2-mm sieve. One portion was air-dried for the analysis of soil physicochemical properties, and the rest was stored at 4°C until the start of the incubation experiment.
2.2 Experimental design
In the incubation experiment, 40 g of soil from each fertilization strategy was placed into 100 mL plastic bottles. Bottles were divided into two groups: one for drought-rewetting treatment the other for a non-stressed control (Figure 1). Before the drought-rewetting regimes, all soil samples were adjusted to 55% water-holding capacity (WHC) and pre-incubated at 28°C for 14 days. Then, drought disturbance was applied by leaving bottles opened at 28°C for 16-days. The soil moisture reduced down to 6% WHC (i.e. 1.8% w/w) at day 22 and maintained constantly for another 8 days. Afterwards, the drought-disturbed soils were rewetted by surface amendment of deionized water and followed by an incubating under a constant moisture of 55% WHC for 42 days. The non-stressed control samples were maintained at a constant soil moisture of 55% WHC during the whole monitoring period. Destructive sampling was performed twice after drought disturbance on day 22 and day 30, and twice after rewetting process on day 51 and day 72 (Figure 1). Each treatment had four technical replicates at each sampling time. After verifying using Two-tailed t-test (p < 0.05) that there were no significant differences in calculated stability components between day 22 and day 30, or between day 51 and day 72, the twice sampling, respectively from drought and after rewetting phases were combined. For further estimation of stability components, eight replicates per fertilization strategy were used.

2.3 DNA extraction and high-throughput sequencing of 16S rRNA genes
Total DNA was extracted from 0.5 g soil by using a FastDNA SPIN Kit for soil (MP Biomedicals, Santa Ana, CA). The extracted DNA was dissolved in 80 µL DES buffer, with quality evaluated by NanoDrop 2000 (Thermo Scientific, USA) and stored at −20°C until further usage. PCR amplification was conducted for bacteria with primer set 515 F (5′-GTGCCAGCMGCCGCGGTAA-3′) and 907 R (3′-CCGTCAATTCMTTTRAGTTT-5′). Five-bp barcoded oligonucleotides were fused to the forward primer. PCR was carried out in 50 μL reaction mixture, containing the following components: 15 μmol·L−1 forward and 15 μmol·L−1 reverse primers, 1.25 μmol·L−1 dNTP, 2 μmol·L−1 Premix Taq (TaKaRa, Japan), and 1 μL (50 ng) genomic DNA template. Negative controls were treated with double distilled water (ddH2O) instead of the DNA template. After pre-denaturing at 98°C for 4 min, 30 cycles of PCR for 16S rRNA gene were performed (98°C for 30 s, 55°C for 60 s, 72°C for 60 s) with a final extension at 72°C for 10 min. High-throughput sequencing was performed with Illumina Miseq sequencing platform. The barcoded PCR products from all samples were normalized in equimolar amounts before sequencing. After sequencing was completed, 16S rRNA genes data were processed using the QIIME pipeline for data sets (Caporaso et al., 2010). Sequences were assigned to soil samples based on the unique barcodes, and sequences with quality score below 25 and the length fewer than 200 bp were trimmed. Sequences were binned into OTUs using a 97% identity threshold. Taxonomy was then assigned to OTUs with reference to a subset of the SILVA 119 database (http://www.arb-silva.de/download/archive/qiime/). The rarefaction level was determined by the sample that had the lowest number of reads. All samples were rarefied to 24034 sequences to subsequent analysis.
2.4 Analysis of microbial N-transforming functions in drought-rewetting incubation
Soil ecoenzymatic activities and the abundance of specific functional genes were used to assess soil microbial N-transforming functions. Three key ecoenzymes, leucine aminopeptidase (LAP), N-acetyl-β-glucosaminidase (NAG) and β-N-acetylgalactosaminidase enzymes (NAGA) were analyzed. These ecoenzymes, produced by soil microorganisms, play crucial roles in in the breakdown of nitrogeneous organic matter and nitrogen transformation. LAP hydrolyzes the peptide bonds in proteins and peptides to releasing free amino acids. NAG breaks down N-acetylglucosamine residues from chitin, a major component of fungal cell walls. NAGA hydrolyzes N-acetylglucosamine-containing oligosaccharides and proteins, contributing to the degradation of complex compounds like such as plant and bacterial cell wall (Zhang et al., 2018).
The activities of the ecoenzymes were detected using fluorogenic substrates (Marx et al., 2001). Details about the functions and fluorometric substrates used are provided in Table S1. Briefly, homogeneous soil suspensions (1:10 w/v, in 0.05 M Na2CO3 solution with pH = 8.0) were prepared and pipetted into a 96-well black microplate with three technical replicates. Specific fluorometric substrates were added to the wells and the assay plate was incubated for 30 min at 28°C in the dark. Fluorescence was then measured at an excitation wavelength of 360 nm and an emission wavelength of 450 nm using Fluorescence Microplate Reader (BioTek, In-Vitro Diagnostic Synergy H1, USA). Each plate included a negative control and fluorescence standard curves. Ecoenzymatic activities were expressed in nmol fluorescent product per hour per gram of dry soil.
Functional genes involved in nitrification and denitrification were evaluated using quantitative polymerase chain reaction (qPCR) analysis. Both processes are crucial for nitrogen cycling in agroecosystems. The study focused on the following key genes: amoA, encodes the ammonia monooxygenase subunit A and is primarily found in ammonia-oxidizing archaea (AOA) and bacteria (AOB), as well as nirS and nirK, which encode nitrite reductase and are present in various denitrifying bacteria. The primer sequences and protocols of functional genes were shown in Table S2. Assays were performed in a 20 μL reaction volume containing 2 μL of template DNA, 0.2 μL of forward primer, 0.2 μL of reverse primer, 10 μL of SYBR Premix and 7.6 μL of double-distilled water (ddH2O). All qPCR reactions were run in technical duplicates. Standard curves were obtained using serial dilutions of a known amount of linearized plasmid DNA containing specific gene fragments.
Additionally, the normalized OTU table was submitted to the local PICRUSt2 for prediction, and the final functional predictions based on Kyoto Encyclopedia of Genes and Genomes (KEGG) pathways were created. Then we selected the enzyme classification number (EC) participated in soil nitrogen cycling based on KEGG pathway-map00910, which were described in Table S3 (https://www.genome.jp/kegg/kegg2.html).
2.5 Soil properties of tested soils: Background information from the field experiment
Soil chemical properties were analyzed before the drought disturbance of the soil samples, according to Lu's protocols (Lu, 2000). Soil pH was measured in a 1:2.5 mass/volume soil-water suspension using a compound electrode (PE-10; Sartorius, Germany). Soil organic matter (SOM) was determined by FeSO4 titration after dichromate oxidization. Total nitrogen (TN) was determined by Kjeldahl digestion. Soil available nitrogen (AN) was determined by titrating NH3 produced by alkali hydrolysis. Soil total P (TP) and K (TK) were first digested by hydrofluoric acid (HF)-perchloric acid (HClO4) and then determined following molybdenum-blue colorimetry and flame photometry, respectively. Available P (AP) in the soil was extracted by sodium bicarbonate and determined using the molybdenum-blue method. Available K (AK) in the soil was extracted by ammonium acetate and determined by flame photometry.
The activity of dehydrogenase (DHA) was determined by converting triphenyltetrazolium chloride to triphenylformazan (Chu, Lin et al., 2007). Briefly, 2.5 g of fresh soil was incubated with 2.5 ml 1% TTC–tris buffer (pH 7.6) at 37°C for 24 h, then the absorbance was measured at wavelength of 485 nm. The abundance of bacteria was determined by qPCR with primer set 515 F and 907 R as described in Section 2.3.
2.6 Calculation of stability components
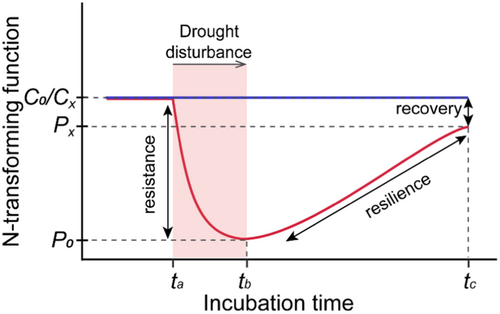
The resistance values were bounded between −1 and 1, where the value of 1 indicated no changes in response to the disturbance (complete resistance), the value of 0 indicated a 100% change (no resistance), and negative values indicated a change exceeding 100%. The resilience values were also bounded between −1 and 1, where the value of 1 represented complete recovery of the disturbed soil (maximal resilience), and lower values indicated decreased resilience. The recovery values were always positive, and the value of 1 indicated full recovery (maximal recovery). To synthesize the stability of soil microbial N-transforming functions, we averaged stability components calculated from the following parameters: LAP, NAG, NAGA, AOA, AOB, nirS, nirK, and EC as described in the Section 2.4.
2.7 The dimensionality of microbial N-transforming functional stability
2.8 Statistical analysis
To describe alpha diversity of soil microbial communities, we calculated richness (observed OTUs), the Shannon index, the Simpson index and the Evenness index. Beta diversity was assessed by the first axis of the PCoA (bray_PCoA1), extracted with the Bray-Curtis distance using the “vegan” package in R Language. Phylogenetic diversity was assessed by the first axis of PCoA (MNTD_PCoA1), extracted based on SES. MNTD. SES. MNTD was the standardized effect size of the mean nearest taxon distance (SES. MNTD), calculated with the null model “taxa. labels” (999 randomization) in the “ses. mntd” function within “picante” package (Kembel et al., 2010). Additionally, the diversity of N-transforming functions predicted based on 16S rRNA (PICRUSt2) was evaluated with Shannon and Simpson indexes.
Significance statistics among the fertilization strategies were performed by Tukey's post hoc test (p < 0.05), following the homogeneity of variance, the tests of assumptions of normal distribution and ANOVA, using version 20.0 of the IBM Statistical Product and Service Solutions (SPSS) Statistics.
Principal component analysis (PCA), based on the Euclidean dissimilarity, was performed to explore differences in microbial N-transforming functional stability of three fertilization strategies, using the “factoextra” package in R language. The first axis of PCA (stability_PC1) was extracted to represent microbial N-transforming functional stability.
Ellipses were constructed using the covariance matrices of stability components and visualized using the “ggplot2” package in R language. We used Permutation tests (×10,000) to compare the ellipsoidal semi-axis length and volume of different fertilization treatments, which was performed using “perm. test” function in R language. Graphical representation of the DS was performed by Origin 2024.
The correlations between microbial N-transforming functional stability and soil properties were analyzed using the Mantel test (R language, “linkET” package). The main predictors affecting the stability components were assessed by Random Forest analysis (R language, “randomForest” package), where the mean square error increase (%, mean square error, MSE) was used to characterize the importance of each predictor. The response and significance of each dependent variable was then assessed using the “rfPermute” package in R language. The significance of Random Forest was evaluated by “A3” package. After z score standardization, the relationship between stability and alpha diversity was analyzed by Pearson correlation.
3 RESULTS
3.1 Resistance, resilience and recovery under different fertilization strategies
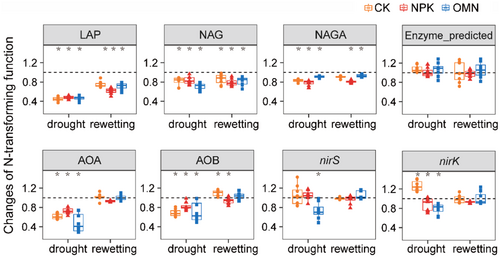
Percentage of N-transforming functions relative to the non-stressed control were used to assess the response of N-transforming functions to the drought-rewetting process. Ecoenzymatic activities and functional gene abundances significantly decreased following drought and recovered with the rewetting (Figure 3). Compared to the non-stressed control, functional gene abundances fully recovered whereas ecoenzymatic activities remained suppressed 42 days after rewetting (Figure 3).
The N-transforming functions in the NPK treatment exhibited significantly higher resistance, but significantly lower resilience and recovery compared to the CK and OMN treatments (p < 0.05, Figure 4a). No significant differences were observed in the individual stability component between the CK and OMN treatments (p > 0.05, Figure 4a). Stability components of individual N-transforming functions showed similar tendency, listed in Table S4. Principal components analysis (PCA) visualized differences in stability components of N-transforming functions among three fertilization strategies (Figure 4b). The PC1 accounted for most of the variation (77.1%), with resistance, resilience and recovery contributing 27.2%, 34.7% and 38.1%, respectively. As displayed by PCA, stability of treatment NPK was clearly distinguished from treatments CK and OMN (Figure 4b), which was confirmed by the PERMANOVA pairwise test (p < 0.05, Table S5).
3.2 Dimensionality of microbial N-transforming functional stability under different fertilization strategies
Since the components of microbial N-transforming functional stability demonstrated inconsistently (Figure 4a), we further evaluated the DS of three fertilization strategies by constructing multidimensional ellipsoids (Figure 5a) and calculating their ellipsoidal semi-axis lengths (Figure 5b) and volumes (Figure 5c). For comparison, the maximum semi-axis length was standardized to 1 for all strategies. The length of semi-axis 2 was ranked as OMN (0.92) > CK (0.83) > NPK (0.64), with the OMN treatment exhibiting a significantly longer semi-axis 2 than CK and NPK treatments. Semi-axis 3 was significantly shorter in the NPK (0.27) and OMN (0.24) treatments compared to the CK treatment (0.54). The NPK treatment, characterized by high variation in the lengths of its semi-axes, resembled a “cigar” shape, whereas the CK treatment more closely approximated a “spheroid” shape (Figure 5a,b), and the OMN treatment were intermediate. The volumes of the ellipsoids also reflected these differences, following the order CK > OMN > NPK (Figure 5c). Therefore, the NPK treatment demonstrated the lowest stability dimensionality among the three fertilization strategies.
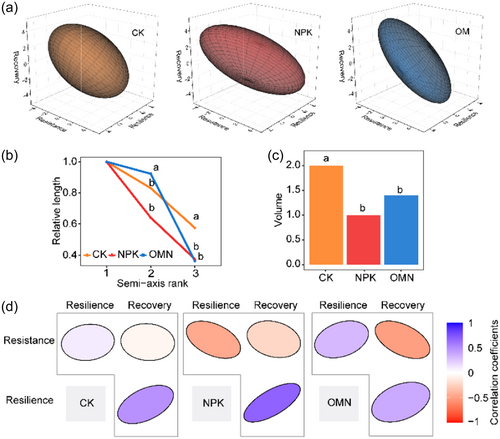
Stability components generally showed weak correlations in the CK treatment (Figure 5d), indicating a lack of interactions among three components. In the NPK and OM treatments, recovery negatively correlated with resistance and positively correlated with resilience. Specifically, in the NPK treatment, resistance had a significantly negative correlation with resilience (Figure 5d), while in the OMN treatment, resistance was positively correlated with resilience (Figure 5d). The NPK treatment exhibited more negative correlations compared to CK and OMN, suggesting that mineral fertilization resulted in greater constraints among stability components and adverse effects to microbial N-transforming functional stability.
3.3 Factors determining the stability of microbial N-transforming functions
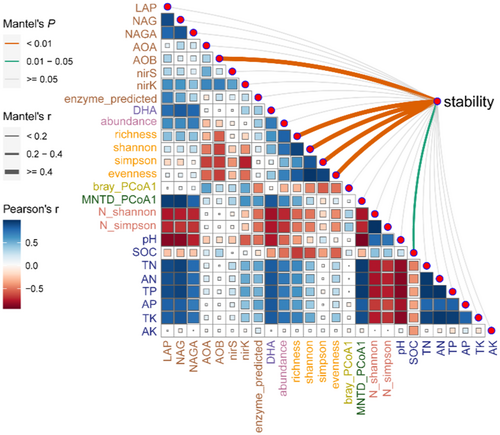
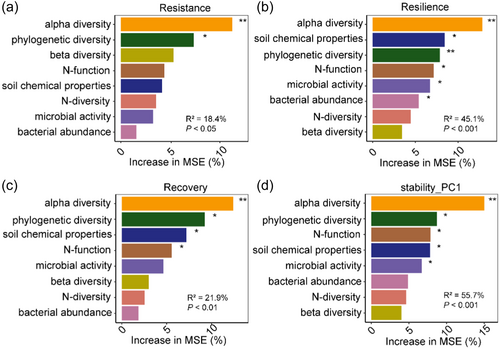
The Mantel test revealed that microbial N-transforming functional stability components were highly correlated with the alpha diversity of soil bacterial community, including richness, Shannon, Simpson and Evenness indexes, and were significantly correlated with SOC content (Figure 6). To further identify reliable predictors of microbial N-transforming functional stability, Random Forest analyses were performed with synthesizing the environmental parameters into different categories. The Random Forest analysis consistently indicated that alpha diversity were the most reliable predictors of three stability components and stability-PC1 (Figure 7).
4 DISCUSSION
4.1 Dimensionality of microbial N-transforming functional stability
Three components of soil microbial N-transforming functional stability responded inconsistently to drought-rewetting across fertilization strategies. Resistance was highest whereas resilience and recovery were lowest in the NPK treatment, while the opposite pattern was observed in the CK and OMN treatments (Figure 4a). This inconsistency among stability components aligns with a prediction that a system with high resistance to disturbance allows less scope for resilience (resulting a negative resistance–resilience correlation), while systems with small initial changes or fast recovery are prone to achieve high recovery, resulting in a positive resilience–recovery correlation (Hillebrand et al., 2018). Similarly, environmental changes can provoke trade-offs in ecological stability, stabilizing dynamics in some dimensions, while simultaneously destabilizing them in others (Yang et al., 2019).
To evaluate how stability responds to fertilization strategies with inconsistently responded components, our study introduced the concept of DS in the agroecosystem for the first time. In this approach, smaller ellipsoid volume and more negative correlations among stability components indicate lower DS, and vice versa. Our results showed that fertilization, in particular mineral fertilization, reduced the DS of soil N-transforming functional stability with this approach (Figure 5). The weak correlations, as observed in the CK treatment, indicated that each component provides unique information for stability with fewer interactions (Domínguez-García et al., 2019). Conversely, more positive correlations (as observed in the OMN treatment) support simultaneous improvement of stability components, while more negative correlations (as observed in the NPK treatment) hinder the simultaneous enhancement of all components, with improvement in one component likely coming at the expense of another (Radchuk et al., 2019). Therefore, higher DS generally benefits management practices by allowing maximization of one or more stability components at the same time (Radchuk et al., 2019).
4.2 Alpha diversity is the main factor determining microbial N-transforming functional stability
Soil microbial alpha diversity was identified as the most significant predictor determining the microbial N-transforming functional stability across fertilization strategies, according to Mantel Test and Random Forest analysis (Figure 7). A positive correlation was observed between alpha diversity and functional stability (Figure 8), which was consistent with the findings by Liu et al. (2022) and Xun et al. (2021). This supports the notion that reductions in alpha diversity can lead to decreases in functional stability (Hautier et al., 2015).
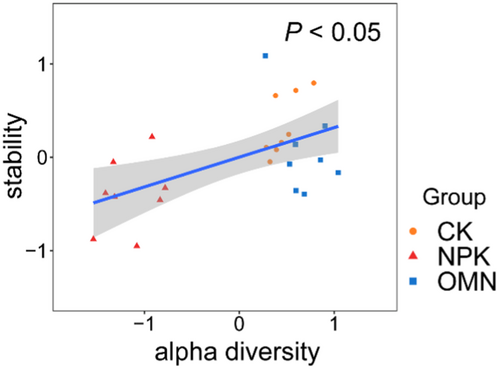
Due to anthropogenic agricultural activities, agroecosystems have been considered having the lowest above-ground biodiversity, therefore, the role of under-ground microbial diversity in sustaining ecosystem functions is of heightened significance in comparison to other natural ecosystems (Lemanceau et al., 2015). This highlights the critical importance of maintaining diverse species in soils, particularly in agroecosystems. Two key mechanisms that explain the positive relationship between alpha diversity and functional stability are “the insurance effect” and “the complementary effect”. The insurance effect (Thibaut and Connolly, 2013) posits that diverse microbial communities enhance stability by providing a larger species pool. This concept emphasizes that a larger and more varied species pool ensures that multiple species can perform similar functions, so-called microbial functional redundancy. As a result, if some species are adversely affected by environmental disturbances, other species can compensate for their functions, thus maintaining the overall functionality of the ecosystems (Chaer et al., 2009). The complementary effect (Wen et al., 2020) suggests that high diversity allows some species to outcompete others and adapt to temporal environmental variations, thereby preserving overall community functions (Jiang et al., 2022). Higher alpha diversity results in greater asynchrony within microbial communities, leading to varying responses to environmental disturbances (Valencia et al., 2020; Wagg et al., 2018).
4.3 Mineral fertilization (NPK) weakened microbial N-transforming functional stability
Our results revealed that long-term mineral fertilization exhibited the lowest stability dimensionality among the three fertilization strategies (Figure 5). Additionally, under non-stressed control, the NPK treatment showed highest coefficient of variation (CV) in N-transforming functions (Table S6), further indicating reduced stability associated with mineral fertilization. The decreased stability of microbial N-transforming functions with mineral fertilization was mainly due to the significant reduction in alpha diversity, evidently observed in the NPK treatment (Figure S1). Functional stability is commonly lower in systems with high nutrients supply, leading to stronger competitive interactions among microorganisms (Radchuk et al., 2019; Yang et al., 2019). Negative interactions among microbial species can diminish both diversity and stability (Ratzke et al., 2020). Consistent with this, molecular ecological network analysis supported that the NPK treatment had the highest percentage of negative links among bacterial community interactions compared to the CK and OMN treatments (Table S7). Therefore, long-term mineral fertilization, which lowered alpha diversity, pose challenges the sustainable development of agroecosystem under drought disturbance.
Functional stability is influenced by the adaptation of soil microbial communities (Strickland et al., 2009), and shifts in these communities can significantly impact functional stability. Our previous study revealed divergent patterns of community shift, with mineral fertilization (NPK) exerting a substantial effect on a small proportion of taxa (1.17% of bacterial genera), whereas combined fertilization (OMN) having a moderate effect on a larger number of taxa (16.76% of the bacterial genera) (Yao et al., 2020). Mineral fertilization has been associated with notable variation in the relative abundance of specific microbes involved in N cycling (Chu, Fujii et al., 2007), such as ammonia-oxidizing bacteria (Strauss et al., 2014) and those participating denitrification like Bacteroidetes and Gemmatimonadetes (Hu et al., 2015). However, if the key species essential for N-transforming functions are severely impacted or lost by drought, their functional roles may face significant challenges, potentially hindering the recovery of ecosystem functions.
It is worth noting that soils without fertilization (CK) exhibited the highest DS of microbial N-transforming functions, which was out of our expectation (Figure 5). However, despite the high stability, the microbial N-transforming functions in the CK treatment were much lower than both fertilization treatments (Table S8, Figure S1_N function). This was a stable state with a low N-transforming function. On the contrary, mineral fertilization exhibited a high N-transforming function with a low function stability. The combined fertilization (OMN) accounted for high N-transforming functions (Figure S1) and moderate functional stability (Figure 5), making it an optimal fertilization strategy in the agroecosystems. Our results highlight that functional stability does not positively correlate with functional strength, i.e. the magnitude of microbial functions, which was inconsistent with the findings of Wang et al. (2021) and Yan et al. (2021). This discrepancy suggests that assessing soil health requires a nuanced approach that considers the trade-offs between functional strength and functional stability, to accurately preserve agroecosystem services in the context of escalating global changes.
AUTHOR CONTRIBUTIONS
Zhou Zhang: Conceptualization, experiments, data analysis, original draft preparation. Ruirui Chen: Conceptualization, soil collection, project administration, writing—review and editing. Evgenia Blagodatskaya: Methodology, project administration, writing—review and editing. Sergey Blagodatsky: Writing—review and editing. Deyan Liu: Data curation, review. Yongjie Yu: Soil collection, review. Youzhi Feng: Conceptualization, soil collection, data curation, review.
ACKNOWLEDGEMENTS
We are grateful to Mr. Liangguo Bo for his support in the field work. We acknowledge the financial support from the National Key Research and Development Program of China (2022YFD150030402 and 2023YFD1502100), the National Natural Science Foundation of China (42377482).
CONFLICT OF INTEREST STATEMENT
The authors declare no conflicts of interest.
ETHICS STATEMENT
The authors have nothing to report.
Open Research
DATA AVAILABILITY STATEMENT
The data that support the findings of this study are available from the corresponding author upon reasonable request.


