Water stagnancy and wastewater input enhance primary productivity in an engineered river system
Abstract
Under warming conditions and with increasing human perturbations, rivers across the globe are facing drastic shifts in their hydrologic regime, resulting in fragmentation and disconnection from the catchment. Subsequently, a dependency on in situ primary productivity as the source of organic matter increases and warrants detailed investigation of the nature of primary production in urbanized river systems. In this study, primary productivity was estimated at multiple locations along the continuum of an engineered (Sabarmati) and a free flowing (Mahi) river systems in India using 13C tracer incubation method. Significantly enhanced primary productivity in the riverfront (engineered construction along the Sabarmati that holds water supplied by a canal) and polluted downstream of the Sabarmati compared to free flowing Mahi was observed. It was also observed that water stagnancy, temperature, and nutrient availability were the key factors regulating the rates of primary productivity in the urban river system. The study highlights the salient features of riverine primary productivity associated with engineered modifications, which needs to be considered for future river development projects.
1 INTRODUCTION
Rivers play a significant role in the global carbon (C) cycle, as they act as active reactors of organic matter and conduits of greenhouse gases to the atmosphere (Aufdenkampe et al., 2011; Cole et al., 2007; Drake et al., 2018). Rivers as bioreactors are sustained by the availability and degradation of organic matter (Machado-Silva et al., 2023). Apart from allochthonous inputs, in situ primary productivity is a major contributor of organic matter in rivers by fixing inorganic C into biomass. The organic matter formed, acts as substrate and fuels several biogeochemical processes like methanogenesis and drive the lateral export of C along with the evasion of CH4 and CO2 from the system (Bertuzzo et al., 2022; Webb et al., 2019). Riverine primary productivity is governed by several factors including light availability, water temperature, nutrient availability, and the residence time of water (Jia et al., 2019; Lee et al., 2015; Li et al., 2014; Lürling et al., 2013). Landcover and catchment characteristics also affect riverine biogeochemistry by regulating the inputs of organic matter and nutrients along with occasional light availability (Blaszczak et al., 2019). The net role of rivers as source or sink of CO2 depends on the balance between primary productivity and respiration. In many steams, it is observed that gross primary productivity (GPP) is less than ecosystem respiration resulting in net heterotrophy (Cole et al., 2007; Duarte & Prairie, 2005). Studies have estimated stream GPP and ecosystem respiration in the range of 1–2500 and 15–14,000 mg C m−2 d−1, respectively, indicating the dominance of respiration over primary production (Battin et al., 2008; Bernhardt et al., 2022; Demars et al., 2011; Gagne-Maynard et al., 2017; Neely & Wetzel, 1995; Odum, 1956; Ward et al., 2018; Wissmar et al., 1981).
Over the last few decades, rivers across the globe have faced the direct consequences of climate change and anthropogenic interventions, resulting in drastic shifts in their flow regimes. Currently, only 37% of rivers that are longer than 1000 km remain free flowing over their entire length and 51%–60% of rivers do not flow for at least 1 day per year (Grill et al., 2019; Messager et al., 2021). The flow intermittency and obstruction has serious consequences on the riverine biogeochemistry affecting the nature of C cycling (Han et al., 2018; Silverthorn et al., 2023; Wang et al., 2018, 2022). Fragmentation and disintegration of river systems from the catchments limit the availability of allochthonous organic matter and increases the dependency on in situ primary production (Collins et al., 2016; Jacquet et al., 2022). Furthermore, urbanization and land use change result in excessive inputs of nutrients that further affects primary productivity (Jia et al., 2019; Yoshikawa et al., 2017). Therefore, it is timely to assess the nature of primary productivity in urbanized river systems and decipher various environmental controls on the same. In this regard, the present study aims to understand the role of water stagnancy caused due to human perturbations of river channels and wastewater inputs on the riverine primary productivity by quantifying the rates of primary productivity along the river continuum.
2 MATERIALS AND METHODS
2.1 Study area
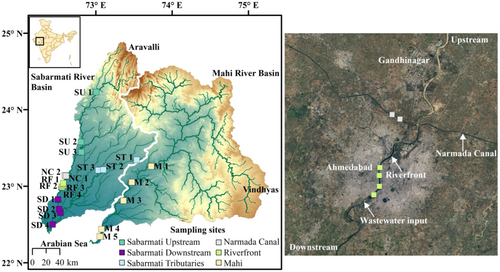
To address the above objectives, primary productivity experiments were performed along the continuum of two rivers (Sabarmati and Mahi) situated in semi-arid climate zone of the Indian state of Gujarat. Sabarmati is highly perturbed by engineering modifications, whereas the Mahi is relatively free flowing (Figure 1). Draining a catchment of 21,674 km2, the Sabarmati River has its headwaters in the Aravalli hills and flows ~371 km to ultimately drain into the Arabian Sea. Twin cities, Gandhinagar and Ahmedabad (population > 6 million), are located along the banks of the river and the latter is responsible for discharge of large amounts of wastewater and industrial effluents into the river (Figure 1) (Mohanty et al., 2021). As the river passes through Ahmedabad, a riverfront (lined on both sides) is constructed that holds water in stagnancy over prolonged periods. The water in the riverfront is largely supplied by a canal system (Narmada Canal) fed by the Narmada River, a major river in the central India (Figure 1). The downstream reach of Sabarmati is highly polluted and runs ~70 km before draining into the Gulf of Khambhat. The Mahi River rises near the Mahi Kanta hills (Vindhyachal range) in the western part of the state of Madhya Pradesh. It is bound by the Aravalli hills and the Vindhayas in the north and south, respectively. The Mahi rivers traverses a length of 583 km before draining into the Arabian Sea.

2.2 Sample collection and incubation experiments
Sampling was conducted along the mainstem and selected tributaries of the Sabarmati and the mainstem of the Mahi River in February 2021 (Figure 1). To observe the effect of human perturbations, sampling locations in the Sabarmati mainstem was classified into upstream, riverfront, and downstream reaches. Additionally, to observe the effect of water stagnancy, samples were collected from the Narmada Canal (source of water for the riverfront) for comparison. Water temperature, electrical conductivity (EC), and pH were measured in situ using handheld probes (HANNA). Dissolved oxygen (DO) was estimated using the Winkler titration method (Grasshoff et al., 1983). Samples for particulate matter were collected in Nalgene bottles and kept in the dark until incubation and filtration. Water samples for dissolved inorganic carbon (DIC) were collected in airtight serum glass bottles with butyl rubber septa and aluminum caps and poisoned using saturated HgCl2. Water samples for dissolved inorganic nitrogen (DIN: nitrite (NO2−), nitrate (NO3−), and ammonium (NH4+)) were collected in 60 mL high density polyethylene (HDPE) bottles and kept frozen (at −20°C) until analysis. For particulate organic matter (POM), sample water was filtered onto 0.7 µm GF/F filters (precombusted at 400°C for 4 h). For primary productivity estimation, samples were incubated in 1 L polycarbonate Nalgene bottles (in duplicates) and spiked with 98+ atom % enriched 13C-NaHCO3 prepared using ultrapure water (Choi et al., 2020; Molinari et al., 2021). The tracer volume was selected such that it was <10% of the ambient DIC concentration. The samples were incubated for 4 h in sunlight (approximately between 10:00 a.m. and 2:00 p.m. local time). Similar to POM, postincubation samples were also filtered onto GF/F filters and dried in an oven overnight at 60°C for mass spectrometric analysis. For C content and its isotopic composition, a portion of filters were fumigated with HCl to remove the inorganic C fractions, whereas N content and its isotopic compositions were measured in unfumigated portions.
2.3 Sample analysis
Carbon (natural POM and incubated samples) and Nitrogen (N) (natural POM) contents and their isotopic compositions were measured using an elemental analyser (EA) interfaced to an isotope ratio mass spectrometer (IRMS) (Flash 2000-Delta V Plus; Thermo Fisher Scientific). International Atomic Energy Agency (IAEA) standards of cellulose (IAEA -CH-3; δ13C = –24.72‰ and C content = 44.4%) and ammonium sulfate (IAEA-N-2; δ15N = 20.3‰ and N content = 21.2%) were used as standards for C and N analyses, respectively. The analytical precisions for repeat measurements of standards during sample analysis were better than 0.1‰ and 0.3‰ for C and N isotopic compositions, respectively, whereas it was better than 10% for C and N contents. DIC concentration and isotopic composition was measured using GasBench–IRMS (Mat 253; Thermo Fisher Scientific) with analytical precision better than 0.1‰ and 5% for δ13C and DIC, respectively. NO3−, NO2− and NH4+ was measured using a continuous flow autoanalyzer (Skalar) with analytical precision of ±0.01 mg L−1.
2.4 Statistical analysis
SigmaPlot 14.0 and RStudio (version 2021.09.2) were used to run various statistical tests on the data. Analysis of variance (ANOVA) was run to detect significant variation in the rates of primary productivity among different sample classes. Spearman rank correlation was used to check for significant relationship among measured parameters.
3 RESULTS
3.1 Environmental and biogeochemical parameters
Among the various reaches sampled, except for the riverfront (28.45 ± 1.82°C), water temperature was similar in the Narmada Canal, Sabarmati, and Mahi (24.27 ± 1.94°C). The river water was mostly alkaline with pH varying from 7.62 to 9.24 (8.45 ± 0.39). Compared to other reaches of the river, relatively low pH in the downstream reach of the Sabarmati and high pH in the riverfront was observed (Table 1). The riverfront was well oxygenated (DO: 9.39 ± 4.09 mg L−1) compared to the Narmada Canal, Mahi, and the upstream reaches of Sabarmati (DO: 5.94 ± 1.11 mg L−1). The downstream reach of Sabarmati had low DO (2.84 ± 2.83 mg L−1) and two locations just downstream of the Ahmedabad city (SD 1 and SD 2) had DO below the detection limit (Table 1). NO2− was low in all reaches (7.50 ± 4.90 µgN L−1), except the downstream reach of the Sabarmati (20.41 ± 18.83 µgN L−1) and the riverfront (42.74 ± 8.85 µgN L−1). NO3= was low in the upstream (18.76 ± 17.31 µgN L−1) and downstream (77.70 ± 52.67 µgN L−1) reaches of Sabarmati compared to the other reaches (346.15 ± 241.15 µgN L−1). NH4+ was manifold higher in the downstream reach of the Sabarmati (3975.90 ± 410.05 µgN L−1) compared to the riverfront (238.46 ± 98.19 µgN L−1) and other reaches (56.24 ± 38.34 µgN L−1) (Table 1). The DIC concentration was also the highest in the downstream reach of Sabarmati (7.38 ± 2.43 mM) with lowest δ13CDIC (−10.0 ± 1.0‰) compared to other reaches (DIC = 2.8 ± 1.1 mM; δ13CDIC = 7.2 ± 1.3‰) (Table 1). Biomass (POC and particulate nitrogen [PN]) was higher in the downstream reach (1622.35 ± 1246.66 and 202.72 ± 147.78 µM, respectively) and riverfront (420.70 ± 232.96 and 71.59 ± 45.01 µM, respectively), compared to the upstream reaches (62.41 ± 46.37 and 7.61 ± 6.31 µM, respectively) and the Narmada Canal (71.71 ± 37.29 and 10.32 ± 5.88 µM, respectively) (Table 1). δ13CPOC averaged around −27.5 ± 2.9‰ among all sampling locations with the riverfront and the Narmada Canal showing relatively lower values (−29.6 ± 2.1 and −30.4 ± 3.9‰). The δ15NPN was the lowest in the downstream reach of Sabarmati (1.2 ± 1.5‰) compared to the riverfront (5.6 ± 2.0‰), upstream reaches (5.6 ± 0.3‰), Narmada Canal (7.2 ± 3.5‰), and Mahi (8.8 ± 2.4‰) (Table 1).
| Site | pH | T (°C) | EC (μS/cm) | DO (mg L−1) | NO2− (µgN L−1) | NO3− (µgN L−1) | NH4+ (µgN L−1) | DIC (mM) | δ13CDIC (‰) | POC (µM) | δ13CPOC (‰) | PN (µM) | δ15NPN (‰) |
|---|---|---|---|---|---|---|---|---|---|---|---|---|---|
| SU 1 | 8.48 | 22.7 | 560 | 7.01 | 3.22 | 36.54 | 30.38 | 2.78 | −7.2 | 33.97 | −24.7 | 3.5 | 5.3 |
| SU 2 | 8.57 | 21.9 | 470 | 6.01 | 2.24 | 1.96 | 0.03 | 1.42 | −5.1 | 37.34 | −23.0 | 4.5 | 5.5 |
| SU 3 | 8.36 | 22.5 | 430 | 6.51 | 2.94 | 17.78 | 22.82 | 2.25 | −5.7 | 115.91 | −29.8 | 14.9 | 5.8 |
| RF 1 | 9.22 | 28.4 | 310 | 15.35 | 49.28 | 253.40 | 148.12 | 2.39 | −5.3 | 764.37 | −30.8 | 138.4 | 7.4 |
| RF 2 | 8.71 | 28.7 | 350 | 8.51 | 51.38 | 387.10 | 355.88 | 2.11 | −7.7 | 295.42 | −31.9 | 46.2 | 4.5 |
| RF 3 | 8.51 | 27.5 | 350 | 6.17 | 34.16 | 389.76 | 282.38 | 1.92 | −7.9 | 260.73 | −27.9 | 43.2 | 3.3 |
| RF 4 | 9.24 | 29.2 | 330 | 7.51 | 36.12 | 261.66 | 167.44 | 2.71 | −7.1 | 362.28 | −27.9 | 58.6 | 7.1 |
| SD 1 | 7.68 | 27.6 | 2550 | BDL | 11.76 | 8.12 | 4359.88 | 9.90 | −10.7 | 2475.78 | −25.5 | 230.2 | −0.1 |
| SD 2 | 7.70 | - | 2290 | BDL | 7.98 | 81.06 | 4270.00 | 9.01 | −10.8 | 2843.02 | −25.3 | 385.5 | 0.7 |
| SD 3 | 8.29 | 28.3 | 1510 | 4.84 | 48.44 | 136.08 | 3494.40 | 5.49 | −8.7 | 968.17 | −26.1 | 165.5 | 3.4 |
| SD 4 | 7.85 | 24.8 | 1550 | 0.83 | 13.44 | 85.54 | 3779.30 | 5.10 | −9.8 | 202.44 | −25.4 | 29.7 | 0.6 |
| ST 1 | 8.36 | 24.6 | 390 | 3.67 | 3.78 | 53.06 | 51.24 | 1.97 | −5.8 | 202.90 | −30.1 | 24.2 | 5.6 |
| ST 2 | 8.34 | 24.4 | 700 | 4.17 | 18.76 | 799.12 | 48.16 | 4.95 | −8.3 | 49.29 | −27.1 | 9.6 | 6.8 |
| ST 3 | 8.28 | 22.5 | 600 | 3.67 | 11.76 | 113.26 | 96.18 | 4.95 | −8.3 | 48.17 | −23.3 | 8.1 | 9.3 |
| NC 1 | 8.45 | 23.5 | 320 | 7.68 | 5.18 | 477.68 | 52.92 | 1.81 | −9.4 | 45.35 | −33.1 | 6.2 | 4.7 |
| NC 2 | 8.51 | 23.5 | 320 | 5.51 | 5.60 | 472.92 | 149.52 | 1.88 | −9.6 | 98.08 | −27.6 | 14.5 | 9.7 |
| M 1 | 8.50 | 23.2 | 380 | 5.67 | 3.92 | 129.78 | 18.34 | 1.97 | −5.8 | 55.20 | −28.7 | 6.1 | 12.0 |
| M 2 | 8.45 | 23.4 | 410 | 4.01 | 4.76 | 126.98 | 71.82 | 3.49 | −7.2 | 84.73 | −25.9 | 10.3 | 10.4 |
| M 3 | 8.49 | 23.3 | 490 | 6.84 | 5.04 | 85.12 | 74.34 | 2.58 | −7.9 | 122.52 | −23.2 | 9.9 | 8.0 |
| M 4 | 8.67 | 24.6 | 470 | 5.51 | 12.88 | 727.58 | 45.64 | 3.16 | −8.0 | 114.61 | −28.3 | 12.4 | 7.2 |
| M 5 | 8.76 | 27.5 | 470 | 4.67 | 12.74 | 568.68 | 69.72 | 4.47 | −6.9 | 125.71 | −31.2 | 14.4 | 6.3 |
- Abbreviations: BDL, below detection limit; DO, dissolved oxygen; DIC, dissolved inorganic carbon; EC, electrical conductivity; M, Mahi; NC, Narmada Canal; PN, particulate nitrogen; POC, particulate organic carbon; RF, Riverfront; SD, Sabarmati Downstream; ST, Sabarmati Tributaries; SU, Sabarmati Upstream.
3.2 Primary productivity rates
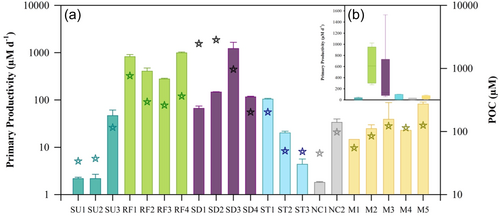
The rates of primary productivity varied across and among different reaches of the Sabarmati along with Mahi and the Narmada Canal. The highest uptake rate (p < 0.05; ANOVA) was observed in the riverfront (630.41 ± 112.72 µM C d−1) followed by the downstream reach of Sabarmati (390.71 ± 425.46 µM C d−1) (Figure 2). The upstream reaches of Sabarmati and its tributaries along with the Narmada Canal and the Mahi River showed relatively lower uptake rates of 17.29 ± 13.87, 43.50 ± 3.27, 18.09 ± 5.51, and 37.18 ± 49.39 µM C d−1, respectively (Figure 2).

4 DISCUSSION
4.1 Spatial variability in primary productivity
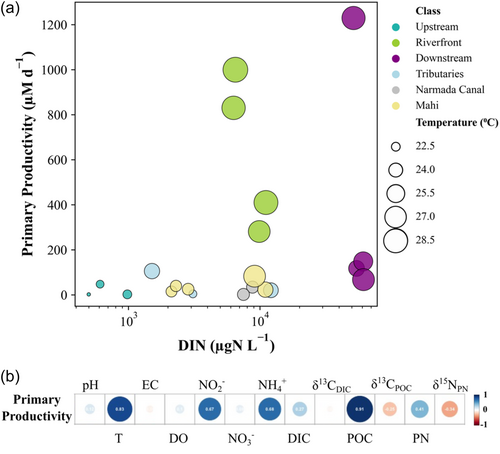
Primary productivity varies across biomes, climate regimes, and stream ecosystems (Lamberti & Steinman, 1997; Minshall, 1978) and higher rates of gross primary productivity is generally observed in middle-order streams (with less canopy and comparatively less light limitation) as compared to lower- (with dense canopy) and higher-order streams (with high turbidity and enhanced light attenuation) (Lamberti & Steinman, 1997). The river continuum concept (Vannote et al., 1980) justly incorporates this variation of primary productivity with stream order, which is further validated by studies elsewhere (Bott et al., 1985; Naiman et al., 1987). In this study, primary productivity varied along the continuum of Sabarmati and Mahi with lower rates in the upstream reaches of the Sabarmati as compared to its downstream reaches (Figure 2). These rates of primary productivity were similar to the rates (dark carbon fixation) estimated in streams using 14C labeled tracer (Machado-Silva et al., 2023). Considering an euphotic layer of 10 cm and recalculating our rates to compare with literature data, the primary productivity varied from 0.22 to 147.53 mg C m−2 d−1, which was comparable to the range of values of stream GPP (1–2500 mg C m−2 d−1) reported by studies elsewhere (Battin et al., 2008; Bernhardt et al., 2022; Gagne-Maynard et al., 2017; Neely & Wetzel, 1995; Odum, 1956; Wissmar et al., 1981). Streams that receive allochthonous inputs of organic matter has higher rates of respiration than could otherwise be sustained by in situ production (Fisher & Likens, 1973; Marcarelli et al., 2011). However, not all streams are connected to the catchment and receive little or no input of terrestrial organic matter, therefore increasing the dependency on primary productivity. In this study, higher primary productivity was observed in the riverfront compared to the Narmada Canal (Figure 2), indicating that water stagnancy is favorable to phytoplankton growth due to relatively low turbidity and higher water residence time (di Persia & Neiff, 1986; Dudgeon, 1995; Lévêque, 1995). Rivers downstream of dams and reservoirs are usually cut off from the catchment (dams holding back most of the allochthonous organic matter), and therefore show very high rates of GPP compared to respiration (i.e., net autotrophy) (Davis et al., 2012; Genzoli & Hall, 2016). A meta-analysis showed that GPP was higher in human altered small streams, which was not reflected in larger rivers (Finlay, 2011). In agreement with the above, the downstream reaches of the Sabarmati showed higher rates of primary productivity, which were comparable with the riverfront (Figure 2). High nutrient inputs through wastewater discharge supported high rates of primary productivity in the Sabarmati downstream as evident from the high DIN concentrations and a strong positive correlation between primary productivity and DIN (Table 1 and Figure 3a,b). Rates of primary production can go as high as 6000 mg C m−2 d−1 in polluted waters and are predominantly due to higher nutrient availability (Gücker et al., 2006; Rao, 1979). In the Mahi, increasing primary productivity from upstream to downstream reaches was observed and the rates were comparable to that of the tributaries of Sabarmati but lower than the highly productive riverfront and the polluted downstream reaches of Sabarmati (Figure 2).

4.2 Environmental controls on primary productivity
Water temperature and nutrient availability showed strong correlation with primary productivity (Figure 3a,b). Enhanced primary productivity at higher water temperature might be related to increased autotrophic respiration and simultaneously GPP or temperature could just be an indicator of insolation, which directly affects primary productivity (Lamberti & Steinman, 1997). Light availability (a function of shading, turbidity, and insolation) and canopy cover play a dominant role in regulating rates of stream GPP (Acuña et al., 2004; Beaulieu et al., 2013; Bernot et al., 2010; Hall et al., 2015; Hunt et al., 2012; Mulholland et al., 2001). Temperature is also known to control stream metabolism directly (enzyme kinetics) and indirectly (altering community structure); however, it is difficult to decouple its effects from the effect of light (Demars et al., 2011; Huryn et al., 2014; Rasmussen et al., 2011; Yvon-Durocher et al., 2012). In this study, the effect of water stagnancy on primary productivity was evident from the higher uptake rates in the riverfront (Figures 2 and 3a). Increased water residence time results in increased water temperature as observed in Nakdong River (Choi et al., 2020; Park et al., 2018), which ultimately increases primary production. Yu et al. (2019) observed enhanced primary productivity in the Yellow River during spring and summer due to less turbidity and suitable water temperature. Similar increase in in situ productivity was inferred during low flow conditions in the Ganges, Mekong, and Yellow River by Sarkar et al. (2023). Primary productivity in the river could be associated with dinitrogen fixation, which is reflected in the negative relationship between primary productivity and δ15NPN (Figure 3b) due to negligible isotopic fractionation during the process of N2 fixation (Fry, 2006). Increasing primary productivity also resulted in a decrease in δ13CPOC, which is typical of freshwater plankton (δ13CPOC = − 42‰ to −24‰; Kendall et al., 2001). Low flow conditions (clear and less turbid) are usually favorable for phytoplankton and algal growths, which under well-oxygenated and noneutrophic conditions can have highly depleted δ13CPOC (Leng & Melanie, 2006). Among inorganic nitrogen species, NH4+ is preferably assimilated during primary production due to lower energy costs and the positive correlation between NH4+ and primary productivity observed in this study indicates that nutrient availability controls the rates of primary production in rivers. Bernot et al. (2010) observed similar control of nutrients (NO3−) on GPP in streams.
5 CONCLUSION
The present study explores the variation in primary productivity at multiple locations along the continuum of two rivers, a highly engineered Sabarmati and relatively free flowing Mahi. High rates of primary productivity was observed in the riverfront and the downstream reaches of the Sabarmati. Water stagnancy, high water temperature, and nutrient availability were the primary factors responsible for higher rates of primary productivity in the riverfront and polluted downstream reaches of the Sabarmati. This study indicates that, in a future scenario of a warming world and with increased human perturbations of river channels, fragmented and urbanized rivers would likely become more productive, resulting in high organic matter production that might ultimately fuel processes like methanogenesis and carbon burial. Extensive studies accessing the shift in productivity of river channels in regions witnessing changes in hydrological regimes and in data sparse regions is highly warranted, especially using robust techniques such as the isotopically enriched tracer uptake incubation experiments.
ACKNOWLEDGMENTS
The funding for this study was provided by the Department of Space, Government of India.
ETHICS STATEMENT
None declared.
Open Research
DATA AVAILABILITY STATEMENT
Data are available on request from the authors.


