Numerical model in water quality: The case study of Da Nang City in central Vietnam
Abstract
The planning and treatment of wastewater discharged into rivers and seas is vital for tourism, domestic water supply, and other key sectors. This study used the MIKE 21 model to evaluate water quality trends and the assimilative capacity of the Vu Gia River estuary and the major reservoirs in Da Nang, considering future pollution loads and climate change scenarios (RCP8.5). Key parameters assessed include DO, BOD₅, COD, and Coliform. Results show a general decline in water quality (WQI) from 2019 to 2030 and again by 2070, with DO and BOD₅ contributing most to pollution. While COD and Coliform remained within acceptable limits (WQI > 75), the Phu Loc River had the lowest WQI (66.0–62.2). Other affected areas include the Han River (downstream and upstream) and the Cu De River. Reservoirs like Dong Nghe and Hoa Trung maintained better water quality (WQI > 80), though a downward trend was still observed.
1 INTRODUCTION
The sustainable management of water resources is vital for societal development and the sustenance of life, as water is essential for domestic, commercial, industrial, agricultural, and recreational activities (Nguyen et al., 2006). Many developed nations have a history of significant investments in water infrastructure, institutions, and the capacity to manage water resources effectively. In contrast, developing nations often face challenges such as inadequate water infrastructure, weak institutions, and poor water governance (Ngene et al., 2021).
As demand for limited water resources continues to rise, it is crucial to explore effective strategies for managing these resources to support ongoing national development. Therefore, assessing and forecasting water quality trends and the assimilative capacity of water bodies are essential components of water quality management. This approach aims to balance socioeconomic development goals with environmental protection (Tran Van 2016).
Various techniques are employed to evaluate water quality and its ability to assimilate pollutants. These include modeling approaches (e.g., QUAL2K (Savant et al., 2020), MIKE (Swaroop Bhargava 1983; Thang et al., 2013), DELFT3D (Trang et al., 2014), and HEC-RAS (Nhi et al., 2013)) and environmental monitoring strategies.
Additionally, assessments often involve the use of the Water Quality Index (WQI) (Cude, 2001; Ministry of Natural Resources and Environment, 2011) for composite evaluation and calculating the assimilative capacity of water bodies (Ministry of Natural Resources and Environment, 2009).
The choice of methods depends on the research goals and scale, and they can be applied either individually or in combination. Numerical modeling is particularly useful for evaluating water quality, as mathematical modeling is crucial for developing management strategies, testing functional hypotheses, and simulating future conditions of a system in response to environmental changes (Doan et al., 2015). A balance between model complexity and data availability must be achieved to optimize model performance (Grayson & Blöschl, 2000).
Da Nang is a first-tier city under central authority and is a major economic, cultural, and political hub of central Viet Nam. The rapid process of urbanization and industrialization has significantly contributed to the city's overall development. However, it has also brought numerous environmental challenges, particularly related to water pollution in Da Nang. Effective waste management and treatment, especially regarding discharges into rivers, the sea, estuarine areas of the Vu Gia River, and major reservoirs such as Dong Nghe and Hoa Trung, etc.) are extremely important for tourism, services, drinking water supply, and other city activities. Although these river basins enhance the city's landscape and are vital for Da Nang's tourism industry, they are also the primary recipients of wastewater from residential areas, commercial establishments, restaurants, and hotels. All these waste sources pose significant risks of water pollution, severely impact the entire ecosystem, and, more importantly, directly affect the city's various water uses (Cảnh & Lê Dân, 2021).
MIKE 21, developed by DHI, was selected for this study because of its robust capabilities in simulating two-dimensional hydrodynamics and water quality processes. The software enables accurate modeling of pollutant transport, including advection, dispersion, and degradation, under the influence of tides, currents, and other environmental factors. Its integrated modules and high flexibility make MIKE 21 an ideal tool for achieving the objectives of this water pollution study.
The objectives of this study are to (i) assess the assimilative capacity to receive wastewater and forecast future trends in water quality for the Vu Gia River estuary and major reservoirs in Da Nang; and (ii) evaluate pollution levels and water quality using indicators such as DO, BOD5, COD, and Coliform considering future pollutant loads from discharge sources as well as the effects of climate change and sea level rise. This approach will aid in better water management, contribute to the sustainability of aquatic ecosystems, and stabilize livelihoods, economic growth, and tourism development of Da Nang City, to ensure the city's sustainable water management.
2 RESEARCH METHODS
2.1 Study area
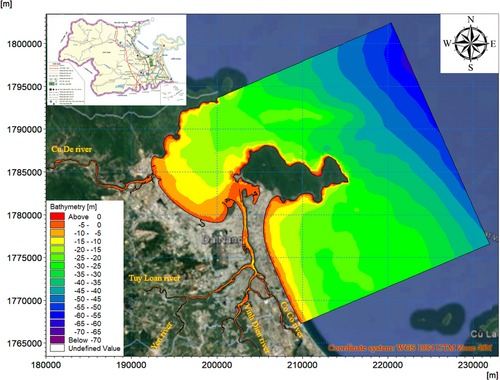
The study area includes the Cu De River basin and the Han–Vu Gia River basin (including the upstream sections of Tuy Loan, An Trach, and Yen rivers, as well as the Vinh Dien, Qua Giang, and the Co Co river branches). It also encompasses the coastal area within the coastal area of Da Nang City that is potentially affected by the hydrodynamic processes and pollutant dispersion (Figure 1).
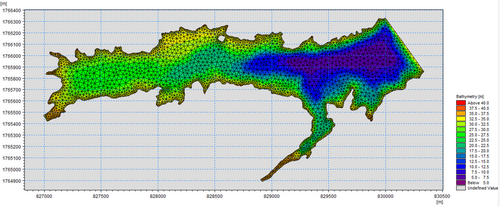
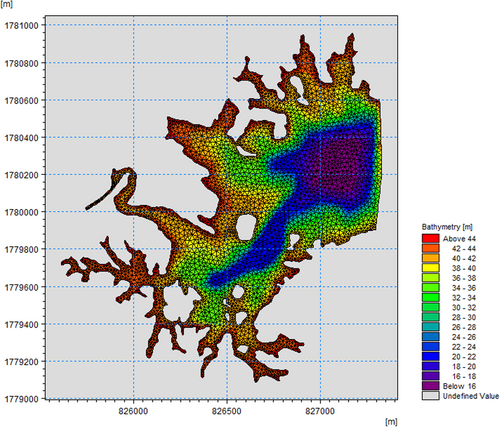
In addition, the study assesses the hydrodynamic conditions and water quality of several major reservoirs, including Dong Nghe and Hoa Trung Reservoirs, which play a crucial role in the regulation and distribution of water resources in Da Nang City. The computational grids for these reservoirs are also illustrated in Figures 2 and 3.
2.2 Measured data
Hydrological flow data were obtained from historical measurements at several hydrological stations in the region, including Ai Nghia, Cam Le, and Son Tra Stations (Da Nang Department of Natural Resources and Environment, 2019).
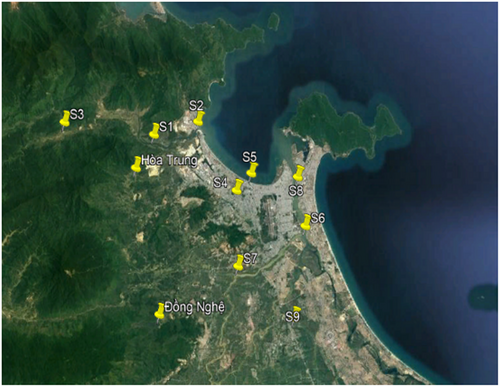
To assess water quality in the Da Nang area, relevant data were collected on flow, water sources, salinity, and the surface water quality at the boundaries of An Trach, Vinh Dien, Son Tra, Cam Le, Da Nang Bay, Son Tra Beach, and Ngu Hanh Son, as well as from wastewater treatment plant discharges within the study area (Department of Natural Resources and Environment, 2016). Figure 4 illustrates the locations where water quality samples were collected.
2.3 Assessment of WQI
Interpretation of WQI values:
0–25: Very Poor; unsuitable for any use;
26–50: Poor; requires significant treatment before use;
51–75: Fair, usable with monitoring and additional treatment;
76–90: Good; suitable for most uses;
91–100: Very Good; safe and for all uses.
2.4 MIKE 21 model
2.4.1 Model theory
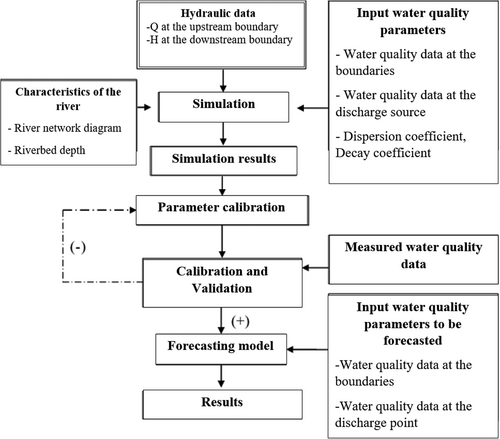
The MIKE 21 HD model is a tool package developed by the Danish Hydraulic Institute (DHI). Figure 5 shows the Water Quality Setup and Simulation in the MIKE 21 HD model. It calculates two-dimensional flow in a homogeneous fluid layer in the vertical direction (DHI Water & Environment, 2014).
t is time; x and y are Cartesian coordinates;
η is the surface elevation;
d is the depth of the still water;
h = η + d is the total water depth;
u, v are the velocity components in the x and y directions;
is the Coriolis parameter (Ω is the Earth's angular velocity, θ is the latitude);
are the stress components in the x and y directions at the surface and bottom;
g is the gravitational acceleration;
ρ is the water density;
are the components of the radiation stress tensor;
is the vertical eddy viscosity;
pa is the atmospheric pressure; is the standard density of water;
S is the flow intensity supplied to the source points.
are the velocity at which water is discharged into the surrounding environment.
represent the depth-averaged temperature and salinity);
represent the horizontal diffusion coefficients for temperature and salinity;
is the source term related to the heat exchange process with the atmosphere.
Fc is the horizontal diffusion term of the scalar quantity;
Kp is the linear decay rate of the scalar quantity;
Cs is the concentration of the scalar quantity at the source point.
2.4.2 Hydrodynamic module
Boundary conditions
The boundary conditions established in the model include: flow and water level boundaries.
Flow boundaries (Q ~ t): Based on simulated flow values at locations representing the main river systems in the study area, including Tuy Loan, An Trach, Vinh Dien, Qua Giang, Cu De, Phu Loc, as well as Dong Nghe and Hoa Trung reservoirs using the MIKE SHE hydrological model.
Water level boundaries (Z ~ t): Extracted from the hydrodynamic model of the entire East Sea (Nguyen & Tran 2012). (implemented by the Southern Institute of Water Resources Research) According to scenarios, including the northern, eastern and southern boundaries as shown in Figure 1.
Roughness coefficient
To select the appropriate hydraulic parameters for scenario simulations, the results for 2009 and 2019 are calibrated using measured data by adjusting the calibration parameters. Specifically, for the hydraulic model, this adjustment involves refining the roughness coefficient.
2.4.3 Advection–diffusion and water quality module
After stabilizing the hydrodynamic model parameters, the water quality scenario is established using the Ecolab Module in MIKE Zero.
Boundary conditions in the Ecolab model align with those of the hydrodynamic model, with the water quality indicators such as DO, BOD5, COD, and Coliform. These indicators are applied at both river and sea boundaries (North, East, and South). The boundary values are based on water quality sampling results from the river basins and the coastal area under study.
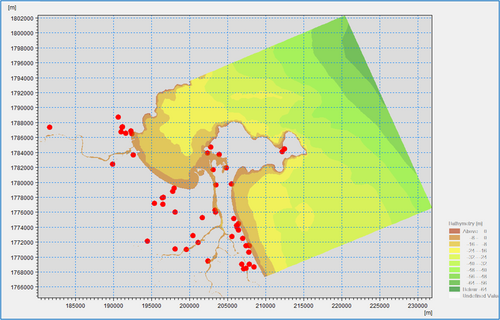
The discharge point locations of discharge points in Da Nang, including coordinates and discharge flow rates as of December 31, 2019, were provided by the Department of Natural Resources and Environment and are summarized in Figure 6.
2.5 Model scenarios
Following model calibration and validation, a stable set of parameters was established, and preliminary assessments of pollutant concentrations and their impacts on water quality in the study preliminary forecasts of water quality were conducted. Based on current conditions and projected climate change impacts, several scenarios were developed to simulate water quality. The developed scenarios assess pollution levels and evaluate the WQI using indicators such as DO, BOD5, COD, and Coliform. Additionally, they account for future pollutant loads and the potential effects of climate change and sea level rise.
For the model scenarios, this study extracted boundary conditions at various locations (Cu De River, Phu Loc River, Tuy Loan River, An Trach Dam, Qua Giang River, Vinh Dien River, Co Co River) corresponding to different current period; and under the RCP8.5 scenario for 2030 and 2070.
We adopted the RCP8.5 scenario developed and published by the Ministry of Natural Resources and Environment of Vietnam in the 2016 report “Climate Change and Sea Level Rise Scenarios for Vietnam.” This high-emission scenario, considered the most extreme pathway, closely aligns with current regional climate trends. Its selection ensures practical relevance and provides a solid foundation for effective planning and adaptation in the context of increasingly complex climate change dynamics.
2.5.1 Scenario 1: Water quality forecast for a 95% drought frequency
A forecast of water quality in river basins during drought conditions with a 95% frequency. Water level conditions, flow rates, and discharge sources are based on the state as of 2019.
2.5.2 Scenario 2: Water quality forecast for a 95% drought frequency - RCP8.5 climate change for 2030
A forecast of water quality under a 95% drought frequency, considering climate change impacts according to the RCP8.5 scenario for the year 2030.
2.5.3 Scenario 3: Water quality forecast for a 95% drought frequency - RCP8.5 climate change for 2070
A forecast of water quality under a 95% drought frequency, considering climate change impacts according to the RCP8.5 scenario for the year 2070.
3 RESULTS AND DISCUSSION
3.1 Model calibration and validation
3.1.1 Hydrodynamic model
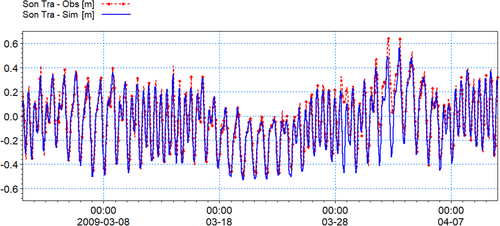
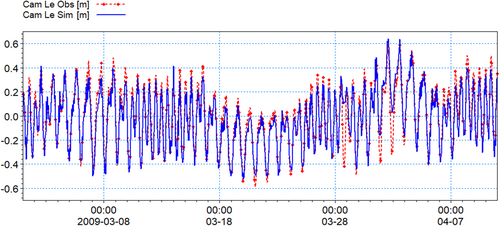
This section presents a comparison of the simulated and measured water levels at Son Tra and Cam Le stations for the model calibration in March 2009. The results demonstrate a high degree of agreement between the measured data and the simulation results (Figures 7 and 8).
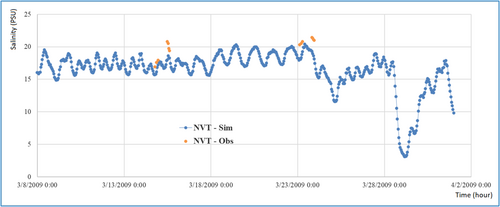
To assess and forecast water quality, it is essential to simulate and evaluate the salinity intrusion process in the river basin, in addition to considering water level conditions. The study simulated the salinity intrusion process in the computational domain using observational data collected in March 2009 at Nguyen Van Troi Bridge, as shown in Figure 9.
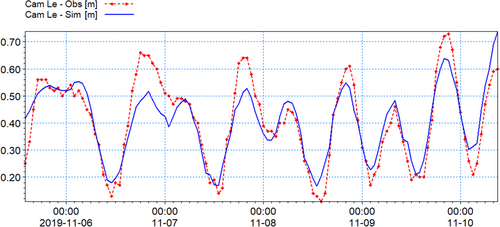
Comparison of simulated and measured water levels at Cam Le Station during model validation (November 5–10, 2019) shows strong agreement between measured and computed data in terms of both in amplitude and in tidal phase (Figure 10).
The calibration and validation results for water levels at Son Tra and Cam Le stations for the years 2009 and 2019 demonstrate strong agreement between simulations and measurements, with high Nash and correlation coefficients (R), indicating the model's reliability. Although there are some minor discrepancies in flow values, the model generally matches the measured data regarding tidal phase and amplitude (Table 1). Therefore, the calibration and validation results are considered acceptable based on the current measurement data.
| Location | Coefficient | ||
|---|---|---|---|
| Nash | Correlation | Evaluation & ranking | |
| Son Tra in March 2009 | 0.97 | 0.99 | Very Good |
| Cam Le in March 2009 | 0.87 | 0.94 | Very Good |
| Cam Le in November 2019 | 0.82 | 0.91 | Good |
It is concluded that the parameter set applied to the hydrodynamic model is suitable for simulating future scenarios driven by socioeconomic development and sea level rise.
3.1.2 Water quality model
To properly calibrate and validate the MIKE 21 water quality model, data must be extracted from specific measurement locations, compared to observed measurements, and used to produce a WQI assessment map, in accordance with Decision No. 1460/QD-TCMT (Decision 1460/QD-TCMT 2019), outlining technical guidelines, which outlines technical guidelines for calculating and publishing the Vietnamese WQI (VN_WQI).
To calibrate and validate the MIKE 21 water quality model, data must be extracted from specific locations, compared with observed measurements, and used to generate a WQI assessment map, which outlines technical guidelines for calculating and publishing the Vietnamese Water Quality Index (VN_WQI).
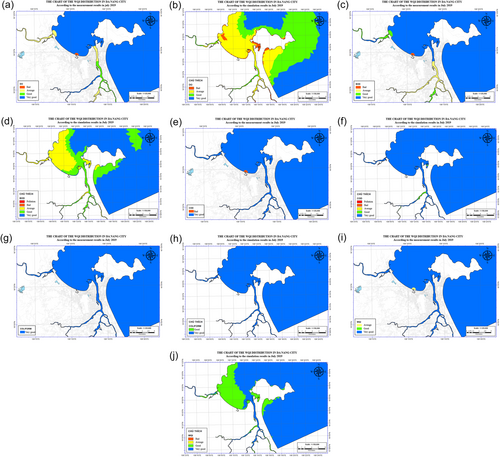
The calibration and validation of the MIKE Ecolab 2D water quality model were conducted for two periods: July and November 2019. The WQI results are compiled into map sets as shown in Figure 11 and Table 2.
| Temperature | pH | DO | COD | BOD5 | Coliform | |||||
|---|---|---|---|---|---|---|---|---|---|---|
| Obs | Obs | Obs | Sim | Obs | Sim | Obs | Sim | Obs | Sim | |
| Point | (°C) | (pH) | (mg/L) | (mg/L) | (mg/L) | (mg/L) | (mg/L) | (mg/L) | (M/100 mg/L) | (M/100 mg/L) |
| S1 | 25.7 | 7.4 | 5.2 | 4.5 | 6.0 | 12.0 | 4.0 | 9.1 | 3.0 | 2268.3 |
| S2 | 25.3 | 7.8 | 5.3 | 4.4 | 8.0 | 8.9 | 5.0 | 5.7 | 3.0 | 1727.0 |
| S3 | 24.6 | 6.8 | 5.5 | - | 9.0 | - | 5.0 | - | 3.0 | - |
| S4 | 26.6 | 7.6 | 2.1 | - | 36.0 | - | 20.0 | - | 1200.0 | - |
| S5 | 25.9 | 7.8 | 3.0 | 1.5 | 32.0 | 75.0 | 17.0 | 29.3 | 460.0 | 2795.6 |
| S6 | 31.5 | 7.4 | 4.7 | 5.6 | 7.0 | 15.8 | 4.0 | 9.0 | 150.0 | 2627.5 |
| S7 | 31.0 | 7.2 | 6.6 | 7.0 | 10.0 | 15.0 | 6.0 | 8.0 | 930.0 | 2474.3 |
| S8 | 32.4 | 7.9 | 5.5 | 5.3 | 12.0 | 15.4 | 7.0 | 8.9 | 150.0 | 2614.7 |
| S9 | 30.9 | 7.2 | 4.9 | - | 9.0 | - | 5.0 | - | 120.0 | - |
Below is a comparison of the measured and simulated results for the validation period in November 2019 (Figure 12 and Table 3).

| Point | Temperature | pH | DO | COD | BOD5 | Coliform | ||||
|---|---|---|---|---|---|---|---|---|---|---|
| Obs | Obs | Obs | Sim | Obs | Sim | Obs | Sim | Obs | Sim | |
| (°C) | (pH) | (mg/L) | (mg/L) | (mg/L) | (mg/L) | (mg/L) | (mg/L) | (M/100 mg/L) | (M/100 mg/L) | |
| S1 | 25.3 | 7.4 | 5.3 | 5.2 | 7.0 | 12.0 | 4.0 | 9.3 | 750.0 | 2366.0 |
| S2 | 25.1 | 7.8 | 5.4 | 5.3 | 12.0 | 11.1 | 7.0 | 7.1 | 1500.0 | 2330.2 |
| S3 | 24.5 | 7.0 | 5.5 | - | 14.0 | - | 8.0 | - | 430.0 | - |
| S4 | 26.0 | 7.2 | 2.6 | - | 31.0 | - | 17.0 | - | 2300.0 | - |
| S5 | 26.2 | 7.8 | 3.6 | 1.5 | 36.0 | 75.0 | 19.0 | 29.3 | 2300.0 | 2808.0 |
| S6 | 26.3 | 6.8 | 6.3 | 6.8 | 9.0 | 14.9 | 6.0 | 8.2 | 4600.0 | 2519.6 |
| S7 | 26.1 | 6.6 | 6.5 | 7.4 | 8.0 | 15.0 | 5.0 | 8.0 | 460.0 | 2490.7 |
| S8 | 25.2 | 7.1 | 6.1 | 6.4 | 12.0 | 15.1 | 7.0 | 9.0 | 23,000.0 | 2777.8 |
| S9 | 26.4 | 6.5 | 6.8 | - | 8.0 | - | 5.0 | - | 23,000.0 | - |
During the calibration period (July 2019) and the validation period (November 2019), both the 2D hydrodynamic model and the water quality model yielded reasonably accurate results for the water quality indicators, as well as for water levels and flow conditions within the river basin system.
The model parameters, after calibration and validation, show satisfactory agreement with the observed values of DO, BOD5, COD, and Coliform bacteria. Although certain discrepancies remain, the overall results are consistent with the measured data. Therefore, the calibration and validation results can be considered acceptable based on the available measurement data.
3.2 Model scenarios
Scenario 1: (Table 4)
| Point | DO | COD | BOD5 | Coliform | Unweighted WQI | |||||
|---|---|---|---|---|---|---|---|---|---|---|
| (mg/L) | WQI | (mg/L) | WQI | (mg/L) | WQI | (M/100 mg/L) | WQI | |||
| Cu De River (Headwaters 6000 m from the river mouth) | 5.1 | 68.6 | 68.6 | 9.0 | 100.0 | 6.4 | 73.9 | 1.0 | 100.0 | 89.9 |
| Cu De River | 5.5 | 74.0 | 74.0 | 12.0 | 90.0 | 6.3 | 74.2 | 1.0 | 100.0 | 89.1 |
| Phu Loc River (Estuary) | 3.4 | 45.7 | 46.4 | 32.8 | 46.5 | 19.9 | 37.8 | 582.7 | 100.0 | 66.0 |
| Upstream of the Han River | 6.0 | 80.7 | 85.9 | 9.3 | 100.0 | 5.9 | 76.3 | 231.3 | 100.0 | 93.5 |
| Upstream of the Cam Le River | 6.3 | 84.7 | 93.7 | 9.5 | 100.0 | 6.0 | 75.0 | 997.4 | 100.0 | 94.6 |
| Downstream of Han River | 5.4 | 72.6 | 72.6 | 12.8 | 86.0 | 5.7 | 78.8 | 185.5 | 100.0 | 88.9 |
| Hoa Trung Lake | 5.5 | 74.0 | 74.0 | 9.0 | 100.0 | 14.1 | 52.5 | 1080.0 | 100.0 | 86.9 |
| Dong Nghe Lake | 5.2 | 69.9 | 69.9 | 9.7 | 100.0 | 17.0 | 45.0 | 382.0 | 100.0 | 84.6 |
Scenario 2: (Table 5)
| Point | DO | COD | BOD5 | Coliform | Unweighted WQI | |||||
|---|---|---|---|---|---|---|---|---|---|---|
| (mg/L) | WQI | (mg/L) | WQI | (mg/L) | WQI | (M/100 mg/L) | WQI | |||
| Cu De River (Headwaters 6000 m from the river mouth) | 5.0 | 67.2 | 67.2 | 11.0 | 95.0 | 6.5 | 73.6 | 1.0 | 100.0 | 88.7 |
| Cu De River | 5.3 | 71.3 | 71.3 | 12.3 | 88.5 | 6.4 | 73.9 | 1.0 | 100.0 | 88.3 |
| Phu Loc River (Estuary) | 3.1 | 41.7 | 43.1 | 36.8 | 41.5 | 20.0 | 37.5 | 582.7 | 100.0 | 63.8 |
| Upstream of the Han River | 5.6 | 75.3 | 75.6 | 11.9 | 90.5 | 6.0 | 75.0 | 282.0 | 100.0 | 89.6 |
| Upstream of the Cam Le River | 6.1 | 82.0 | 88.5 | 12.0 | 90.0 | 6.0 | 75.0 | 998.0 | 100.0 | 91.9 |
| Downstream of Han River | 5.0 | 67.2 | 67.2 | 13.9 | 80.5 | 5.8 | 77.5 | 203.3 | 100.0 | 86.6 |
| Hoa Trung Lake | 5.4 | 72.6 | 72.6 | 9.0 | 100.0 | 13.9 | 53.1 | 1085.0 | 100.0 | 86.7 |
| Dong Nghe Lake | 5.0 | 67.2 | 67.2 | 9.4 | 100.0 | 15.3 | 49.3 | 362.0 | 100.0 | 84.9 |
Scenario 3: (Table 6)
| Point | DO | COD | BOD5 | Coliform | Unweighted WQI | |||||
|---|---|---|---|---|---|---|---|---|---|---|
| (mg/L) | WQI | (mg/L) | WQI | (mg/L) | WQI | (M/100 mg/L) | WQI | |||
| Cu De River (Headwaters 6000 m from the river mouth) | 4.6 | 61.8 | 61.8 | 11.9 | 90.5 | 6.4 | 73.9 | 1.0 | 100.0 | 86.8 |
| Cu De River | 5.1 | 68.6 | 68.6 | 12.5 | 87.5 | 6.2 | 74.4 | 1.0 | 100.0 | 87.7 |
| Phu Loc River (Estuary) | 3.0 | 40.3 | 41.9 | 36.8 | 41.5 | 21.9 | 32.8 | 582.7 | 100.0 | 62.2 |
| Upstream of the Han River | 5.5 | 74.0 | 74.0 | 11.8 | 91.0 | 6.1 | 74.7 | 270.7 | 100.0 | 89.4 |
| Upstream of the Cam Le River | 5.4 | 72.6 | 72.6 | 12.0 | 90.0 | 6.0 | 75.0 | 297.9 | 100.0 | 89.0 |
| Downstream of Han River | 4.7 | 63.2 | 63.2 | 14.3 | 78.5 | 5.7 | 78.8 | 298.2 | 100.0 | 85.7 |
| Hoa Trung Lake | 5.1 | 68.6 | 68.6 | 9.2 | 100.0 | 14.0 | 52.8 | 1090.0 | 100.0 | 85.9 |
| Dong Nghe Lake | 4.1 | 55.1 | 55.1 | 9.5 | 100.0 | 15.4 | 49.0 | 363.0 | 100.0 | 82.5 |
The Tables above present the results for DO, COD, BOD₅, Coliform, and WQI at selected locations (Cu De River, Phu Loc River, Han River, Cam Le River, Hoa Trung, and Dong Nghe Reservoirs). The WQI shows a decreasing trend across the scenarios, from the 2009 baseline to projections for 2030 and 2070.
At the mouth of the Phu Loc River, the WQI values are the lowest among scenarios 1, 2, and 3, with scores of 66, 63.8, and 62.2, respectively. In contrast, at the Cam Le River, the highest WQI values were recorded, with scores of 94.6, 91.9, and 89 corresponding to scenarios 1, 2, and 3, respectively.
This suggests that the water quality at the mouth of the Phu Loc River is deteriorating more rapidly than in other areas of Da Nang City. This finding is consistent with the results of the study evaluating the current status of water quality in the Phu Loc River, Da Nang City, and proposing solutions for improvement (Le, 2021; Nguyen et al., 2020).
4 CONCLUSION
The WQI at various locations shows a downward trend across the scenarios, from the 2009 baseline to the projections for 2030 and 2070, considering the RCP8.5 climate change scenario. Specifically, a more significant decline in WQI is expected at the Phu Loc River mouth and the lower reaches of the Han River by 2030.
The WQI at the Phu Loc River mouth is predicted to be the lowest (WQI of 66.0/63.8/62.2 for the two scenarios), in comparison to other locations, where the WQI remains above 80. This suggests that water quality at the Phu Loc River mouth is deteriorating more faster than in other areas of Da Nang City. Following this, the lower reaches of the Han River, the mouth of the Cu De River, the upper reaches of the Han River, and the upper reaches of the Cam Le River show a progressively smaller decline in water quality.
Among the water quality indicators, DO and BOD5 levels are particularly indicative of pollution risks. Areas at high risk of reduced biological activity and increased mortality, due to low DO and elevated BOD5 concentrations, include the Phu Loc River mouth and the Han River mouth. Organic, domestic, and chemical wastewater are primary contributors to the reduced DO levels and the elevated BOD5 in these water bodies.
For the Dong Nghe and Hoa Trung Reservoirs, two major water bodies in Da Nang City, the WQI assessment indicates generally good water quality (WQI > 80). However, in certain scenarios, water quality is expected to decline, with DO and BOD5 levels remaining low at various times, particularly for BOD5. Therefore, it is essential to evaluate and implement measures to improve the water environment, ensure a safe aquatic habitat, and preserve the urban esthetic of the area.
ETHICS STATEMENT
None declared.
Open Research
DATA AVAILABILITY STATEMENT
Data is available upon request from the authors.


