Flash flood disaster risk evaluation based on geographic detector and interval number ranking method
Abstract
Among natural disasters, flash floods are the most destructive events, causing significant damage to the economy and posing a serious threat to human life and property. Comprehensive risk assessment of these sudden floods is a key strategy to mitigate their impact. Accurate analysis of flash flood hazards can greatly enhance prevention efforts and inform critical decision-making processes, ultimately improving our ability to protect communities from these fast-onset disasters. This study analyzed the driving forces of flash flood disaster-causing factors in Heilongjiang Province. Meanwhile, nine different categories of variables affecting the occurrence of flash floods were selected, and the degree of influence of each driving factor on flash floods was quantitatively analyzed, and the driving force analysis of the driving factors of flash floods in Heilongjiang Province was carried out by using the geographic probe model. This paper employs an uncertainty approach, utilizing a statistical-based interval weight determination technique for evaluation indices and a two-dimensional information-based interval number sorting method. These methodologies are combined to construct a comprehensive flash flood risk assessment model. On this basis, the model was implemented in six regions within China's Heilongjiang province to evaluate and prioritize flash flood risks. The resulting risk ranking for these areas was as follows: Bayan Shuangcheng Boli Suibin Hailun Yian. The findings demonstrate that the interval number-based evaluation method effectively handles uncertainty, providing a more reliable risk grading system. This approach, by leveraging modern scientific advances and risk quantification techniques, is crucial for improving disaster management and mitigating flash flood impacts.
1 INTRODUCTION
Flash floods represent a highly destructive form of natural calamity, precipitated by sudden, intense downpours. The resultant flash flood hazards manifest in various forms, including inundations, landslides, and debris flows, primarily triggered by heavy rainstorms (Angillieri, 2012; Asad et al., 2024; Yin et al., 2016). These events are further exacerbated by the local geological and topographical features, making them not only swift but also severely damaging, thereby posing significant risks to human life and property (El Bastawesy et al., 2019; Segura-Beltrán et al., 2016). Previous studies suggest that the economic cost of flash floods can amount to approximately 3.9% of total GDP, and agricultural production, including crops like corn, rice, and soybeans, could decrease by 2.8% due to flooding (Fu et al., 2018; Qi et al., 2021).
The occurrence and distribution of flash floods are influenced by a myriad of factors, including meteorological conditions, terrain, vegetative cover, and anthropogenic activities. To unravel the intricate web of factors contributing to flash flood hazards, a quantitative analysis is imperative (Chowdhury, 2024; Hoang & Liou, 2024). Given the multifaceted nature of these contributing factors, an effective risk assessment must account for both the individual and interactive effects of these drivers. Traditional methods of flash flood risk evaluation, such as entropy weight-based models and the Analytic Hierarchy Process, are often limited by their reliance on subjective judgment and the complexity of managing large sets of evaluation indicators (Islam & Chowdhury, 2024; Zhang et al., 2024). These methods also face challenges in integrating both qualitative and quantitative data, leading to potential biases and uncertainties in the assessment outcomes (Bahari et al., 2023; Kamruzzaman & Chowdhury, 2023).
This study focuses on Heilongjiang Province, a region in China particularly vulnerable to flash flood disasters, and emphasizes the critical role of nonengineering measures in disaster mitigation. The study introduces a novel risk assessment framework by combining the Geographical Detector Model (GDM) with Interval Number Ranking Methods. Unlike conventional approaches, this model effectively addresses factor interactions and the uncertainty in factor weights, offering a more precise evaluation of flash flood risk. The study identifies key drivers—such as precipitation, elevation, and soil type—and their varying impacts on flash flood risk distribution. For the first time, this study systematically ranks the flash flood risks across six high-risk regions in Heilongjiang Province and provides targeted flood prevention recommendations aimed at mitigating the severe economic and human tolls of these disasters.
2 DEVELOPMENT OF METHODOLOGY
2.1 Technology framework
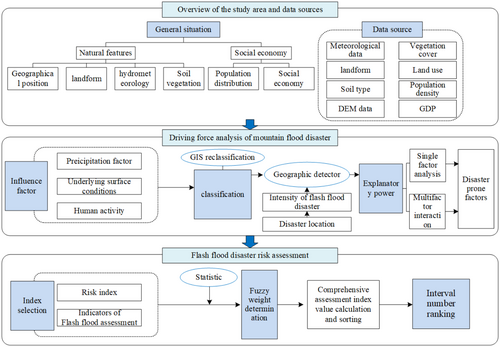
The overall research framework of the flash flood risk assessment study in Heilongjiang Province is shown in Figure 1. It mainly includes three parts: data collection and overview, driving force analysis, and risk assessment. This integrated approach allows us to systematically analyze the complex interplay of factors contributing to flash flood risk and provide a nuanced assessment of vulnerability across the study area.
2.2 Driving force analysis of flash flood disaster based on geographic detector
Geographical Detectors constitute a statistical technique designed to uncover the heterogeneity within spatial strata and to identify the factors that influence the occurrence of various phenomena (Yang et al., 2024). Spatial stratified heterogeneity serves to highlight geographical disparities (Gao et al., 2023; He et al., 2023). At the heart of the geographical detector approach is the principle that a significant correlation exists between a given driving factor (independent variable) and the manifestation of a particular event (dependent variable) if their spatial distributions are aligned. In such cases, the presence of the driving factor provides a measure of explanation for the event's occurrence and variations (Li et al., 2024; Zhang et al., 2023; Zhao et al., 2024).
The geodetector framework comprises four distinct detectors, each tailored to fulfill a specific function.
(1) Factor detector
(2) Interactive detector enhancement
To assess the interplay among diverse driving factors, the GDM is an invaluable tool. This model facilitates the spatial overlay of two distinct driving forces, allowing for the calculation of their combined explanatory strength. This metric is pivotal, as it quantifies the degree to which the interaction of these factors elucidates a specific phenomenon. Consider X1 and X2 as two separate driving factors; the GDM executes a spatial superposition of these elements to derive the intersection factor X1 ∩ X2. Subsequently, the model computes the individual and interactive explanatory powers of X1, X2, and X1 ∩ X2, offering a nuanced understanding of their collective influence.
(3) Risk detector
(4) Ecological detector
2.3 Flash flood risk evaluation model based on interval numbers
Evaluation indices in decision-making can be weighted through three primary methods: objective, subjective, and combined weighting (Li et al., 2023; Pamucar et al., 2024). The objective weighting method allocates weights based on the variance in attribute values among indices, primarily to highlight differences across options. However, this method may diverge significantly from actual conditions due to its reliance on attribute differentiation. In contrast, the subjective weighting method depends heavily on the discretionary judgment of scholars, introducing a high degree of subjective bias. The combined weighting approach amalgamates the merits of both methods, mitigating issues related to individual bias and enhancing the appropriateness of weight allocation.
In the realm of interval number multi-attribute decision-making, ranking interval numbers is paramount, with extensive research conducted by experts. Common ranking methodologies include dominance and deterministic sorting. Deterministic sorting simplifies the process by calculating distances between interval numbers on the numerical line to establish rank order. Although straightforward and clear, this method may discard valuable interval data, potentially compromising decision accuracy. The dominance-based method, on the other hand, comprehensively utilizes interval data to determine rank order among numbers, yielding more effective outcomes despite its computational intensity (Jiang & Hu, 2022; Liu et al., 2019).
To fully harness interval data, one can employ the Gaussian plane rectangular coordinate system, which facilitates the extraction of two-dimensional information and characterizes interval relationships on the numerical axis. This approach effectively simplifies the ranking process, particularly for intervals with complex relational attributes, thereby circumventing the intricate calculations typically involved in interval number sorting (Wu and Shang, 2023).
2.3.1 Establishment of decision model
Set as a set composed of regions, an evaluation index set composed of evaluation indexes, is the interval weight set of evaluation indexes, and represents the interval number weight value of evaluation index The evaluation index value of regional under the evaluation index represents . constitutes the decision matrix of the scheme set.
2.3.2 Statistical-based interval weight determination of evaluation index method
To reasonably determine the flash flood risk evaluation index and its weight value, 100 academic papers on flash flood risk evaluation were statistically analyzed. These academic papers were selected from the latest publications and those with the highest citations, ensuring a broad and reliable basis for determining the weight values. The weight values of the selected evaluation indicators were then calculated as part of the flash flood risk evaluation indicators set. The Statistical-based Interval Weight Determination Method offers a more objective and evidence-based approach to assigning weights to these indicators. By leveraging academic research data, this method minimizes bias and ensures that the most relevant and widely accepted indicators are prioritized. Compared to traditional methods, it provides a more robust, data-driven framework for flash flood risk assessment, which is especially valuable in handling uncertainty and ensuring the accuracy of risk evaluations.
2.3.3 Standardization of evaluation indicators
2.3.4 Calculation and ranking of comprehensive evaluation index values
Let be a set of intervals, is the number of intervals, if , then is the number of target intervals; if , . Then the number of target intervals is . The number of intervals , is the central axis of the interval number , and the length of the interval number is .
Within the realm of decision analysis, interval properties typically employ non-negative real values for their upper and lower limits. Consequently, research focuses primarily on intervals in the positive domain. The method of characterizing the interval number in the Gaussian plane Cartesian coordinate system can be used to illustrate this concept (Liu et al., 2019). When the interval number is in the Gaussian plane rectangular coordinate system, the corresponding point falls on the straight line , and the interval number is equal to the axis of the target interval number , that is , so is called the interval isometric function. Similarly, is the interval isometric function.
The interval number dominance function provides a framework for comparing two intervals. Generally, a higher value on the central axis indicates a greater average within the interval, suggesting an overall larger magnitude. When two intervals share the same central axis value, we consider their spread. A narrower range implies more concentrated data, which is deemed superior in this context. In essence, the comparison process involves two steps: first, evaluating the relative positions of the intervals' midpoints, and then, for intervals with identical midpoints, assessing their respective widths. The process for ranking interval numbers consists of the following steps:
(1) Perform a preliminary comparison on a group of interval numbers and select the target interval number .
(2) Determine the relationship between any other interval number and the and the number of target intervals , if , the dominance of the number of intervals relative to the number of target intervals ; if , calculating the central axis dominance of the number of intervals relative to the number of target intervals , and sort the interval number according to the order of the values. If there are two or more interval numbers, calculate the length dominance of the interval number relative to the target interval number, and supplement the previous order according to the order of the values.
(3) If there are multiple interval numbers, , repeat steps (1) and (2) for the plurality of interval numbers, and supplement the previous order until the sorting is completed.
3 APPLICATION
3.1 Study area
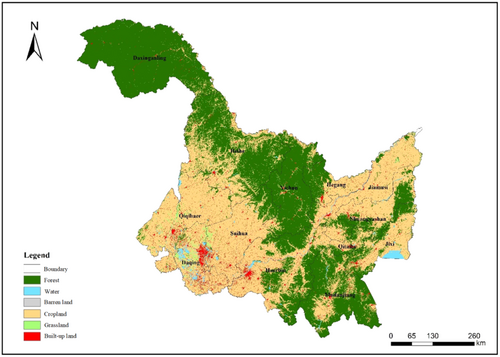
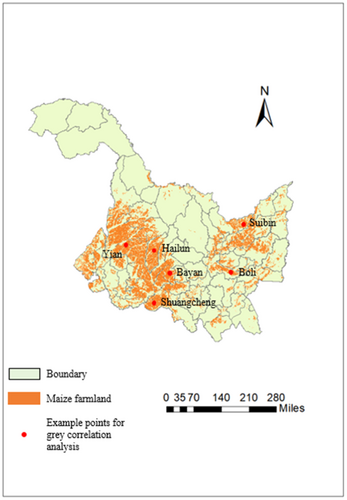
Heilongjiang Province, located in Northeast China, is an important agricultural center and an important grain-producing area of the country (Figure 2). The climate of the province is diverse, covering humid, semi-arid, warm temperate, and cold temperate zones. Heilongjiang Province has an area of 15.94 million hectares of agricultural land, accounting for about 33.87% of the total area of the province. Crop planting usually takes place between April and September. The average annual rainfall is 400–700 mm, of which around 60% is concentrated in the summer (June–August). This pattern of precipitation has created a very challenging agricultural environment, characterized by drought in the spring and a high risk of flooding in the summer. These climatic conditions have greatly influenced agricultural practices and crop selection in the region.
3.2 Data collection
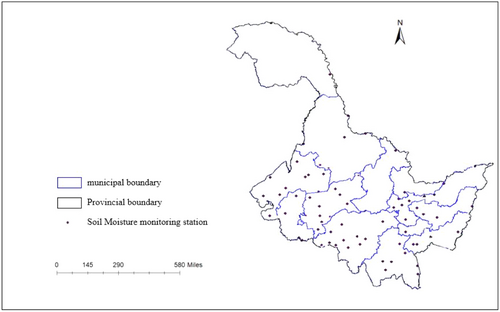
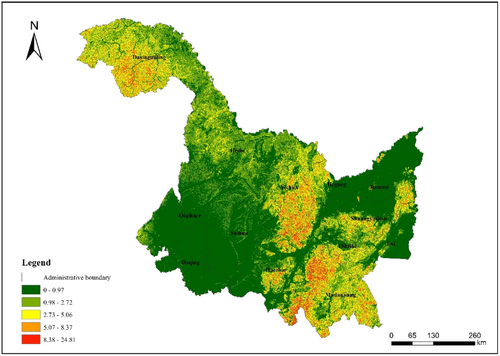
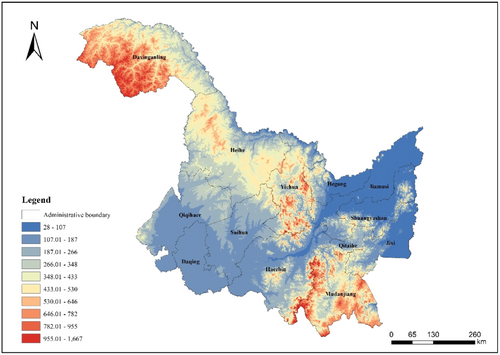
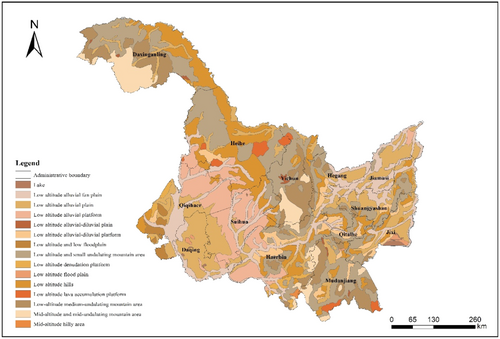
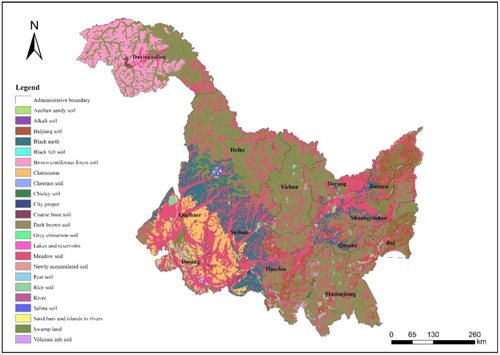
The collection of meteorological data for Heilongjiang Province (Table 1), encompassing the period from 1990 to 2015, focused primarily on daily Precipitation measurements from 72 weather stations. These datasets were acquired from the China Meteorological Data Network. Complementary to this, the Heilongjiang Academy of Water Sciences supplied slope, soil type, and vegetation cover datasets, the latter indicated by the Normalized Difference Vegetation Index (NDVI). Topographical data were represented by a 30-meter resolution Digital Elevation Model (DEM) image, which was sourced from the Geospatial Data Cloud. Land use patterns for the year 2015 were detailed in datasets obtained from the National Basic Geographic Information Center of Heilongjiang Province, highlighting the distribution of various land use types. Population and socioeconomic datasets were extracted from the Heilongjiang Province statistical yearbook, with population density figures specifically delineated using Geographic Information System (GIS) tools. The collected data is shown in Figures 3-7.
| Content | Time | Source |
|---|---|---|
| Daily precipitation | 1990–2015 | China Meteorological Data Network (https://weather.cma.cn/) |
| Slope | 2015 | Geospatial Data Cloud (https://www.gscloud.cn/) |
| Soil type | 2015 | Heilongjiang Province Hydraulic Research Institute (https://hljsky.org.cn/) |
| Normalized Difference Vegetation Index (NDVI) | 2015 | Heilongjiang Province Hydraulic Research Institute (https://hljsky.org.cn/) |
| Digital Elevation Model (DEM) | 2015 | Geospatial Data Cloud (https://www.gscloud.cn/) |
| Land use | 2015 | National Basic Geographic Information Center of Heilongjiang Province (https://www.webmap.cn/) |
4 RESULTS
4.1 The selection and treatment of driving factors
An integrated qualitative and quantitative evaluation has been conducted to unravel the spatio-temporal dynamics of mountainous flood disasters in Heilongjiang Province under a variety of scenarios. Key drivers such as precipitation patterns, terrain conditions, and anthropogenic influences were scrutinized. Utilizing ArcGIS tools for data extraction and spatial identification, we meticulously quantified the impact of these drivers, assigning specific values to discrete geographic units. The explanatory strength of each driver was rigorously assessed using geographic detector analysis.
Drawing from the foundational principles of the geographic detector model, we systematically discerned and evaluated the predominant factors influencing mountainous flood hazards in Heilongjiang. The continuous nature of these factors was transformed into discrete categories for more precise analysis. Through a rigorous classification process, informed by industry benchmarks and reclassification techniques, we stratified continuous data on Precipitation, land surface conditions, and human activities.
Recognizing that intense precipitation and the brevity of Precipitation events are pivotal in triggering flash floods, we defined four distinct precipitation intensity indicators: P10, P25, P50, and P100. These categories were derived in accordance with the national standard for Precipitation intensity classification (GB/T 28592-2012), to facilitate a nuanced exploration of how varying Precipitation intensities impact the frequency and geographical spread of flood events in the region (Table 2).
| Precipitation level | Daily precipitation |
|---|---|
| P10 | >10 mm |
| P25 | >25 mm |
| P50 | >50 mm |
| P100 | >100 mm |
Utilizing precipitation data from 1949 to 2015 from 72 meteorological stations across Heilongjiang Province, alongside latitude and longitude coordinates, we plotted these stations on the province's administrative map to illustrate the distribution of Precipitation. We employed the inverse distance weighting interpolation method within ArcGIS for accurate spatial interpolation, enabling the visualization of daily Precipitation distribution across various cities at different intensities.
Elevation data, which influences hydrological processes, was classified into 10 distinct categories using ArcGIS's natural break classification method, reflecting the varying terrain relief across the province. Similarly, the province's topographic slope was analyzed using ArcGIS's surface analysis tools and classified according to the national standard GB/T15772-2008 into five distinct categories, offering insights into the surface steepness and its potential impact on water flow.
The province's 15 geomorphic units were delineated based on their characteristic features, highlighting the diversity of landforms that contribute to the occurrence of flash floods. The spatial variability of soil types further accentuates the disparate risks of flash flood disasters across the province.
The vegetation index (NDVI) was utilized to gauge the extent of vegetation cover, which plays a crucial role in water interception and, by extension, the dynamics of flash floods. Land use patterns, particularly the prevalence of cultivated lands and artificial surfaces, were analyzed for their effect on surface roughness and interception capacity, which, in turn, informs flash flood potential.
Human activities, a significant modifier of the flood disaster environment and a primary target of such disasters, were examined through the lens of population density to underscore regional disparities in disaster exposure. Furthermore, GDP data was leveraged to assess socioeconomic vulnerability to flash floods. While higher GDP generally suggests increased vulnerability, it also correlates with enhanced disaster resilience, necessitating a nuanced approach to the analysis of these economic indicators.
4.2 The selection and treatment of driving factors
4.2.1 Single-factor driving force analysis
Leveraging ArcGIS software's reclassification capabilities, nine types of influential factors were categorized for evaluation. We conducted an overlay analysis to juxtapose these driving factors with the geographic locations and focal points of flash flood occurrences. ArcGIS was instrumental in generating a corresponding data matrix, which tabulated nine independent driving factors (X) against the dependent variable (Y)—the incidence of flash floods. Upon importing this matrix into the geographic detector model, we executed computations to deduce the individual explanatory power of each factor, as well as the synergistic effects arising from factor interactions. The output from these computations facilitated a comprehensive examination of the forces influencing flash flood catastrophes in Heilongjiang Province.
A single-factor driving force analysis was carried out on each driving factor in Heilongjiang Province, and the results are shown in Table 3.
| Factor | Statistical significance (p) | Explanatory power (q) |
|---|---|---|
| P10 | 0.000 | 0.241 |
| P25 | 0.000 | 0.298 |
| P50 | 0.000 | 0.256 |
| P100 | 0.000 | 0.070 |
| Elevation | 0.000 | 0.100 |
| NDVI | 0.000 | 0.047 |
| Slope | 0.000 | 0.011 |
| Land use | 0.000 | 0.009 |
| Geomorphology | 0.000 | 0.067 |
| Soil | 0.000 | 0.075 |
| Population density | 0.000 | 0.013 |
| GDP | 0.04 | 0.008 |
The analysis of the data set reveals significant insights into the factors contributing to flash flood disasters, as evidenced by P-values for each index being below 0.1. This statistical threshold underscores the relevance of these factors in understanding the occurrence and spatial distribution of such disasters. Among the factors analyzed, Precipitation emerges as the most influential in Heilongjiang Province, with its impact notably surpassing that of elevation and soil composition. The factors, ranked by their explanatory power, are as follows: P25 (0.298), P50 (0.256), and P10 (0.241) lead, followed by Elevation (0.100), Soil (0.075), with lesser contributions from P100 (0.070), Geomorphic (0.067), NDVI (0.047), Population density (0.013), Slope (0.011), Land use (0.009), and GDP (0.008).
The predominance of precipitation in influencing flash flood disasters highlights the critical role of short-duration, high-intensity precipitation events. The variance in explanatory power across different Precipitation intensities underscores the nuanced impact of Precipitation on the spatial distribution of these disasters. Specifically, lower-intensity Precipitation events (P10 and P25), which are more frequent and widespread, have a higher explanatory significance. Conversely, the rarer, high-intensity Precipitation events (P100) exhibit lower explanatory power due to their infrequency and diminished impact on disaster spatial distribution. The height factor has a greater explanatory power to the disaster, indicating that there is a strong consistency between the height and the flash flood disaster. The elevation expresses the elevation change of the terrain, and the lower the elevation area, the more likely it is to cause flash flood disaster.
The impact of soil composition on the spatial distribution of flash flood disasters in Heilongjiang Province is notably significant, underscoring the pivotal role of soil characteristics in influencing these events. Additionally, population density emerges as a critical factor, where higher densities correlate with increased human activity, leading to surface damage and reduced water interception capacity. This chain of events exacerbates the severity of flash flood disasters.
4.2.2 Multi-factor interaction analysis
It can be seen from the interactive detection and analysis results of multi-factor driving forces in Heilongjiang Province (Table 4) that all driving factors interact with each other and jointly affect the change of flash flood disaster. The combined influence of these factors significantly surpasses the explanatory power of any single factor.
| P10 | P25 | P50 | P100 | Elevation | NDVI | Slope | NDVI | Geomorphology | Soil | Population density | GDP | |
|---|---|---|---|---|---|---|---|---|---|---|---|---|
| P10 | 0.241 | |||||||||||
| P25 | 0.324 | 0.298 | ||||||||||
| P50 | 0.315 | 0.257 | 0.256 | |||||||||
| P100 | 0.311 | 0.412 | 0.425 | 0.070 | ||||||||
| Elevation | 0.272 | 0.357 | 0.253 | 0.176 | 0.100 | |||||||
| NDVI | 0.354 | 0.035 | 0.212 | 0.196 | 0.008 | 0.047 | ||||||
| Slope | 0.253 | 0.021 | 0.222 | 0.186 | 0.142 | 0.062 | 0.011 | |||||
| Land use | 0.342 | 0.053 | 0.287 | 0.193 | 0.113 | 0.077 | 0.024 | 0.009 | ||||
| Geomorphology | 0.287 | 0.054 | 0.222 | 0.242 | 0.152 | 0.042 | 0.053 | 0.036 | 0.067 | |||
| Soil | 0.312 | 0.064 | 0.219 | 0.097 | 0.186 | 0.121 | 0.063 | 0.053 | 0.025 | 0.075 | ||
| Population density | 0.276 | 0.011 | 0.199 | 0.094 | 0.114 | 0.114 | 0.053 | 0.043 | 0.011 | 0.022 | 0.013 | |
| GDP | 0.267 | 0.021 | 0.268 | 0.249 | 0.212 | 0.196 | 0.123 | 0.087 | 0.065 | 0.024 | 0.013 | 0.008 |
Through comprehensive calculation and analysis, it has been determined that the combined influence of driving factors on the occurrence and distribution of flash flood disasters in Heilongjiang Province significantly surpasses the explanatory power of any single factor. Specifically, when the combined explanatory power of two factors exceeds that of either factor individually but remains less than their cumulative single-factor explanatory powers, this interaction is classified as synergistic. Examples of such synergistic interactions include the combination of Precipitation Intensity P25 with P100 and with Population Density.
Conversely, when the combined explanatory power of two factors exceeds the sum of their individual contributions, this interaction is identified as a case of nonlinear synergy. Notably, interactions among various factors, such as Precipitation Intensities P10 with P25, P10 with P50, and P25 with factors like Elevation, Slope, Geomorphology, Soil, and NDVI demonstrate significant synergistic effects.
In particular, the interactions between Precipitation and Elevation play a critical role in flood risk patterns. Areas with both high precipitation and low elevation exhibited the greatest flood risk, as water accumulated quickly in these regions. Similarly, Land Use and Slope also interacted to increase flood risk: steep slopes, combined with land use changes (such as deforestation or urbanization), led to increased runoff, further heightening the flash flood risk. A deeper analysis of these interactions reveals why certain combinations, such as high precipitation and low elevation, are particularly significant. In these areas, the lack of natural drainage due to low elevation, combined with heavy rainfall, leads to rapid surface runoff and higher flood risk. Similarly, deforestation or urbanization on steep slopes can exacerbate the natural drainage issues, causing a further increase in runoff. These combined effects underscore the importance of considering both individual and interacting factors when assessing flash flood risk. The practical implications of these findings are critical for disaster prevention and mitigation strategies. For instance, understanding the interaction between precipitation and elevation can inform flood control infrastructure, such as the strategic placement of drainage systems or flood barriers in high-risk areas. Similarly, land use management, particularly controlling urbanization on steep slopes, can significantly reduce the potential for increased runoff and flood risk. These insights highlight the need for a more nuanced approach to risk assessment that takes into account the complex interplay of various factors.
4.3 Flash flood disaster risk evaluation and ranking
According to the existing research and literature, the selected evaluation indicators are shown in Figure 8. This paper conducts risk evaluation and ranking of six areas with high risk of flash flood disaster in Heilongjiang Province (Figure 9).
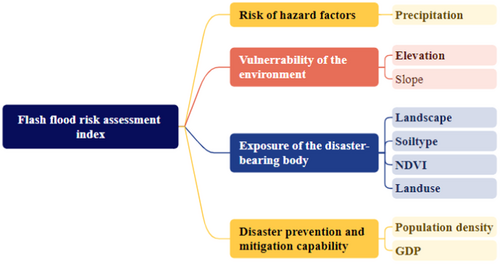
The interval numbers weights of the evaluation indicators are shown in Table 5. The x1x9 are Precipitation, Elevation, NDVI, Slope, Land Use, Geomorphology, Soil, Population Density, and GDP.
The evaluation indicators are normalized by using Equations (9) and (10). The values of the interval values of the evaluation indicators of each program are shown in Table 6. The comprehensive evaluation interval values calculated by using Equation (11) are shown in Table 7.
So for flash flood risk in these areas:
Bayan Shuangcheng Boli Suibin Hailun Yian
Comparative analysis using April 2018 monitoring data, alongside a review of relevant literature and historical flash flood patterns in Heilongjiang (Table 8), validates that regions such as Bayan, Shuangcheng, Boli, Suibin, Hailun, and Yian are indeed prone to frequent flash floods, confirming the reliability of the monitoring results as a referential tool.
The data in Tables 5–7, 9 highlights the Bayan River area as having the highest flash flood risk and the lowest life expectancy among the evaluated regions. This conclusion is drawn from its notably low precipitation and relative humidity indices, signifying a high likelihood of flash flood occurrence, limited disaster prevention capabilities, and significant vulnerability of the inhabitants. Conversely, the Yian area exhibits a more robust disaster-resilient environment. Despite the exposure to substantial water volumes, the area's risk factors for flash flood are minimal, and the capacity for disaster prevention is robust, resulting in a lower flash flood risk.
| x1 | x2 | x3 | x4 | x5 | x6 | x7 | x8 | x9 | |
|---|---|---|---|---|---|---|---|---|---|
| kj | 74 | 72 | 75 | 69 | 48 | 37 | 36 | 25 | 22 |
| ωj* | 0.21 | 0.19 | 0.23 | 0.14 | 0.12 | 0.15 | 0.12 | 0.09 | 0.05 |
| ωjs | 0.16 | 0.16 | 0.16 | 0.15 | 0.10 | 0.08 | 0.08 | 0.05 | 0.05 |
| ωjq | 0.21 | 0.18 | 0.23 | 0.13 | 0.08 | 0.07 | 0.06 | 0.03 | 0.01 |
| [0.16, 0.21] | [0.16, 0.18] | [0.16, 0.23] | [0.13, 0.15] | [0.08, 0.10] | [0.07, 0.08] | [0.06, 0.08] | [0.03, 0.05] | [0.01, 0.05] |
| Area | Precipitation (x1) | NDVI (x6) | Population density (x8) | GDP (x9) | ||||
|---|---|---|---|---|---|---|---|---|
| Lower bound | Upper bound | Lower bound | Upper bound | Upper bound | Lower bound | Lower bound | Upper bound | |
| Bayan | 0.63 | 0.75 | 0.82 | 1 | 0.27 | 0.76 | 0.76 | 0.92 |
| Shuangcheng | 0.72 | 0.83 | 0.51 | 0.62 | 0.17 | 0.65 | 0.65 | 0.79 |
| Boli | 0.68 | 0.83 | 0.47 | 0.58 | 0.28 | 0.74 | 0.74 | 0.9 |
| Suibin | 0.6 | 0.73 | 0.4 | 0.49 | 0.15 | 0.6 | 0.6 | 0.74 |
| Hailun | 0.82 | 1 | 0.39 | 0.48 | 0.36 | 0.77 | 0.77 | 0.95 |
| Yian | 0.65 | 0.79 | 0.39 | 0.48 | 0.4 | 0.65 | 0.65 | 0.79 |
| Area | Elevation (x2) | Slope (x3) | Landscape (x4) | Soil (x5) | Landuse (x7) |
|---|---|---|---|---|---|
| Bayan | 1 | 0.22 | 0.01 | 0.03 | 0.92 |
| Shuangcheng | 0.07 | 0.23 | 0.15 | 0.44 | 0.9 |
| Boli | 0.03 | 0.12 | 0.21 | 0.6 | 0.74 |
| Suibin | 0.04 | 0.3 | 0.29 | 0.79 | 0.95 |
| Hailun | 0.51 | 0.33 | 0.41 | 0.59 | 0.79 |
| Yian | 0.61 | 0.82 | 0.82 | 0.1 | 1 |
| Date | Location | Flood impact |
|---|---|---|
| 2018/7/20 | Bayan | Increased upstream water from two rivers caused widespread over-topping in Zhuti River and Shaoling River, flooding villages, submerging farmland, and evacuating 406 households and 1300 people. |
| 2023/8/8 | Shuangcheng | Typhoon caused strong rainfall, exceeding water levels in multiple rivers, surrounding Zheng'an Village with floodwaters, and submerging rice fields, leading to significant losses for farmers. |
| 2023/6/14 | Boli | Woken River exceeded the warning level by 0.18 m, with water levels rising, reaching flood standards. |
| 2023/8/24 | Suibin | Dam breach at the Erjiao Farm on the Heilongjiang River caused flooding in nearby villages, collapsing some houses. Seven townships and 91 villages affected, with 36,000 people impacted. |
| 2023/8/2 | Hailun | Continuous red rainstorm warnings issued, with parts of Hailun city experiencing over 100 mm of rainfall. |
| 2014/7/21 | Yian | Yian County experienced a once-in-50-year flood, destroying three bridges and affecting 15 townships, with 80,000 people impacted and direct economic losses of 140 million yuan. |
| Area | Bayan | Shuangcheng | Boli | Suibin | Hailun | Yian |
|---|---|---|---|---|---|---|
| [0.528, 0.836] | [0.584, 0.644] | [0.494, 0.604] | [0.331, 0.511] | [0.461, 0.517] | [0.419, 0.546] |
Employing the Cartesian coordinate system, foundational functions, and plane geometry, the model represents interval numbers on the Gaussian plane, facilitating a more transparent and intuitive understanding of their relative relationships. The Yian is characterized by an interval value of [0.419, 0.546], while the highest risk area, Bayan, has an interval value of [0.528, 0.836]. These findings diverge from remote sensing-based flash flood evaluations by factoring in not just the risk of flash flood-inducing factors but also the sensitivity of the environment to disaster, the exposure level of the affected population, and the strength of disaster prevention and mitigation efforts.
The findings from this study diverge from remote sensing-based evaluations of flash floods, as they incorporate not just risk-inducing factors but also the sensitivity of the environment, population exposure, and disaster prevention capacity. For instance, Bayan's high flood risk can be attributed to both environmental factors (e.g., high precipitation, low elevation) and its weak disaster resilience, whereas Yian demonstrates a more robust disaster management framework, resulting in lower risk despite facing substantial water exposure. Future research should explore the dynamic relationship between land use changes and flash flood risks, as well as the potential for integrating real-time data into the risk assessment models.
5 CONCLUSION
This study focused on evaluating flash flood disaster risk in Heilongjiang Province, China, by analyzing nine disaster-related factors: rainfall, elevation, slope, landform, soil type, NDVI, land use, population density, and GDP. Using the GDM, we identified the significant drivers of flash flood disasters. The findings indicate that rainfall has the greatest impact on flash flood disasters in the province, followed by elevation and soil type. In Heilongjiang, population density, rainfall, and landform are also critical contributors to flash flood risks. Rainfall is both the direct cause and triggering condition for flash floods, while topography provides the material basis and potential, and human activities exacerbate the severity of the disaster. The analysis also highlights that the explanatory power of interactions between two factors in each region exceeds that of individual factors, suggesting that the combined effects of multiple factors significantly increase the likelihood and severity of flash floods.
Building on this, we applied the findings to assess and rank flash flood risk across six regions of Heilongjiang Province. The evaluation considered factors such as hazard risk, environmental vulnerability, exposure of disaster-bearing entities, and disaster prevention and mitigation capabilities. The results revealed that Bayan is the area with the highest risk of flash floods, while Yian has the lowest.
This study underscores the importance of risk analysis in understanding the complexities and uncertainties of agricultural flash flood disasters. By leveraging modern scientific advances and risk quantification techniques, the research provides a more reliable risk grading system, which is crucial for improving disaster management and mitigating flash flood impacts. However, the study has limitations, particularly with the accuracy of the risk assessment due to the reliance on historical data and the model's limited consideration of future climate change impacts. To improve the model's accuracy and applicability, future research should integrate real-time weather data, satellite data, and climate projections.
ACKNOWLEDGMENTS
This study was supported by the National Natural Science Foundation of China (No: 42271095) and IWHR Research & Development Support Program (JZ110145B0032024).
ETHICS STATEMENT
None declared.
Open Research
DATA AVAILABILITY STATEMENT
The data that support the findings of this study are available from the corresponding author upon reasonable request.


